| Param | Original file | Final file |
|---|---|---|
| Filename | modeM0/AS1C03_020T01_9000001706cztM0_level2.fits | modeM0/AS1C03_020T01_9000001706cztM0_level2_quad_clean.evt |
| Size (bytes) | 634,570,560 | 595,134,720 |
| Size | 605.2 MB | 567.6 MB |
| Events in quadrant A | 3,609,146 | 3,137,649 |
| Events in quadrant B | 3,725,942 | 3,484,581 |
| Events in quadrant C | 3,902,400 | 3,551,874 |
| Events in quadrant D | 3,311,032 | 3,187,444 |
| Mode M0 | |||
|---|---|---|---|
| Quadrant | BADHDUFLAG | Total packets | Discarded packets |
| A | 0 | 266875 | 0 |
| B | 0 | 193623 | 0 |
| C | 0 | 140025 | 0 |
| D | 0 | 178914 | 0 |
| Mode M9 | |||
|---|---|---|---|
| Quadrant | BADHDUFLAG | Total packets | Discarded packets |
| A | 0 | 113 | 0 |
| B | 0 | 113 | 0 |
| C | 0 | 113 | 0 |
| D | 0 | 113 | 0 |
| Mode SS | |||
|---|---|---|---|
| Quadrant | BADHDUFLAG | Total packets | Discarded packets |
| A | 0 | 1382 | 0 |
| B | 0 | 1382 | 0 |
| C | 0 | 1382 | 0 |
| D | 0 | 1382 | 0 |
| Quadrant | Total seconds | Saturated seconds | Saturation percentage |
|---|---|---|---|
| A | 67966 | 13537 | 19.917312% |
| B | 67966 | 5091 | 7.490510% |
| C | 67966 | 521 | 0.766560% |
| D | 67966 | 3416 | 5.026042% |
Noise dominated data is calculated using 1-second bins in cleaned event files. If a bin has >2000 counts, and if more than 50% of those come from <1% of pixels, then it is considered to be noise-dominated and hence unusable.
| Quadrant | # 1 sec bins | Bins with >0 counts | Bins with >2000 counts | High rate bins dominated by noise | Noise dominated (total time) | Noise dominated (detector-on time) | Marked lightcurve |
|---|---|---|---|---|---|---|---|
| A | 79166 | 67854 | 0 | 0 | 0.00% | 0.00% |  |
| B | 79166 | 67932 | 0 | 0 | 0.00% | 0.00% |  |
| C | 79166 | 67966 | 0 | 0 | 0.00% | 0.00% |  |
| D | 79166 | 67558 | 0 | 0 | 0.00% | 0.00% |  |
Top three noisy pixels from each quadrant. If the there are fewer than three noisy pixels in the level2.evt file, extra rows are filled as -1
| Pixel properties | Quadrant properties | ||||||
|---|---|---|---|---|---|---|---|
| Quadrant | DetID | PixID | Counts | Sigma | Mean | Median | Sigma |
| A | 0 | 29 | 3418 | 10.75 | 938 | 874 | 236.6 |
| A | 7 | 110 | 2941 | 8.74 | 938 | 874 | 236.6 |
| A | 0 | 30 | 2666 | 7.58 | 938 | 874 | 236.6 |
| B | 2 | 9 | 3239 | 11.64 | 984 | 937 | 197.8 |
| B | 5 | 128 | 2517 | 7.99 | 984 | 937 | 197.8 |
| B | 14 | 254 | 2497 | 7.89 | 984 | 937 | 197.8 |
| C | 1 | 80 | 2918 | 7.4 | 1028 | 953 | 265.7 |
| C | 1 | 81 | 2840 | 7.1 | 1028 | 953 | 265.7 |
| C | 12 | 241 | 2703 | 6.59 | 1028 | 953 | 265.7 |
| D | 3 | 14 | 2517 | 6.52 | 945 | 855 | 254.8 |
| D | 3 | 31 | 2389 | 6.02 | 945 | 855 | 254.8 |
| D | 3 | 159 | 2340 | 5.83 | 945 | 855 | 254.8 |
Histogram calculated using DETX and DETY for each event in the final _common_clean file
| Quadrant A | 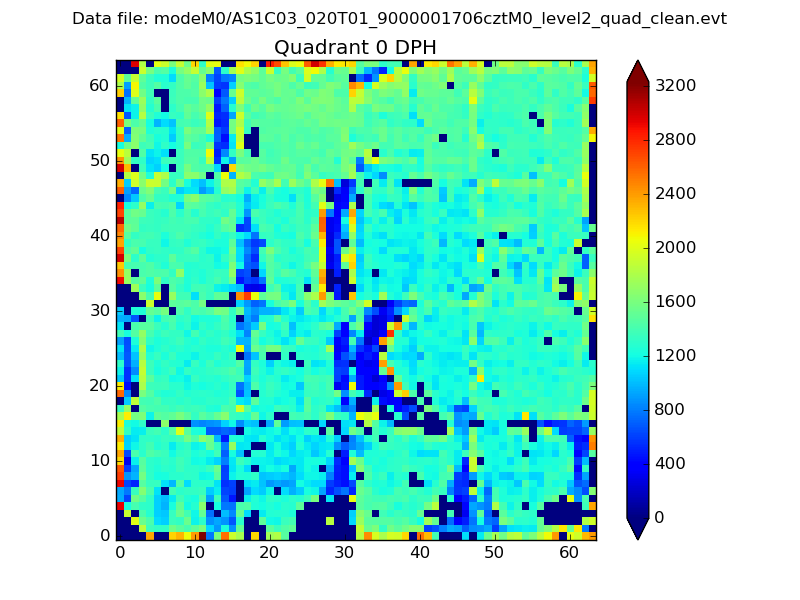 |
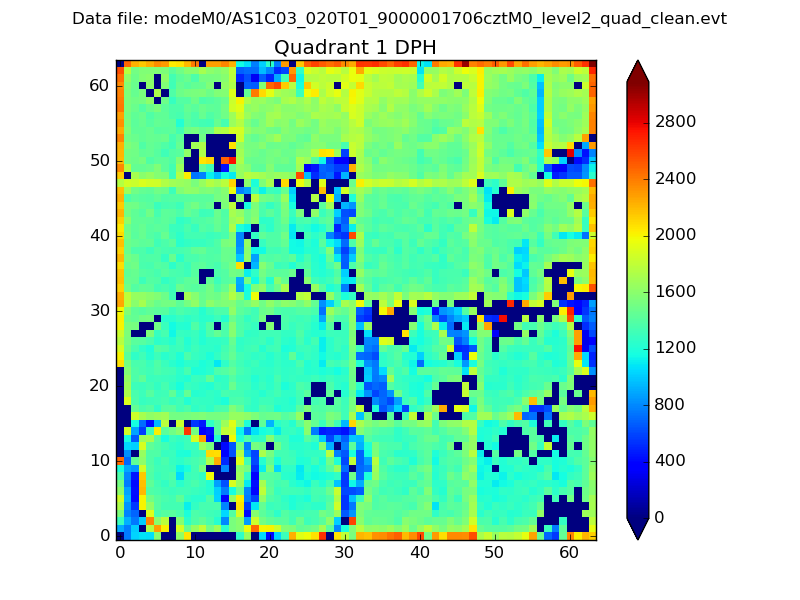 |
Quadrant B |
|---|---|---|---|
| Quadrant D | 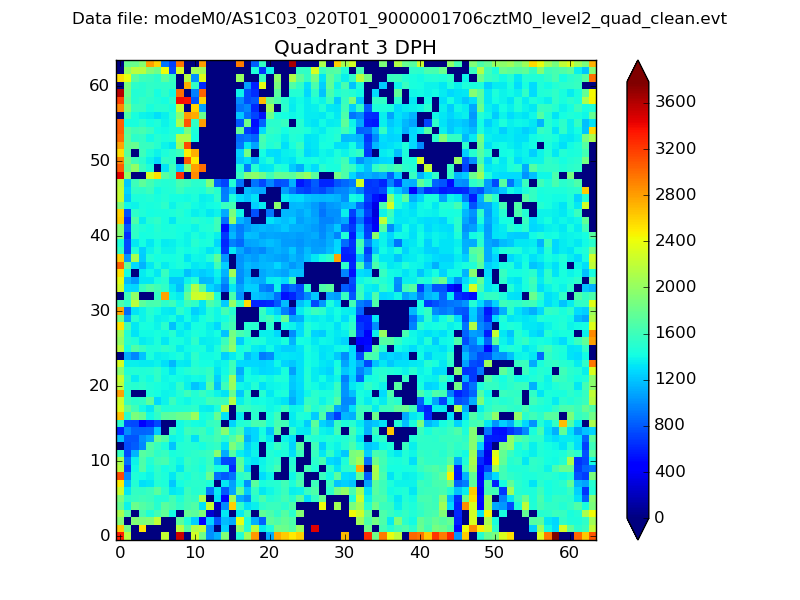 |
 |
Quadrant C |
| Plot type | Count rate plots | Images |
|---|---|---|
| Comparison with Poisson distribution Blue bars denote a histogram of data divided into 1 sec bins. Red curve is a Poisson curve with rate = median count rate of data. |
 |
 |
| Quadrant-wise count rates Data is divided into 100 sec bins |
 |
|
| Module-wise count rates for Quadrant A Data is divided into 100 sec bins |
 |
 |
| Module-wise count rates for Quadrant B Data is divided into 100 sec bins |
 |
 |
| Module-wise count rates for Quadrant C Data is divided into 100 sec bins |
 |
 |
| Module-wise count rates for Quadrant D Data is divided into 100 sec bins |
 |
 |
| Parameter | Plot |
|---|---|
| CZT HV Monitor |  |
| D_VDD | 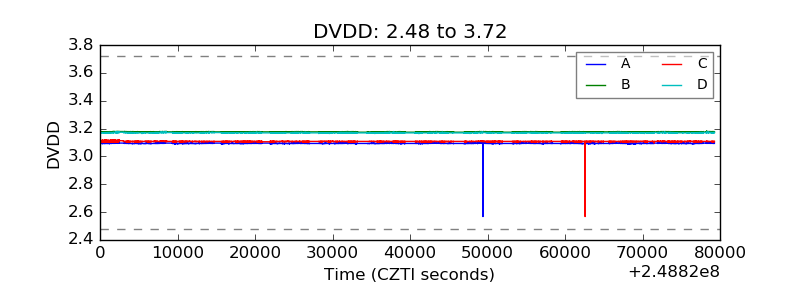 |
| Temperature 1 |  |
| Veto HV Monitor |  |
| Veto LLD |  |
| Alpha Counter |  |
| _CPM_Rate |  |
| CZT Counter |  |
| +2.5 Volts monitor |  |
| +5 Volts monitor |  |
| _ROLL_ROT |  |
| _Roll_DEC |  |
| _Roll_RA |  |
| Veto Counter |  |