| Param | Original file | Final file |
|---|---|---|
| Filename | modeM0/AS1C03_020T01_9000001706_11602cztM0_level2.evt | modeM0/AS1C03_020T01_9000001706_11602cztM0_level2_quad_clean.evt |
| Size (bytes) | 1,725,989,760 | 167,241,600 |
| Size | 1.6 GB | 159.5 MB |
| Events in quadrant A | 20,042,466 | 913,500 |
| Events in quadrant B | 11,261,007 | 1,036,672 |
| Events in quadrant C | 6,793,337 | 1,086,123 |
| Events in quadrant D | 13,166,320 | 991,715 |
| Mode M0 | |||
|---|---|---|---|
| Quadrant | BADHDUFLAG | Total packets | Discarded packets |
| A | 0 | 70046 | 4 |
| B | 0 | 43475 | 3 |
| C | 0 | 30444 | 3 |
| D | 0 | 49478 | 3 |
| Mode M9 | |||
|---|---|---|---|
| Quadrant | BADHDUFLAG | Total packets | Discarded packets |
| A | 0 | 21 | 0 |
| B | 0 | 21 | 0 |
| C | 0 | 21 | 0 |
| D | 0 | 21 | 0 |
| Mode SS | |||
|---|---|---|---|
| Quadrant | BADHDUFLAG | Total packets | Discarded packets |
| A | 0 | 304 | 0 |
| B | 0 | 304 | 0 |
| C | 0 | 304 | 0 |
| D | 0 | 304 | 0 |
| Quadrant | Total seconds | Saturated seconds | Saturation percentage |
|---|---|---|---|
| A | 15001 | 4903 | 32.684488% |
| B | 15001 | 1353 | 9.019399% |
| C | 15001 | 69 | 0.459969% |
| D | 15001 | 1603 | 10.685954% |
Noise dominated data is calculated using 1-second bins in cleaned event files. If a bin has >2000 counts, and if more than 50% of those come from <1% of pixels, then it is considered to be noise-dominated and hence unusable.
| Quadrant | # 1 sec bins | Bins with >0 counts | Bins with >2000 counts | High rate bins dominated by noise | Noise dominated (total time) | Noise dominated (detector-on time) | Marked lightcurve |
|---|---|---|---|---|---|---|---|
| A | 16992 | 15005 | 3281 | 3281 | 19.31% | 21.87% | 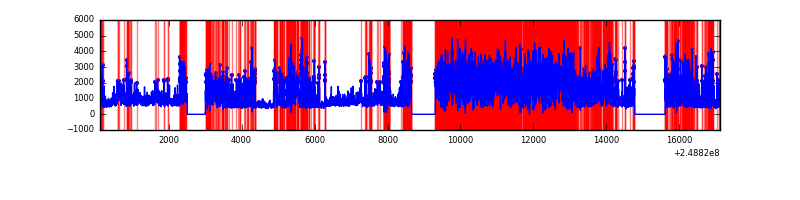 |
| B | 16992 | 15005 | 708 | 708 | 4.17% | 4.72% | 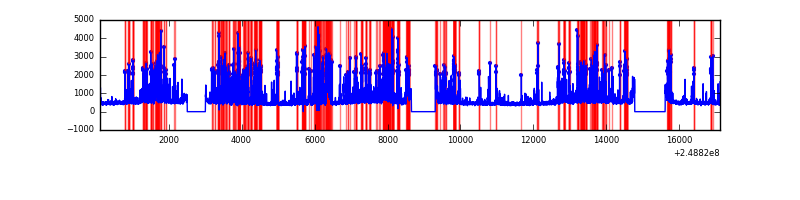 |
| C | 16992 | 15005 | 0 | 0 | 0.00% | 0.00% | 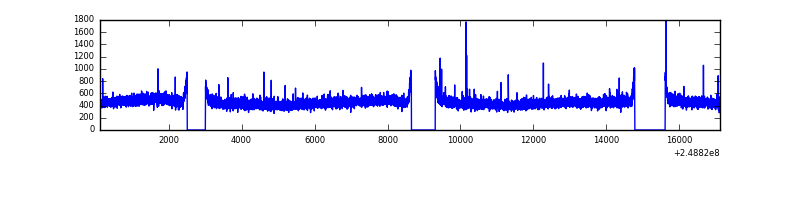 |
| D | 16992 | 15005 | 1258 | 1258 | 7.40% | 8.38% | 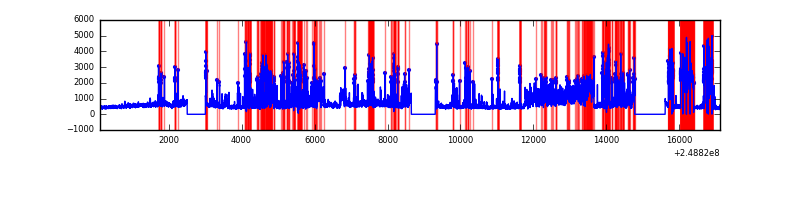 |
Top three noisy pixels from each quadrant. If the there are fewer than three noisy pixels in the level2.evt file, extra rows are filled as -1
| Pixel properties | Quadrant properties | ||||||
|---|---|---|---|---|---|---|---|
| Quadrant | DetID | PixID | Counts | Sigma | Mean | Median | Sigma |
| A | 8 | 5 | 13211218 | 42367.64 | 1529 | 1495 | 311.8 |
| A | 1 | 162 | 314702 | 1004.55 | 1529 | 1495 | 311.8 |
| A | 1 | 178 | 181475 | 577.25 | 1529 | 1495 | 311.8 |
| B | 4 | 239 | 2221339 | 6647.62 | 1734 | 1690 | 333.9 |
| B | 10 | 16 | 1291624 | 3863.22 | 1734 | 1690 | 333.9 |
| B | 4 | 81 | 571600 | 1706.82 | 1734 | 1690 | 333.9 |
| C | 12 | 4 | 19007 | 42.73 | 1733 | 1741 | 404.0 |
| C | 13 | 61 | 12929 | 27.69 | 1733 | 1741 | 404.0 |
| C | 9 | 54 | 12347 | 26.25 | 1733 | 1741 | 404.0 |
| D | 1 | 52 | 4665679 | 11948.33 | 1615 | 1564 | 390.4 |
| D | 13 | 122 | 1688035 | 4320.33 | 1615 | 1564 | 390.4 |
| D | 10 | 253 | 284456 | 724.7 | 1615 | 1564 | 390.4 |
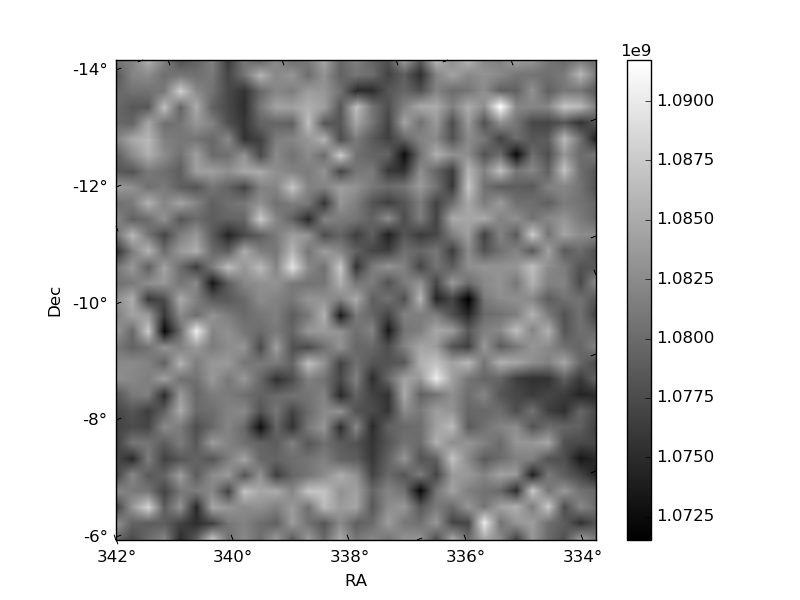
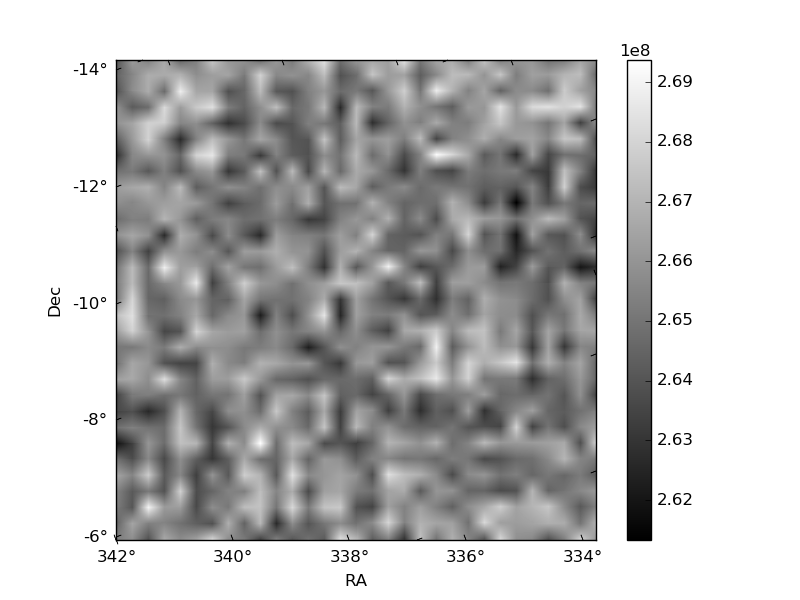
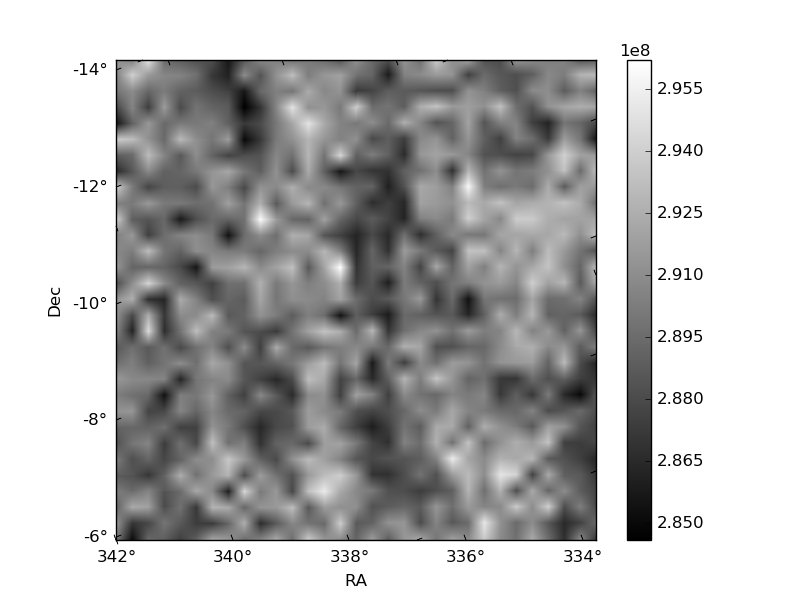
Histogram calculated using DETX and DETY for each event in the final _common_clean file
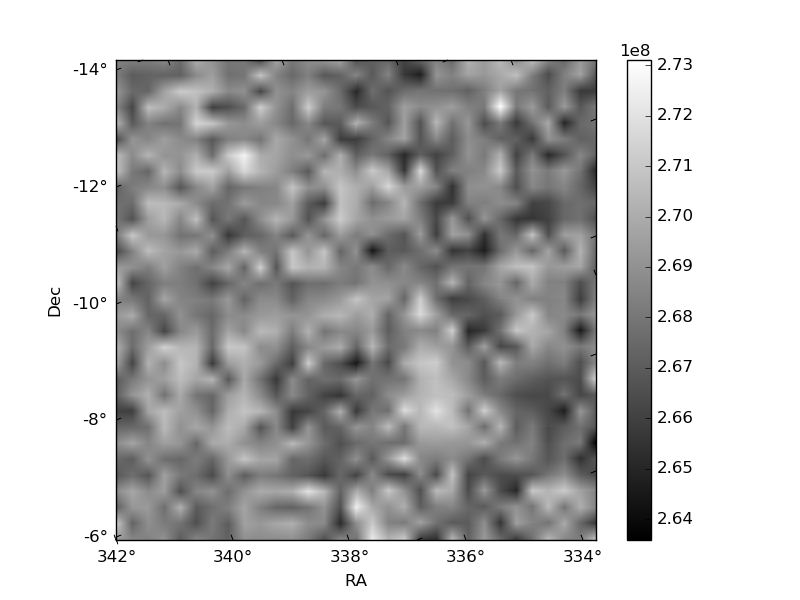
| Quadrant A | 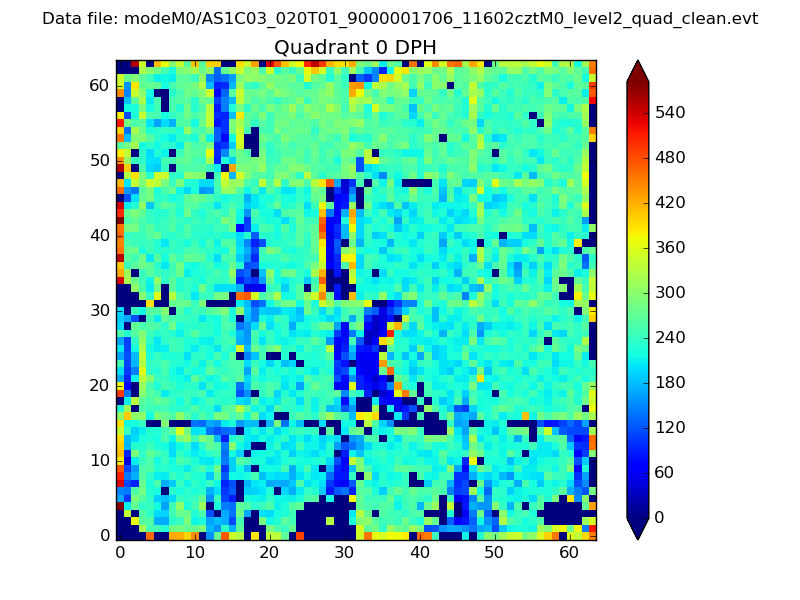 |
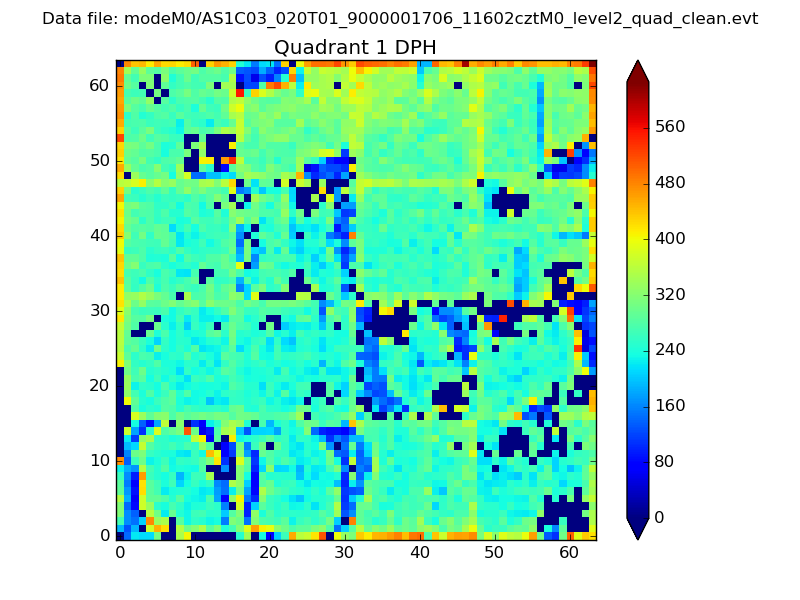 |
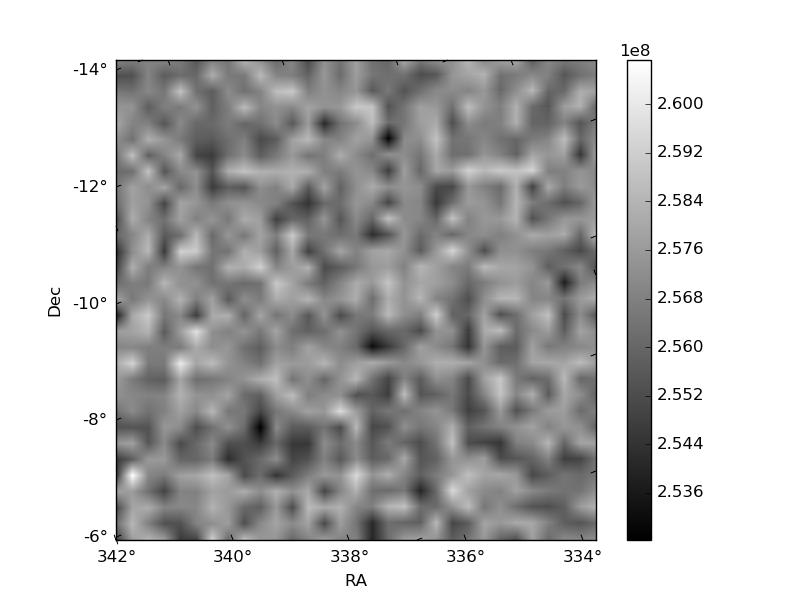
Quadrant B |
|---|---|---|---|
| Quadrant D | 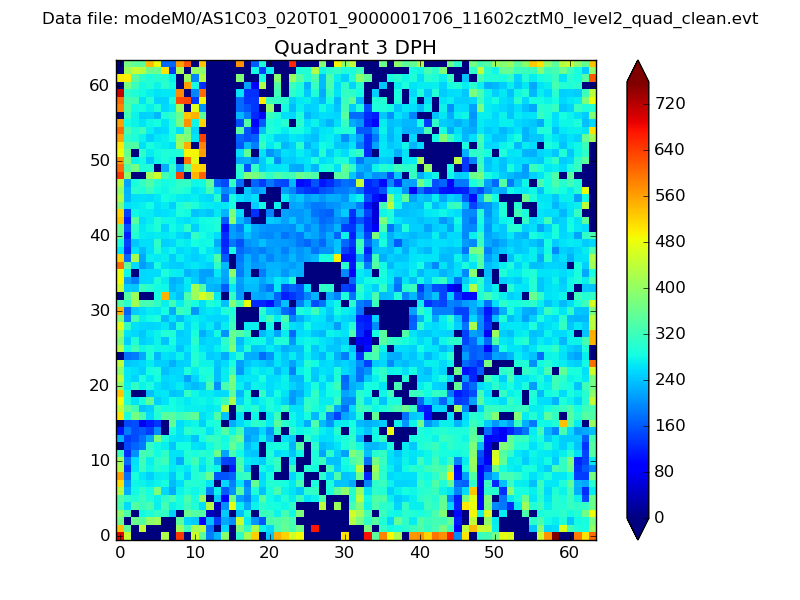 |
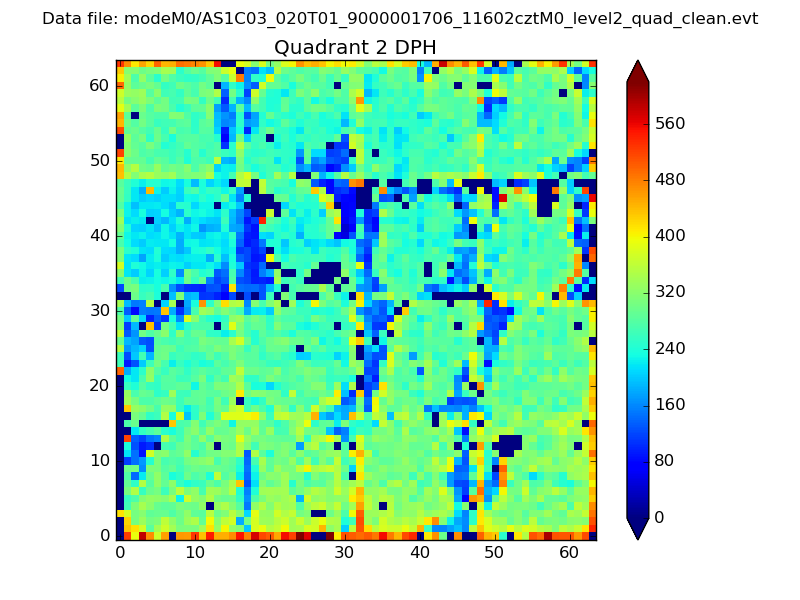 |
Quadrant C |
| Plot type | Count rate plots | Images |
|---|---|---|
| Comparison with Poisson distribution Blue bars denote a histogram of data divided into 1 sec bins. Red curve is a Poisson curve with rate = median count rate of data. |
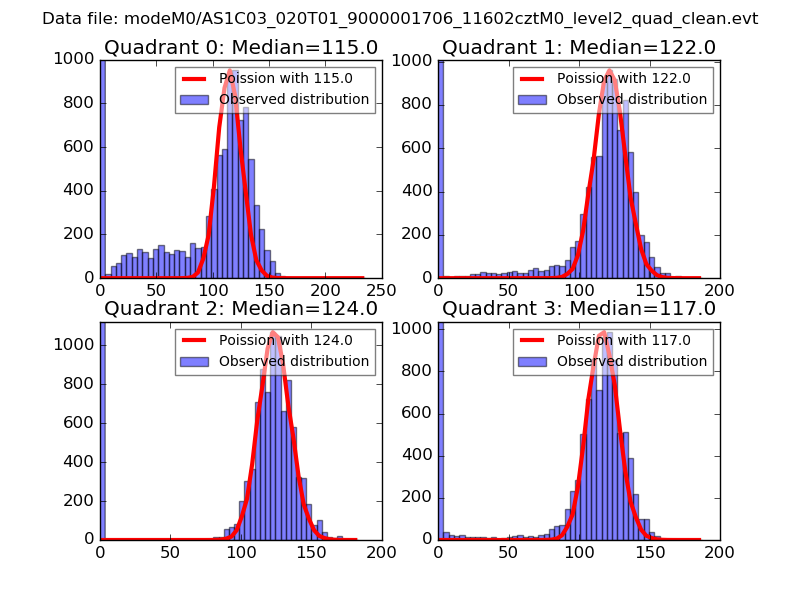 |
 |
| Quadrant-wise count rates Data is divided into 100 sec bins |
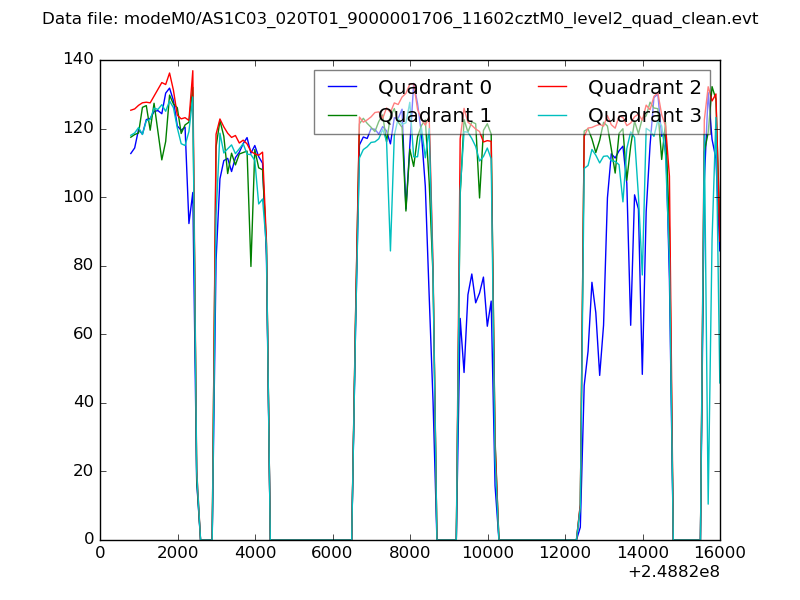 |
|
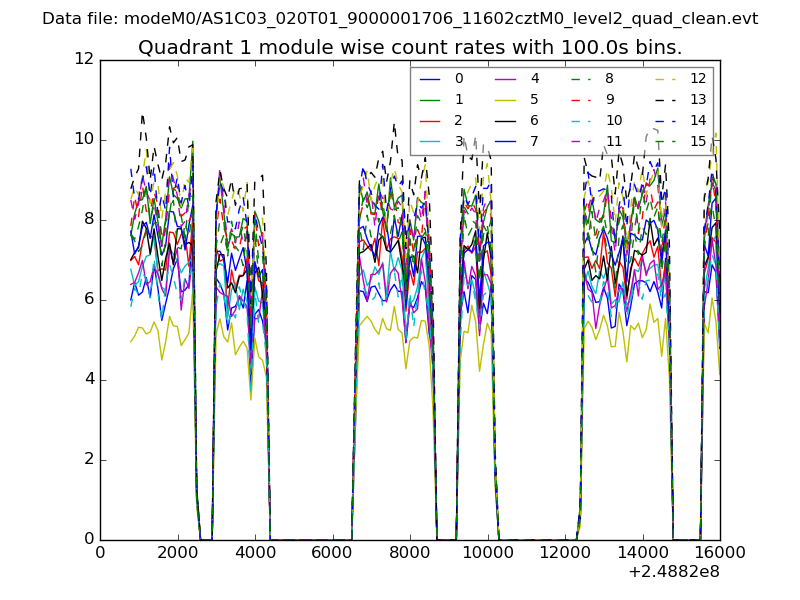
| Module-wise count rates for Quadrant A Data is divided into 100 sec bins |
 |
 |
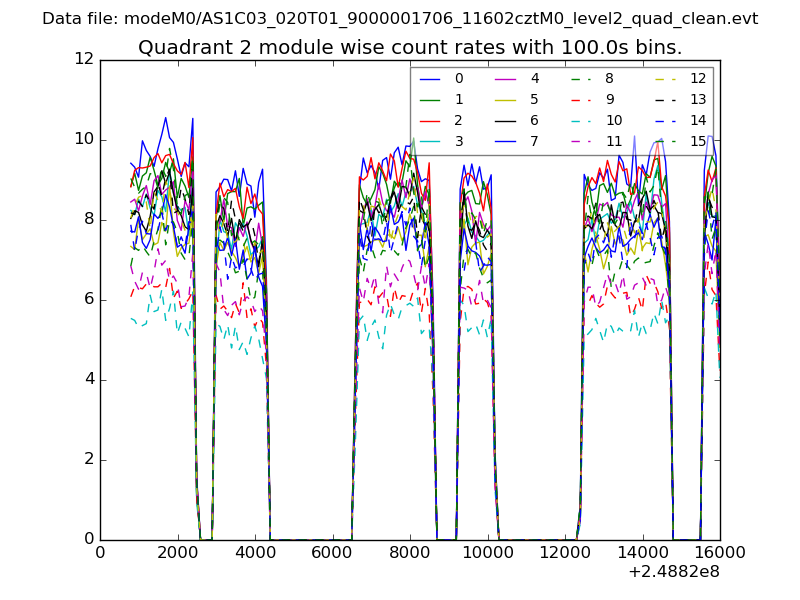
| Module-wise count rates for Quadrant B Data is divided into 100 sec bins |
 |
 |
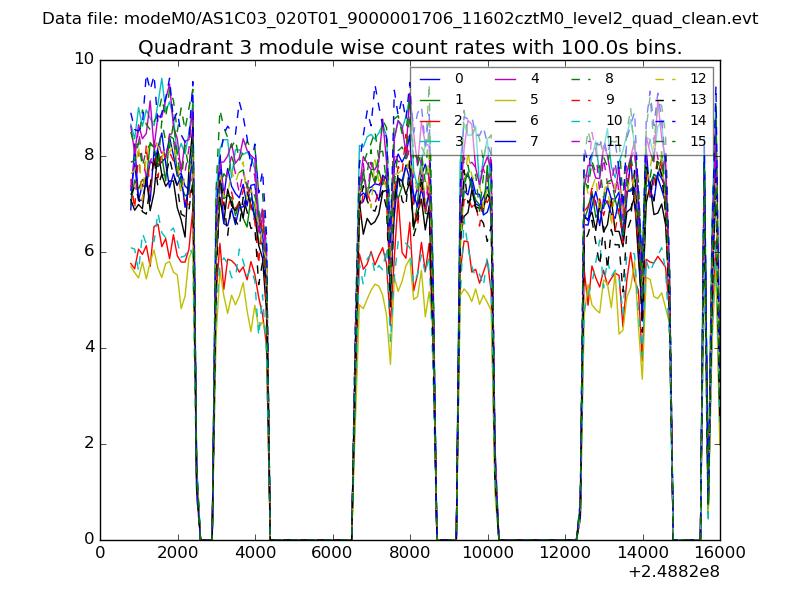
| Module-wise count rates for Quadrant C Data is divided into 100 sec bins |
 |
 |
| Module-wise count rates for Quadrant D Data is divided into 100 sec bins |
 |
 |
| Parameter | Plot |
|---|---|
| CZT HV Monitor | 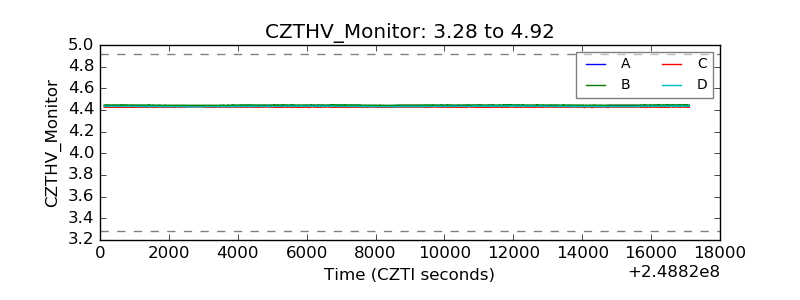 |
| D_VDD | 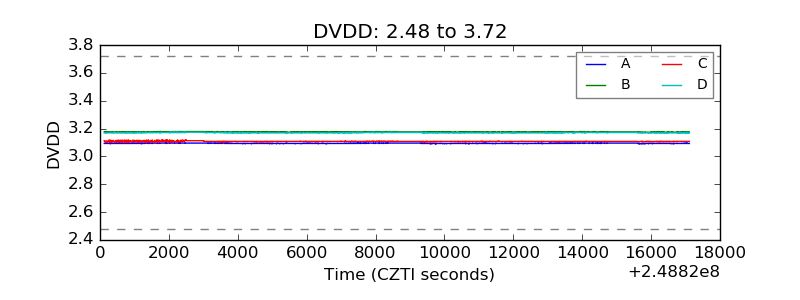 |
| Temperature 1 | 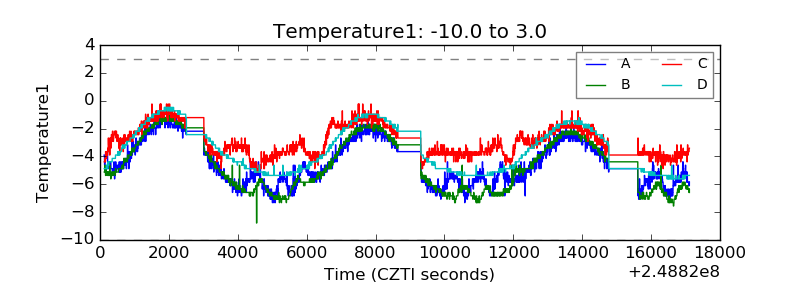 |
| Veto HV Monitor | 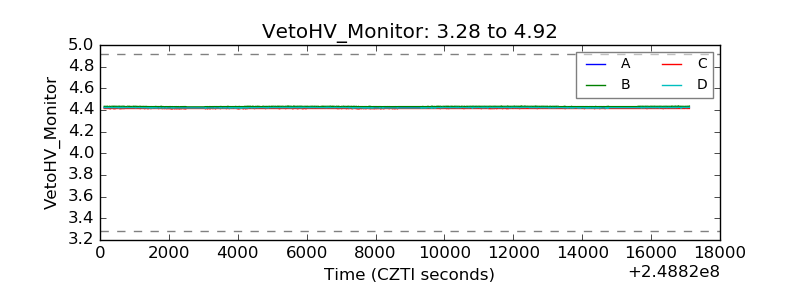 |
| Veto LLD |  |
| Alpha Counter | 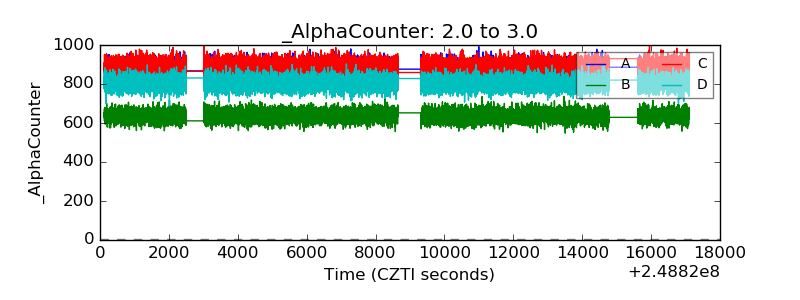 |
| _CPM_Rate | 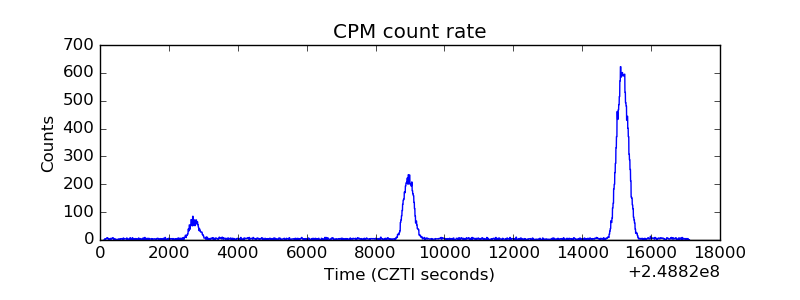 |
| CZT Counter | 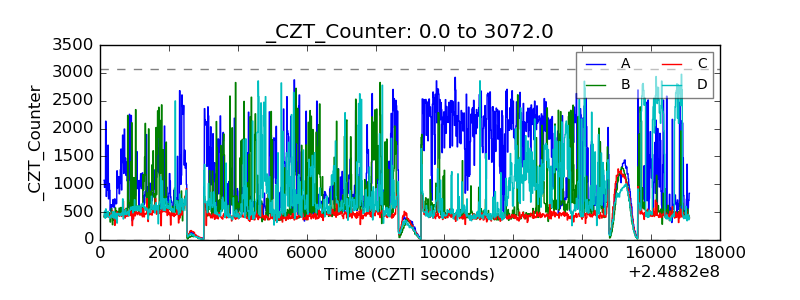 |
| +2.5 Volts monitor |  |
| +5 Volts monitor |  |
| _ROLL_ROT | 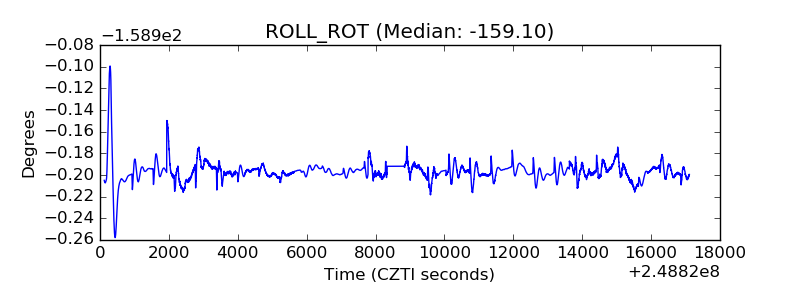 |
| _Roll_DEC | 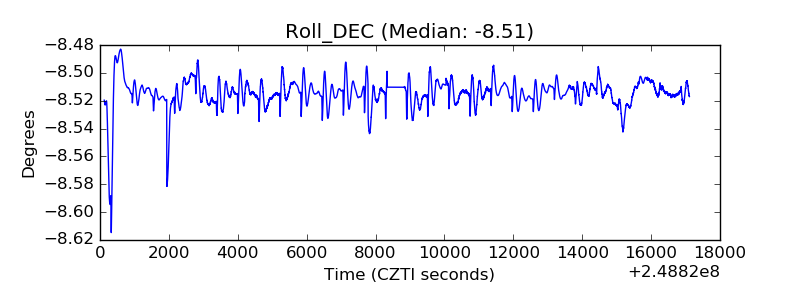 |
| _Roll_RA | 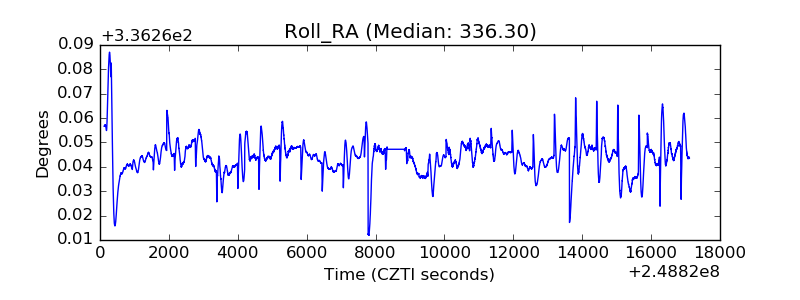 |
| Veto Counter | 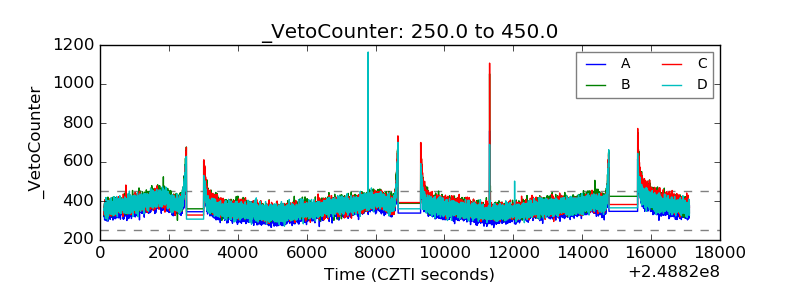 |