| Param | Original file | Final file |
|---|---|---|
| Filename | modeM0/AS1C03_020T01_9000001706_11603cztM0_level2.evt | modeM0/AS1C03_020T01_9000001706_11603cztM0_level2_quad_clean.evt |
| Size (bytes) | 677,900,160 | 61,853,760 |
| Size | 646.5 MB | 59.0 MB |
| Events in quadrant A | 7,621,139 | 331,577 |
| Events in quadrant B | 4,668,807 | 364,188 |
| Events in quadrant C | 3,022,968 | 376,866 |
| Events in quadrant D | 4,770,462 | 338,883 |
| Mode M0 | |||
|---|---|---|---|
| Quadrant | BADHDUFLAG | Total packets | Discarded packets |
| A | 0 | 27241 | 3 |
| B | 0 | 18143 | 2 |
| C | 0 | 13459 | 2 |
| D | 0 | 18724 | 2 |
| Mode M9 | |||
|---|---|---|---|
| Quadrant | BADHDUFLAG | Total packets | Discarded packets |
| A | 0 | 10 | 0 |
| B | 0 | 10 | 0 |
| C | 0 | 10 | 0 |
| D | 0 | 10 | 0 |
| Mode SS | |||
|---|---|---|---|
| Quadrant | BADHDUFLAG | Total packets | Discarded packets |
| A | 0 | 134 | 0 |
| B | 0 | 134 | 0 |
| C | 0 | 134 | 0 |
| D | 0 | 134 | 0 |
| Quadrant | Total seconds | Saturated seconds | Saturation percentage |
|---|---|---|---|
| A | 6605 | 1357 | 20.545042% |
| B | 6605 | 434 | 6.570780% |
| C | 6605 | 28 | 0.423921% |
| D | 6605 | 817 | 12.369417% |
Noise dominated data is calculated using 1-second bins in cleaned event files. If a bin has >2000 counts, and if more than 50% of those come from <1% of pixels, then it is considered to be noise-dominated and hence unusable.
| Quadrant | # 1 sec bins | Bins with >0 counts | Bins with >2000 counts | High rate bins dominated by noise | Noise dominated (total time) | Noise dominated (detector-on time) | Marked lightcurve |
|---|---|---|---|---|---|---|---|
| A | 7586 | 6607 | 932 | 932 | 12.29% | 14.11% | 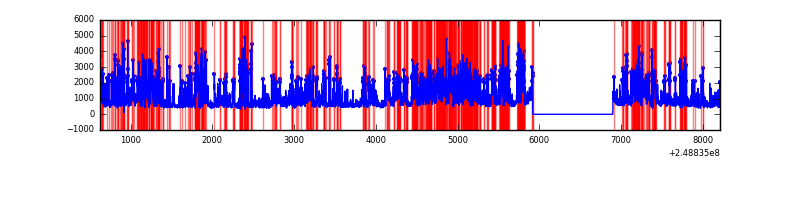 |
| B | 7586 | 6607 | 253 | 253 | 3.34% | 3.83% | 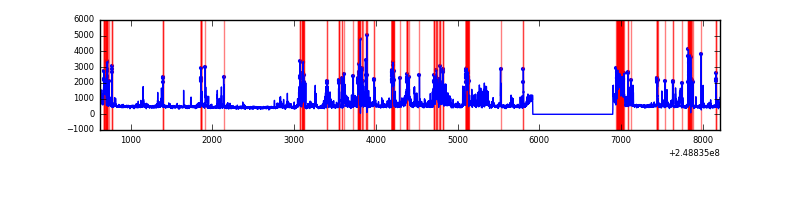 |
| C | 7586 | 6607 | 0 | 0 | 0.00% | 0.00% | 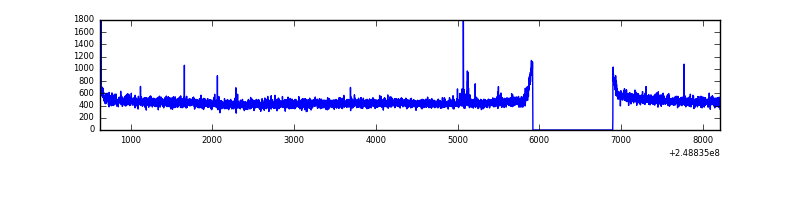 |
| D | 7586 | 6607 | 730 | 730 | 9.62% | 11.05% | 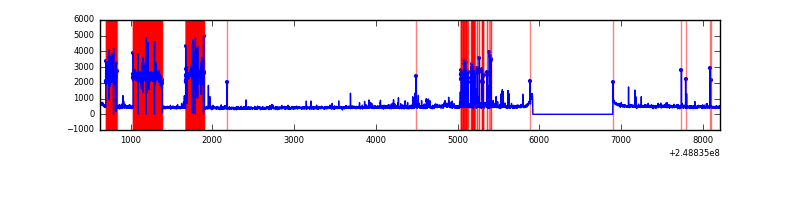 |
Top three noisy pixels from each quadrant. If the there are fewer than three noisy pixels in the level2.evt file, extra rows are filled as -1
| Pixel properties | Quadrant properties | ||||||
|---|---|---|---|---|---|---|---|
| Quadrant | DetID | PixID | Counts | Sigma | Mean | Median | Sigma |
| A | 8 | 5 | 4437331 | 29642.34 | 731 | 716 | 149.7 |
| A | 1 | 162 | 124216 | 825.14 | 731 | 716 | 149.7 |
| A | 1 | 178 | 71274 | 471.42 | 731 | 716 | 149.7 |
| B | 4 | 239 | 864387 | 5812.58 | 775 | 756 | 148.6 |
| B | 10 | 16 | 299201 | 2008.65 | 775 | 756 | 148.6 |
| B | 4 | 81 | 240922 | 1616.41 | 775 | 756 | 148.6 |
| C | 14 | 234 | 11037 | 57.17 | 771 | 775 | 179.5 |
| C | 13 | 61 | 5688 | 27.37 | 771 | 775 | 179.5 |
| C | 12 | 4 | 5077 | 23.97 | 771 | 775 | 179.5 |
| D | 1 | 52 | 2060217 | 12346.57 | 686 | 667 | 166.8 |
| D | 8 | 195 | 48052 | 284.06 | 686 | 667 | 166.8 |
| D | 13 | 104 | 22692 | 132.04 | 686 | 667 | 166.8 |
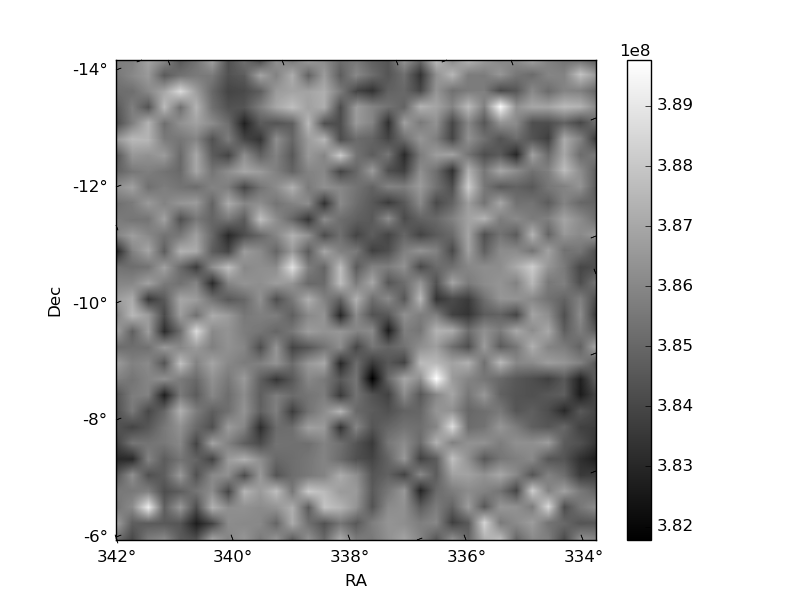
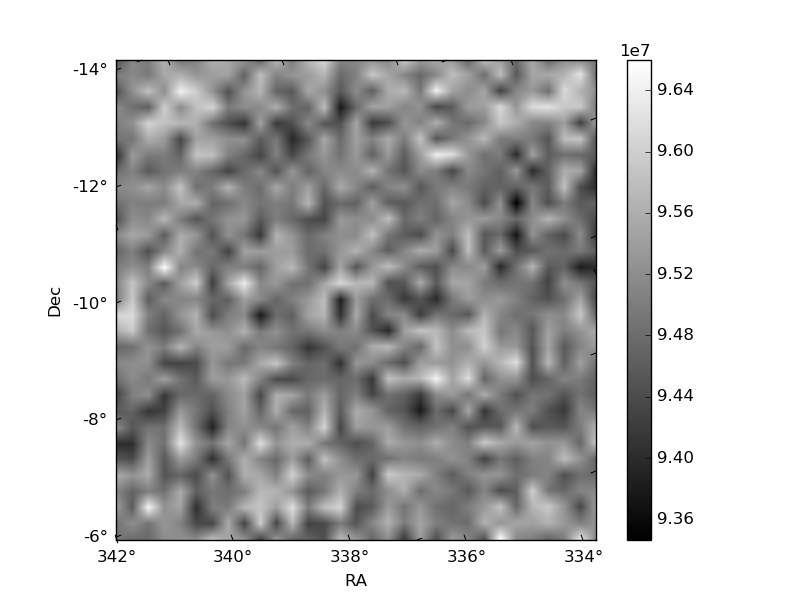
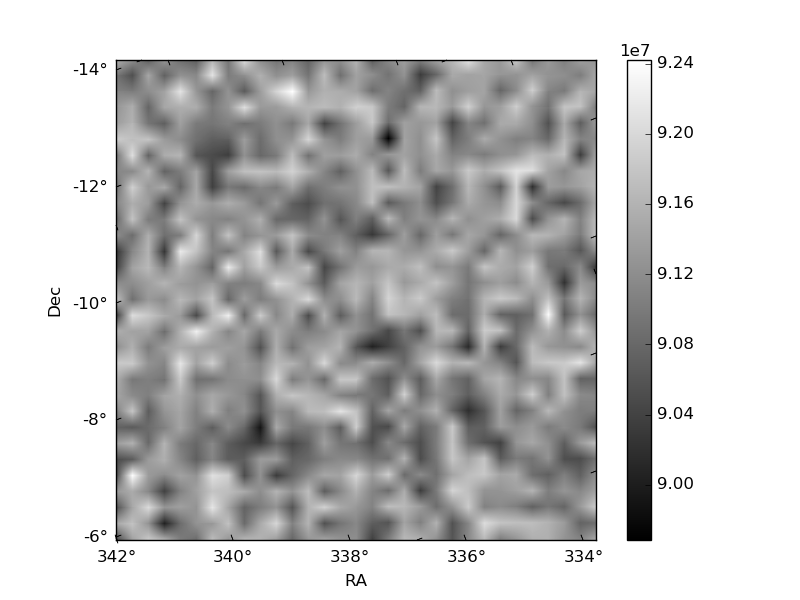
Histogram calculated using DETX and DETY for each event in the final _common_clean file
| Quadrant A | 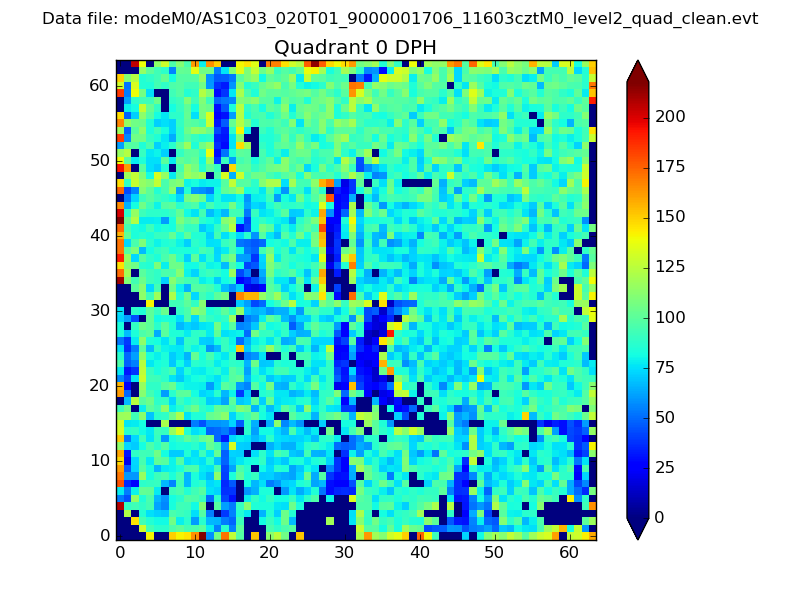 |
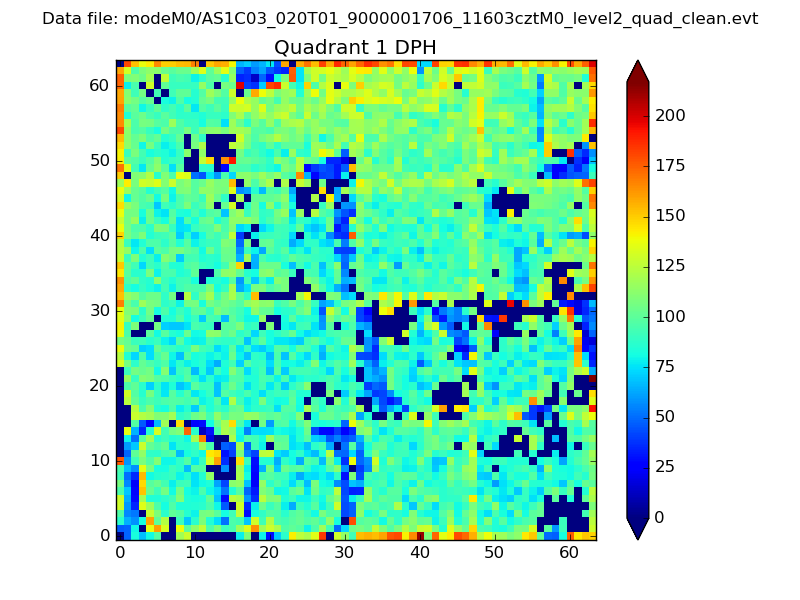 |
Quadrant B |
|---|---|---|---|
| Quadrant D | 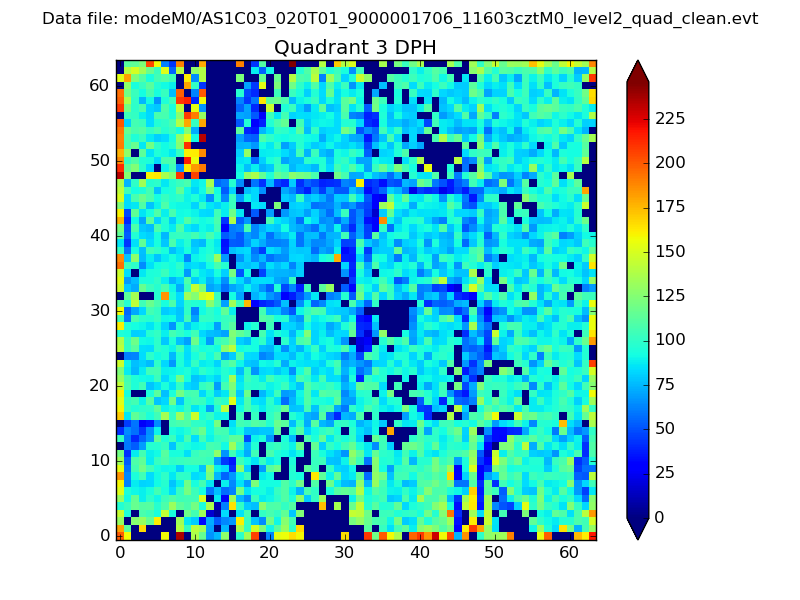 |
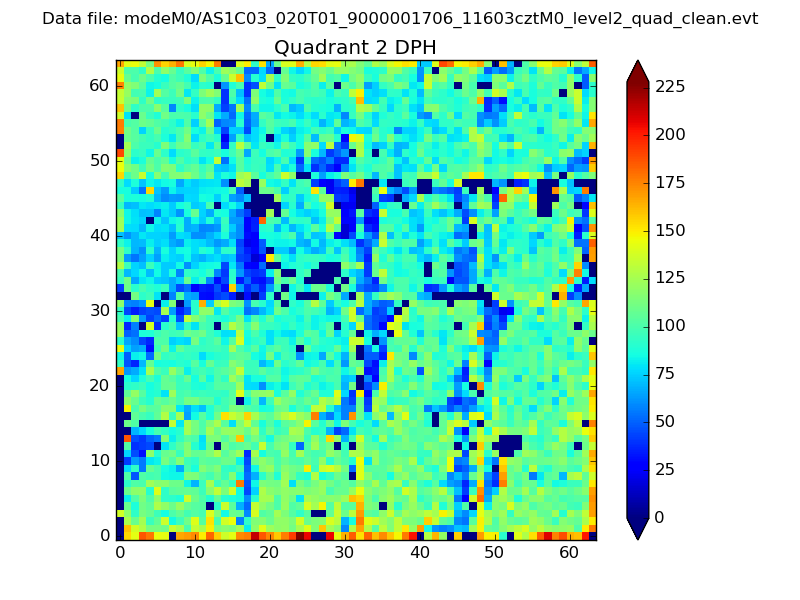 |
Quadrant C |
| Plot type | Count rate plots | Images |
|---|---|---|
| Comparison with Poisson distribution Blue bars denote a histogram of data divided into 1 sec bins. Red curve is a Poisson curve with rate = median count rate of data. |
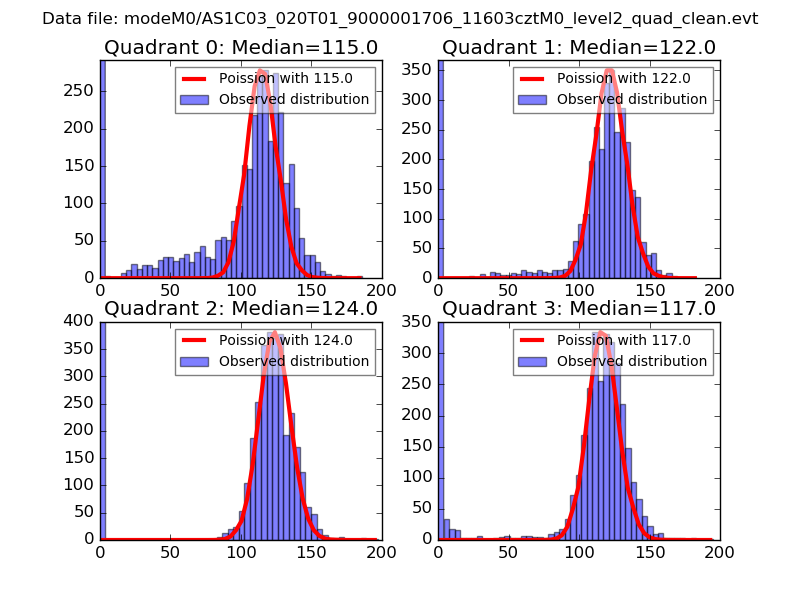 |
 |
| Quadrant-wise count rates Data is divided into 100 sec bins |
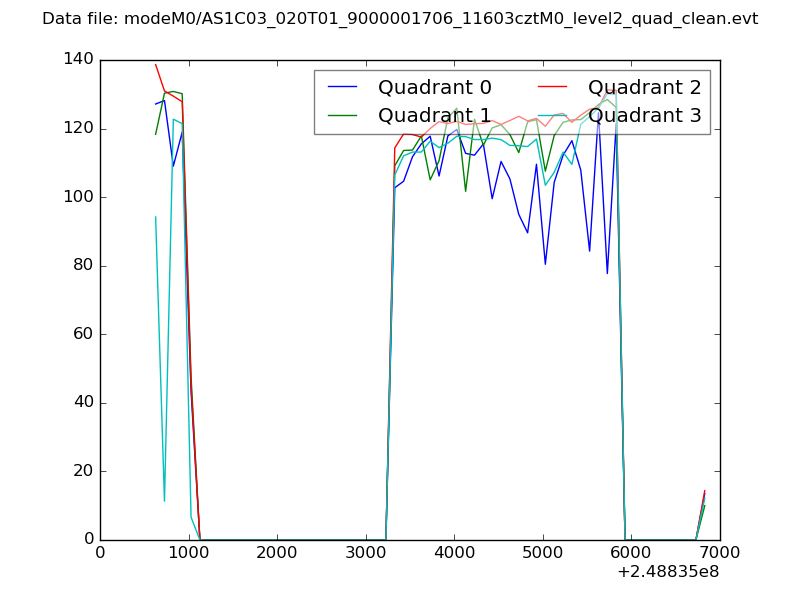 |
|
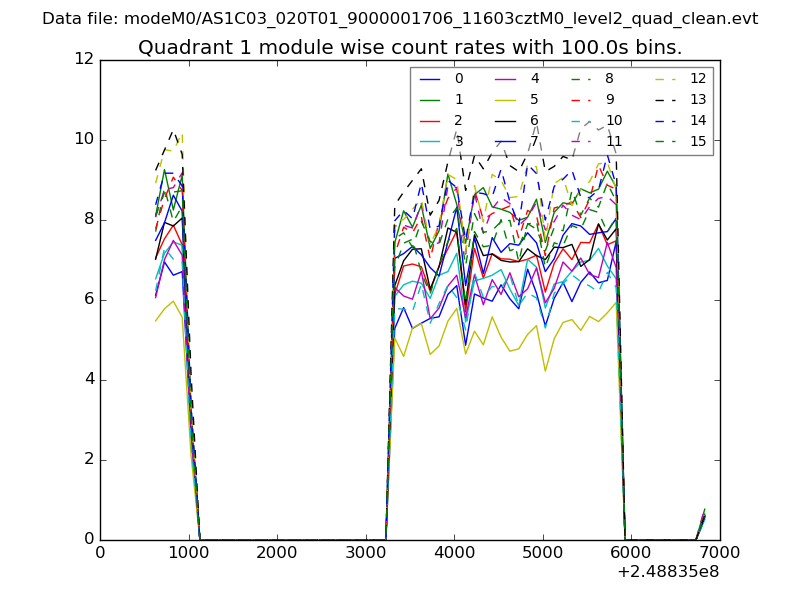
| Module-wise count rates for Quadrant A Data is divided into 100 sec bins |
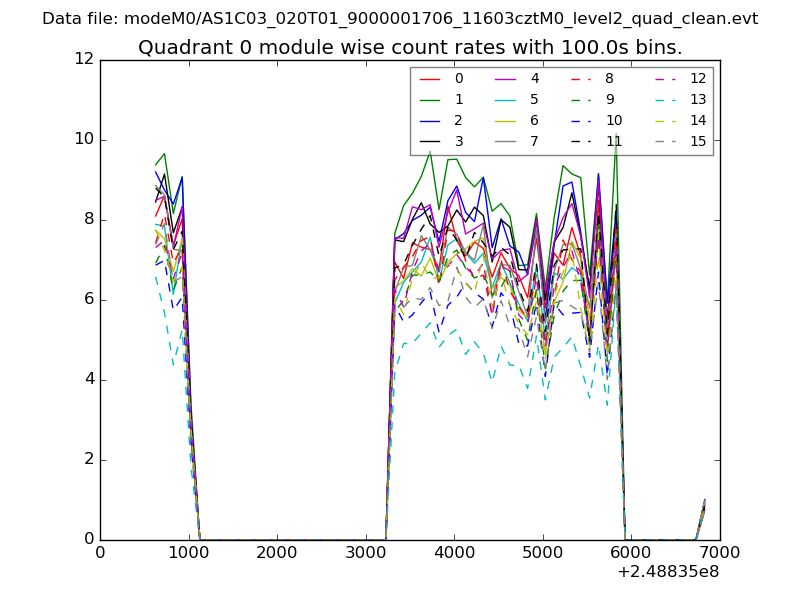 |
 |
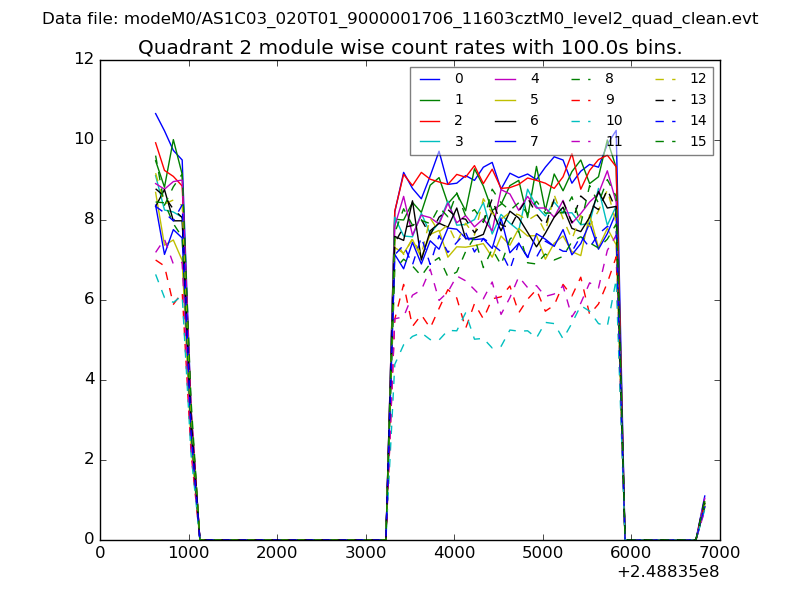
| Module-wise count rates for Quadrant B Data is divided into 100 sec bins |
 |
 |
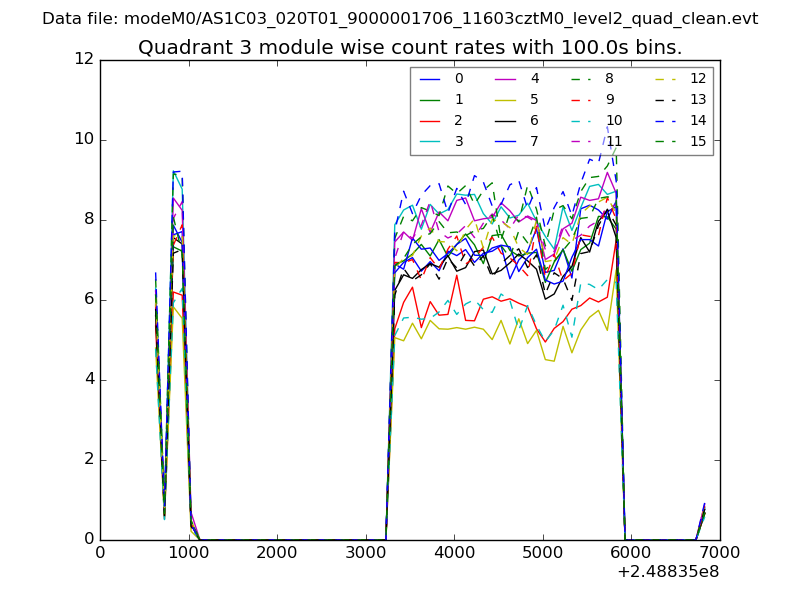
| Module-wise count rates for Quadrant C Data is divided into 100 sec bins |
 |
 |
| Module-wise count rates for Quadrant D Data is divided into 100 sec bins |
 |
 |
| Parameter | Plot |
|---|---|
| CZT HV Monitor | 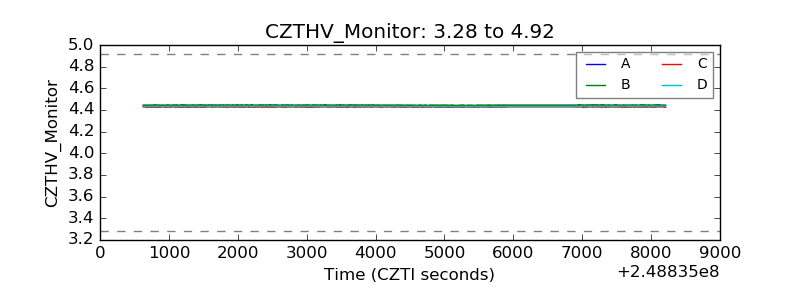 |
| D_VDD | 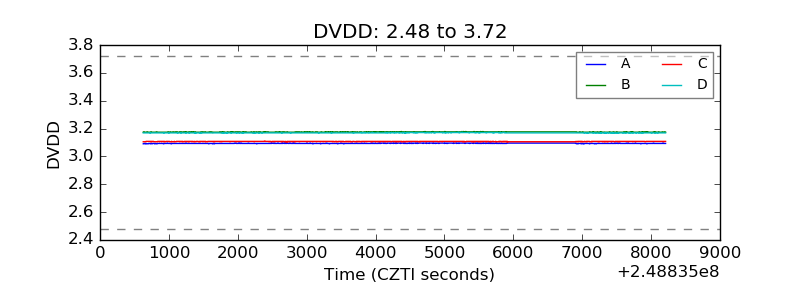 |
| Temperature 1 | 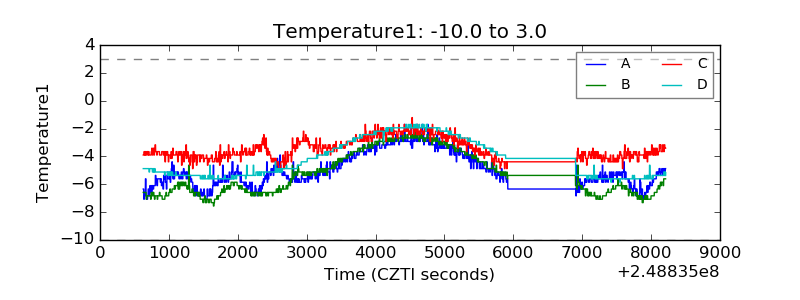 |
| Veto HV Monitor | 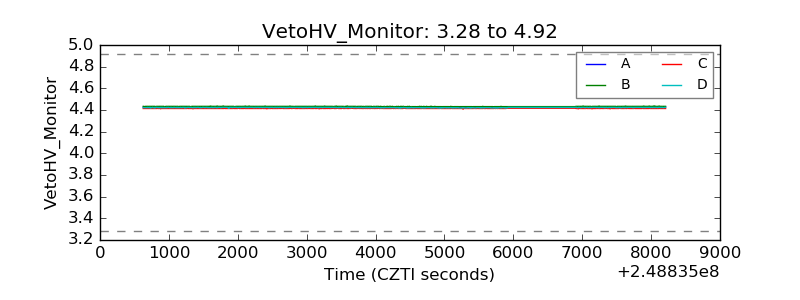 |
| Veto LLD | 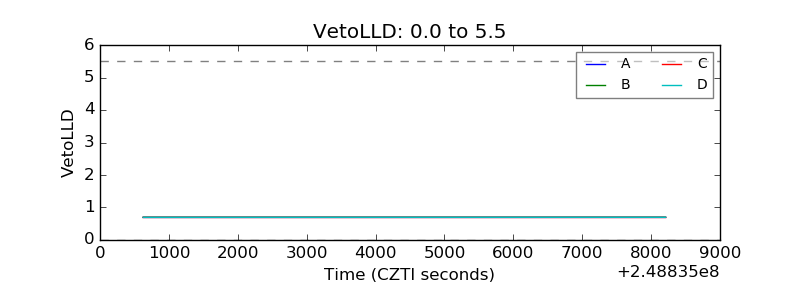 |
| Alpha Counter | 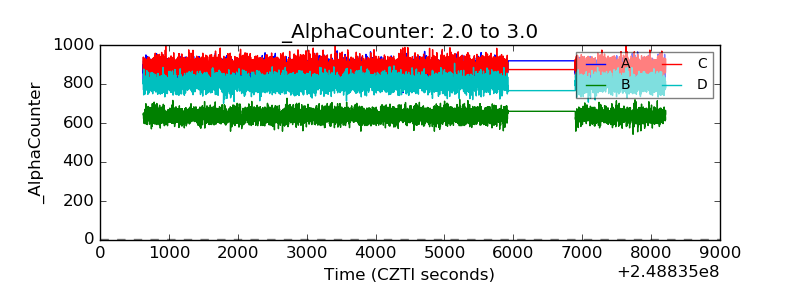 |
| _CPM_Rate | 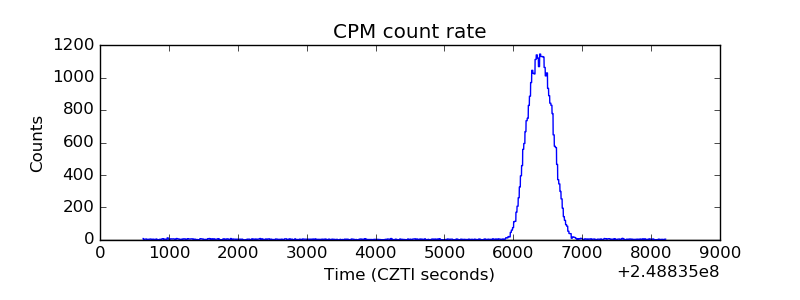 |
| CZT Counter | 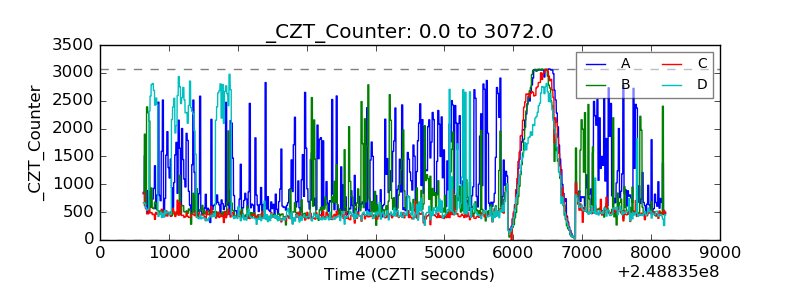 |
| +2.5 Volts monitor |  |
| +5 Volts monitor |  |
| _ROLL_ROT | 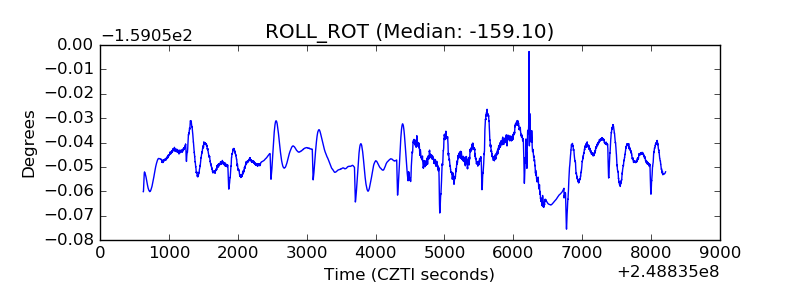 |
| _Roll_DEC | 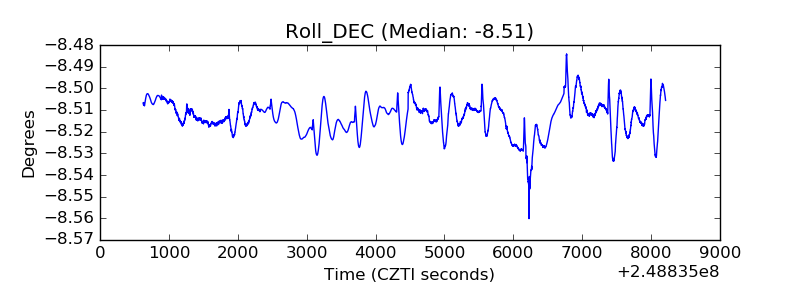 |
| _Roll_RA | 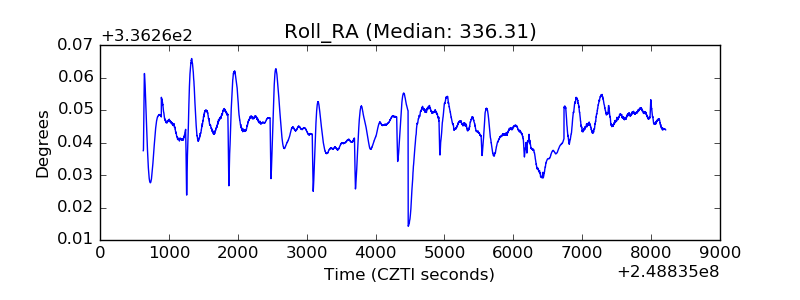 |
| Veto Counter | 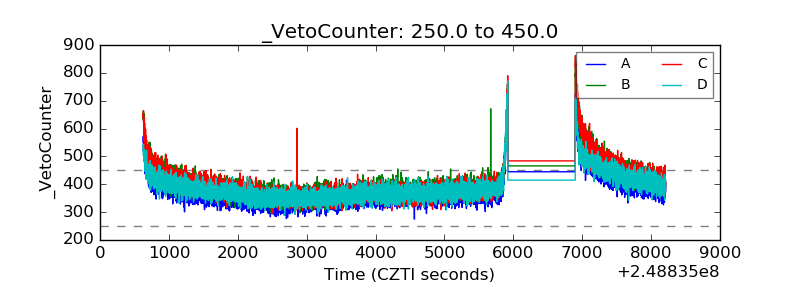 |