| Param | Original file | Final file |
|---|---|---|
| Filename | modeM0/AS1C03_020T01_9000001706_11607cztM0_level2.evt | modeM0/AS1C03_020T01_9000001706_11607cztM0_level2_quad_clean.evt |
| Size (bytes) | 607,527,360 | 80,182,080 |
| Size | 579.4 MB | 76.5 MB |
| Events in quadrant A | 6,374,535 | 467,789 |
| Events in quadrant B | 4,684,525 | 509,936 |
| Events in quadrant C | 3,184,829 | 515,391 |
| Events in quadrant D | 3,727,185 | 493,323 |
| Mode M0 | |||
|---|---|---|---|
| Quadrant | BADHDUFLAG | Total packets | Discarded packets |
| A | 0 | 23422 | 3 |
| B | 0 | 18071 | 2 |
| C | 0 | 13432 | 2 |
| D | 0 | 15016 | 2 |
| Mode M9 | |||
|---|---|---|---|
| Quadrant | BADHDUFLAG | Total packets | Discarded packets |
| A | 0 | 14 | 0 |
| B | 0 | 14 | 0 |
| C | 0 | 14 | 0 |
| D | 0 | 15 | 0 |
| Mode SS | |||
|---|---|---|---|
| Quadrant | BADHDUFLAG | Total packets | Discarded packets |
| A | 0 | 130 | 0 |
| B | 0 | 130 | 0 |
| C | 0 | 130 | 0 |
| D | 0 | 130 | 0 |
| Quadrant | Total seconds | Saturated seconds | Saturation percentage |
|---|---|---|---|
| A | 6314 | 1064 | 16.851441% |
| B | 6314 | 409 | 6.477669% |
| C | 6314 | 63 | 0.997783% |
| D | 6314 | 122 | 1.932214% |
Noise dominated data is calculated using 1-second bins in cleaned event files. If a bin has >2000 counts, and if more than 50% of those come from <1% of pixels, then it is considered to be noise-dominated and hence unusable.
| Quadrant | # 1 sec bins | Bins with >0 counts | Bins with >2000 counts | High rate bins dominated by noise | Noise dominated (total time) | Noise dominated (detector-on time) | Marked lightcurve |
|---|---|---|---|---|---|---|---|
| A | 7550 | 6316 | 615 | 615 | 8.15% | 9.74% | 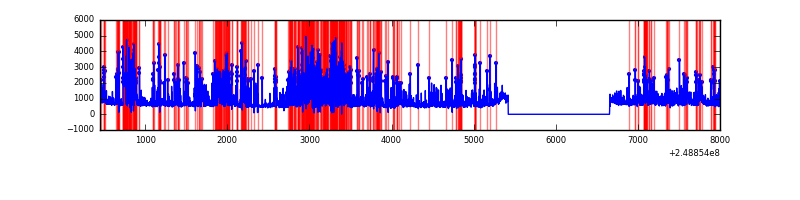 |
| B | 7550 | 6316 | 189 | 189 | 2.50% | 2.99% | 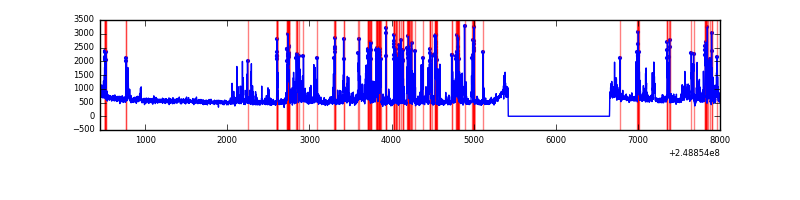 |
| C | 7550 | 6316 | 0 | 0 | 0.00% | 0.00% | 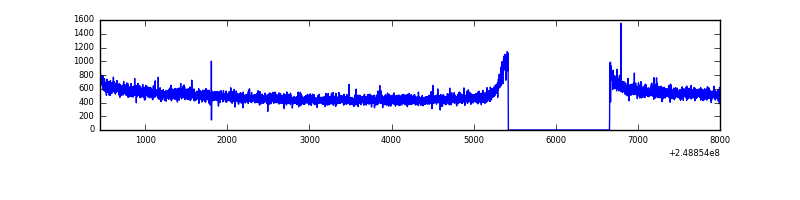 |
| D | 7550 | 6316 | 34 | 34 | 0.45% | 0.54% | 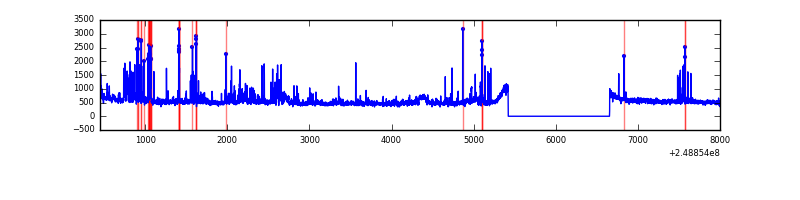 |
Top three noisy pixels from each quadrant. If the there are fewer than three noisy pixels in the level2.evt file, extra rows are filled as -1
| Pixel properties | Quadrant properties | ||||||
|---|---|---|---|---|---|---|---|
| Quadrant | DetID | PixID | Counts | Sigma | Mean | Median | Sigma |
| A | 8 | 5 | 2927947 | 18395.93 | 789 | 774 | 159.1 |
| A | 1 | 162 | 139550 | 872.14 | 789 | 774 | 159.1 |
| A | 1 | 178 | 81263 | 505.84 | 789 | 774 | 159.1 |
| B | 4 | 239 | 1243808 | 7898.72 | 837 | 821 | 157.4 |
| B | 15 | 204 | 42840 | 267.02 | 837 | 821 | 157.4 |
| B | 4 | 81 | 42443 | 264.49 | 837 | 821 | 157.4 |
| C | 13 | 61 | 5949 | 27.35 | 816 | 822 | 187.4 |
| C | 12 | 4 | 2897 | 11.07 | 816 | 822 | 187.4 |
| C | 3 | 202 | 1966 | 6.1 | 816 | 822 | 187.4 |
| D | 1 | 52 | 447811 | 2311.3 | 814 | 794 | 193.4 |
| D | 13 | 104 | 82440 | 422.15 | 814 | 794 | 193.4 |
| D | 8 | 195 | 33055 | 166.8 | 814 | 794 | 193.4 |
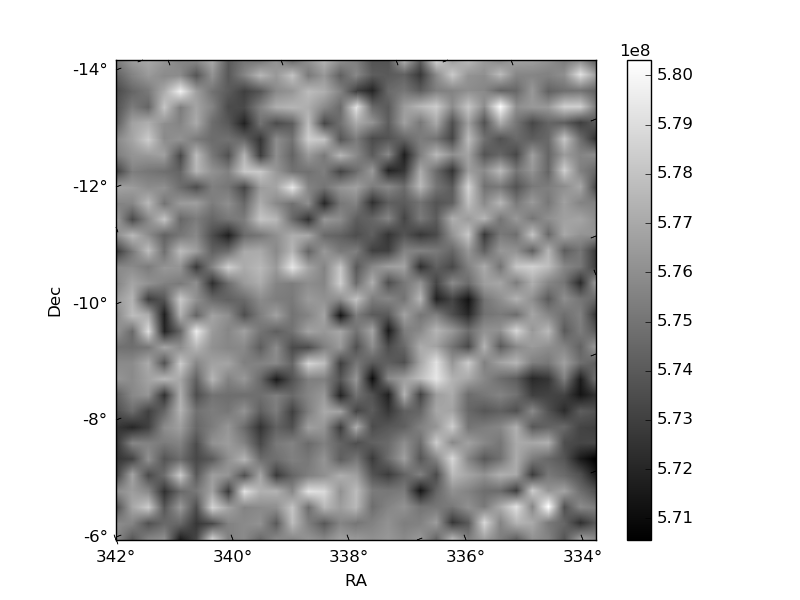
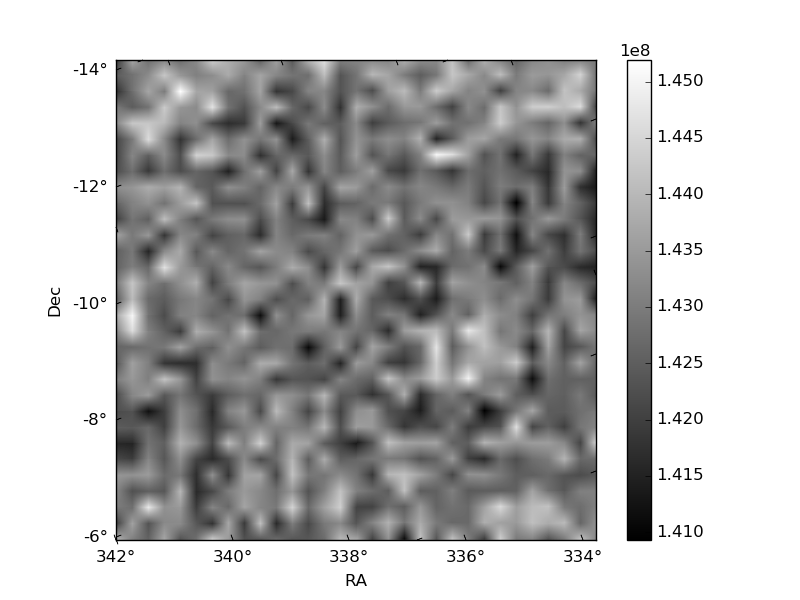
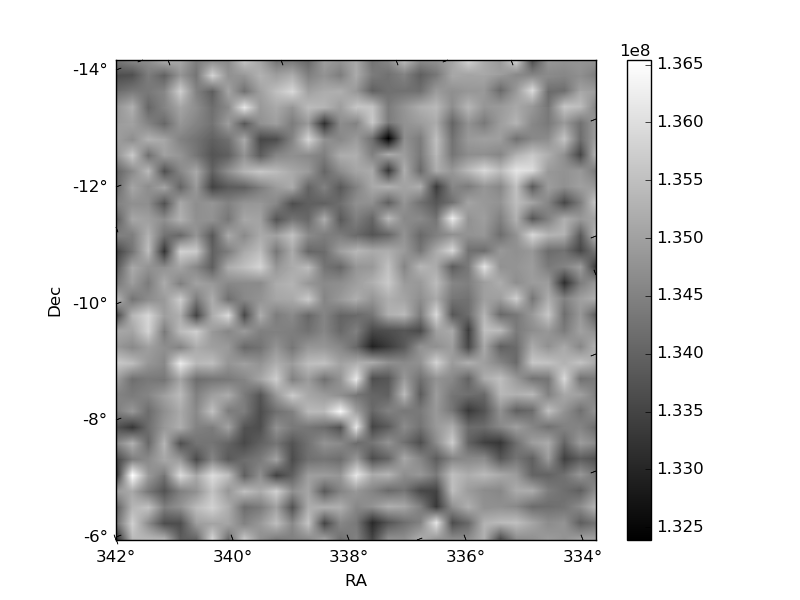
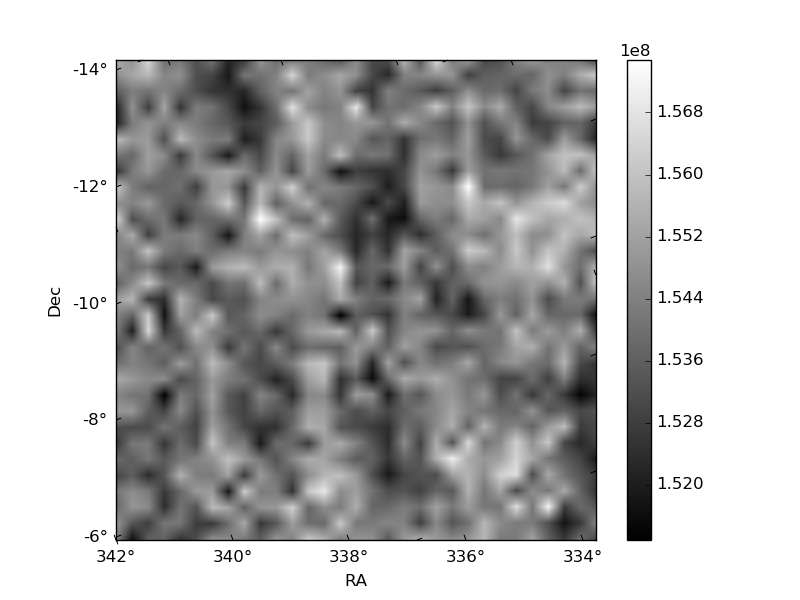
Histogram calculated using DETX and DETY for each event in the final _common_clean file
| Quadrant A | 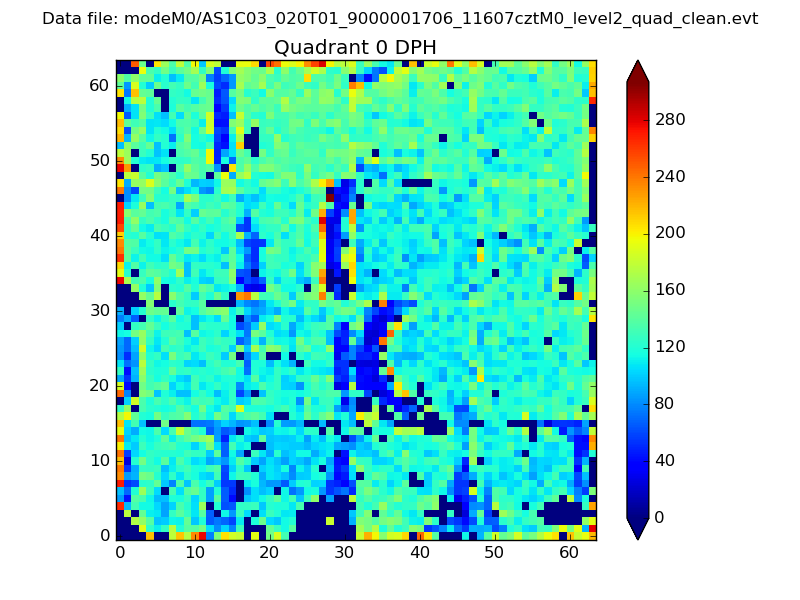 |
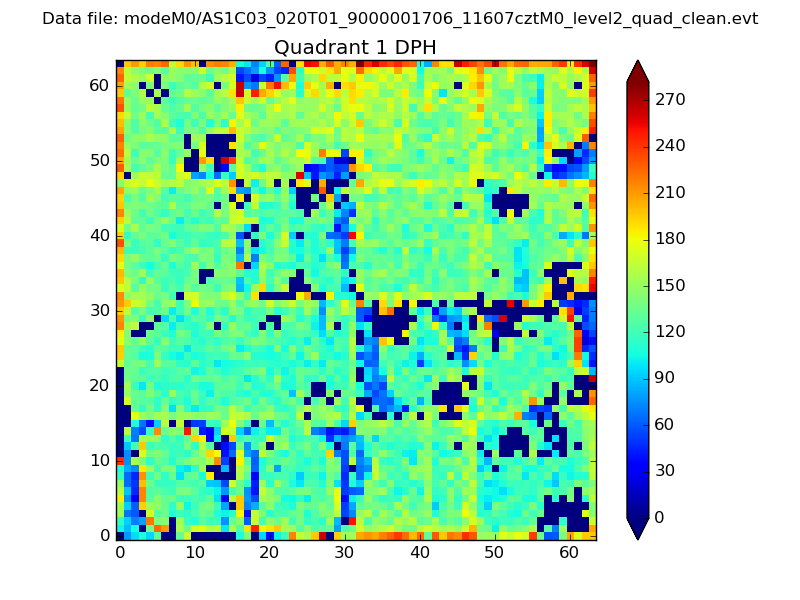 |
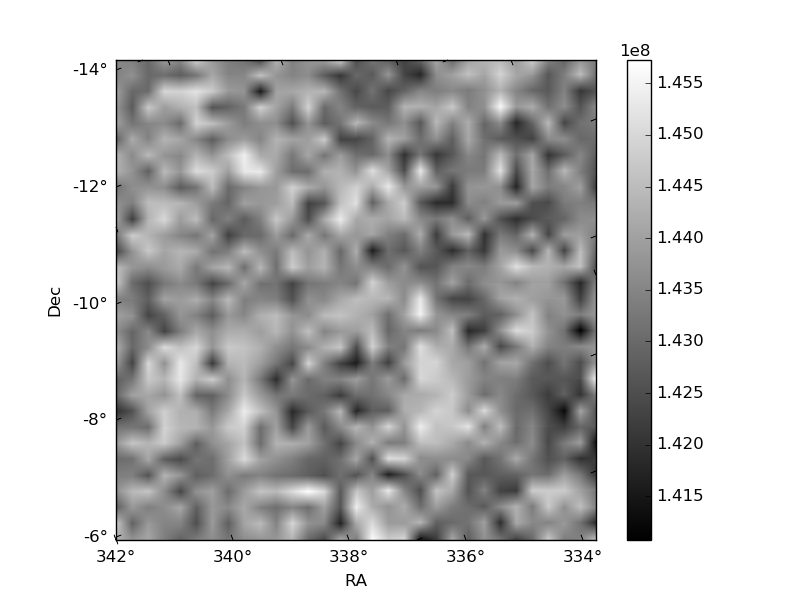
Quadrant B |
|---|---|---|---|
| Quadrant D | 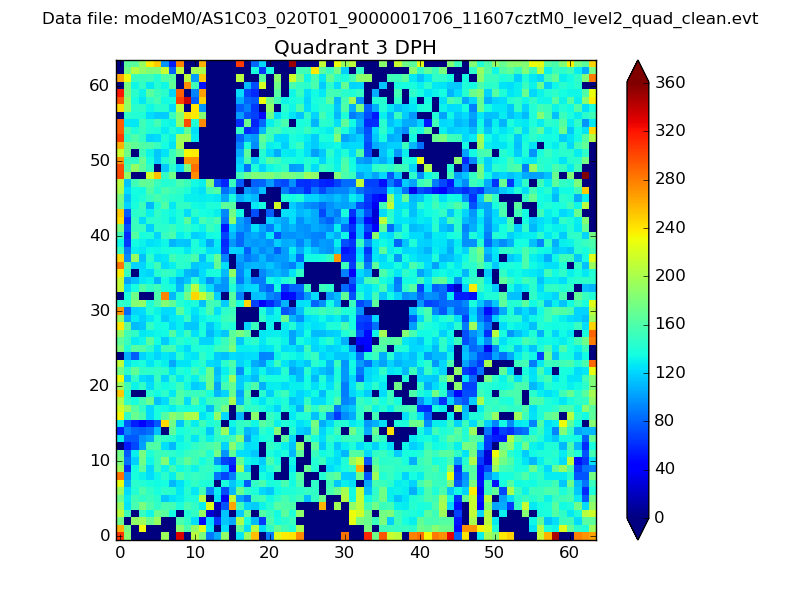 |
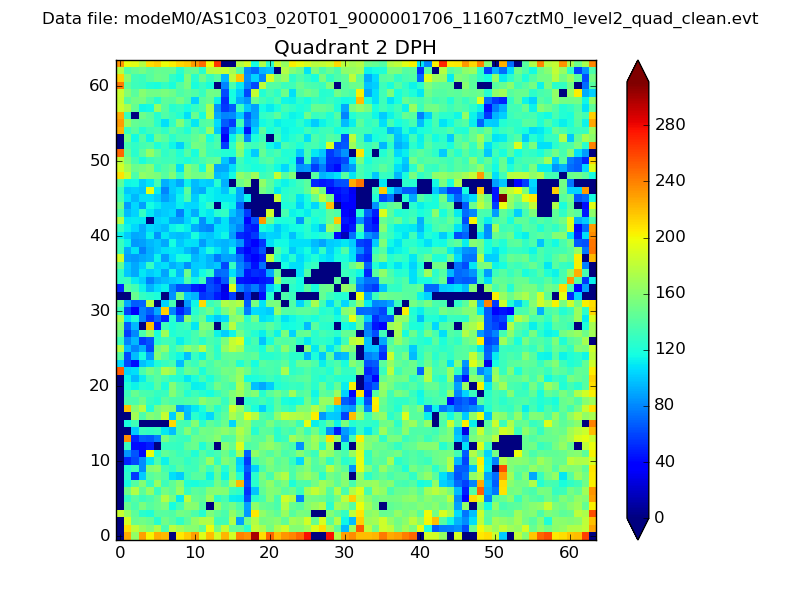 |
Quadrant C |
| Plot type | Count rate plots | Images |
|---|---|---|
| Comparison with Poisson distribution Blue bars denote a histogram of data divided into 1 sec bins. Red curve is a Poisson curve with rate = median count rate of data. |
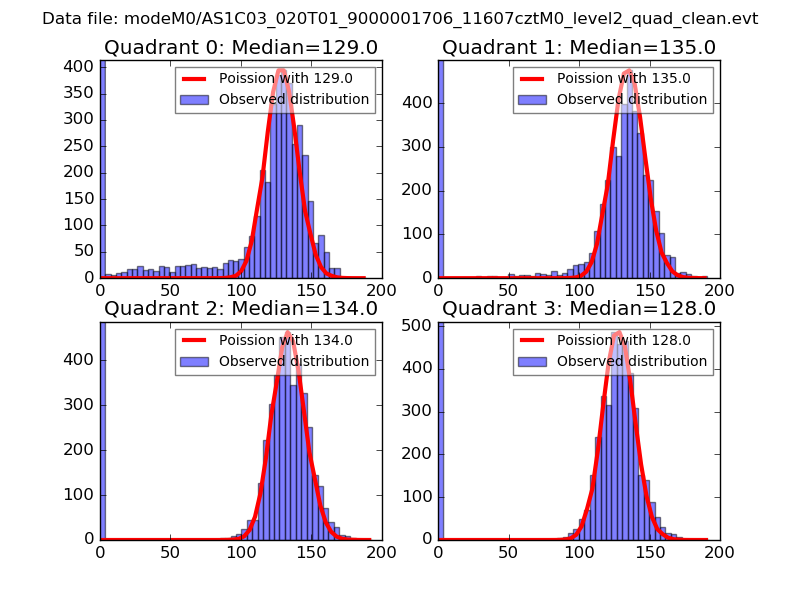 |
 |
| Quadrant-wise count rates Data is divided into 100 sec bins |
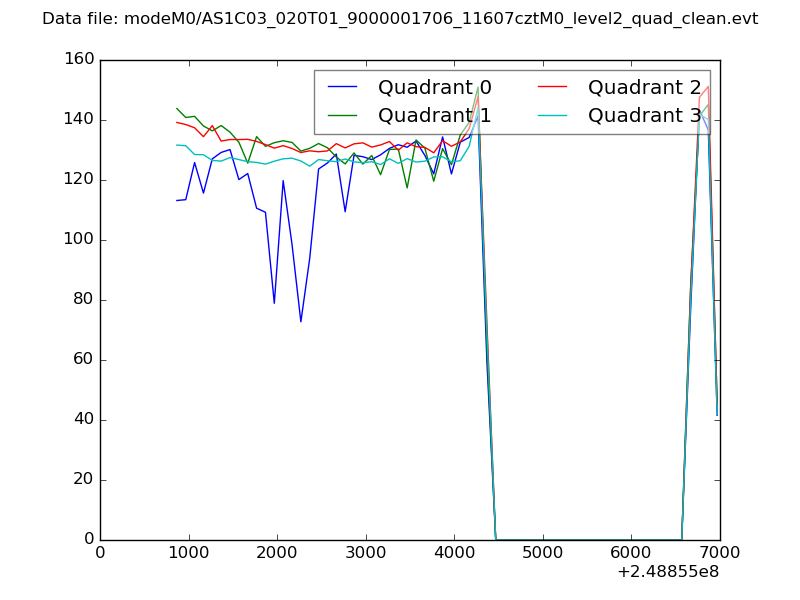 |
|
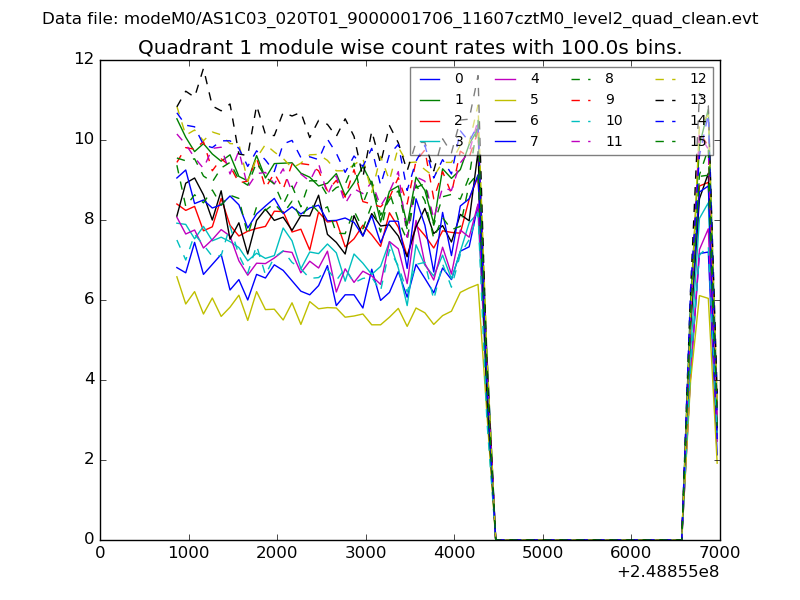
| Module-wise count rates for Quadrant A Data is divided into 100 sec bins |
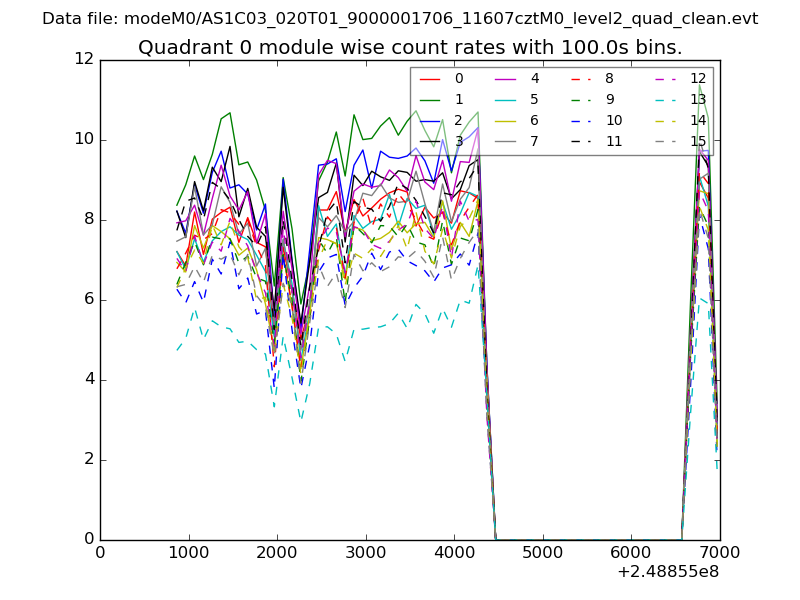 |
 |
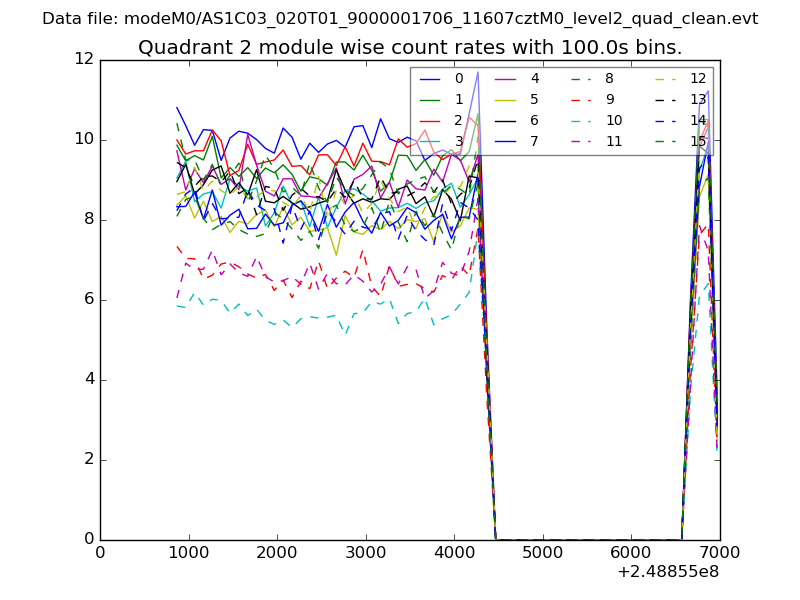
| Module-wise count rates for Quadrant B Data is divided into 100 sec bins |
 |
 |
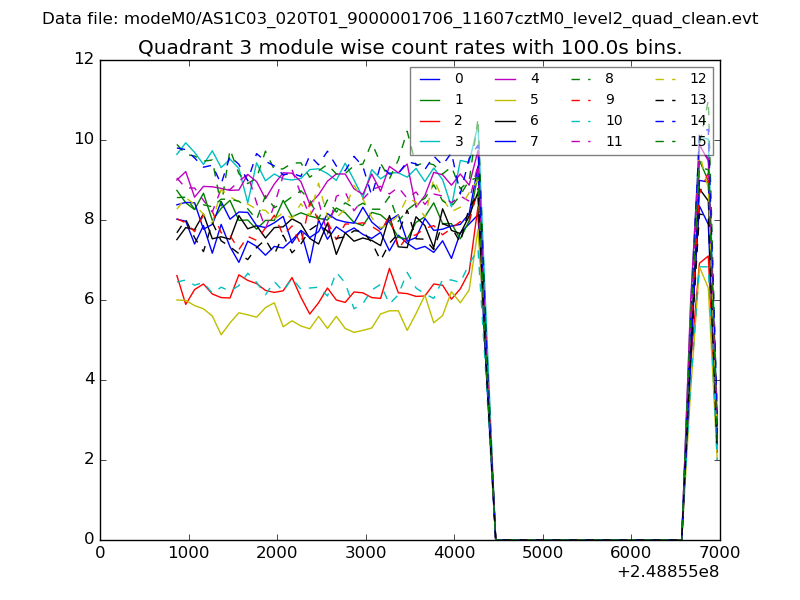
| Module-wise count rates for Quadrant C Data is divided into 100 sec bins |
 |
 |
| Module-wise count rates for Quadrant D Data is divided into 100 sec bins |
 |
 |
| Parameter | Plot |
|---|---|
| CZT HV Monitor | 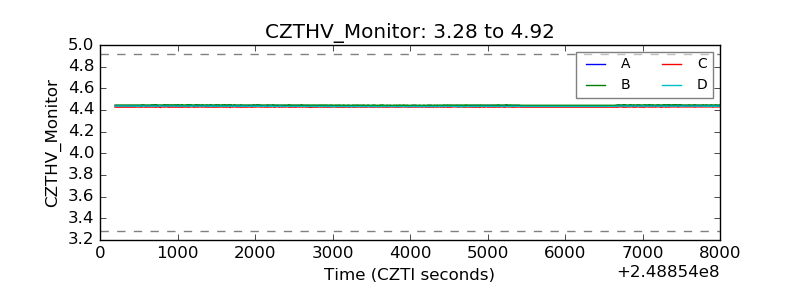 |
| D_VDD | 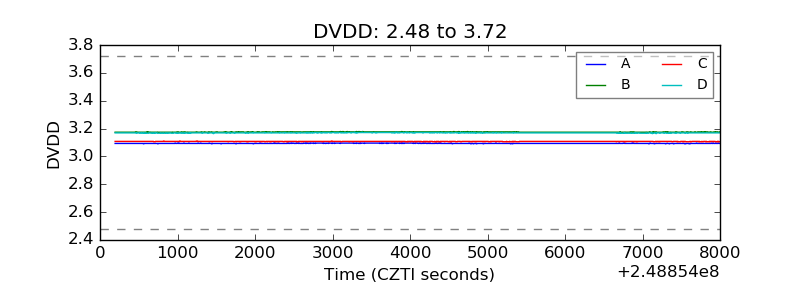 |
| Temperature 1 | 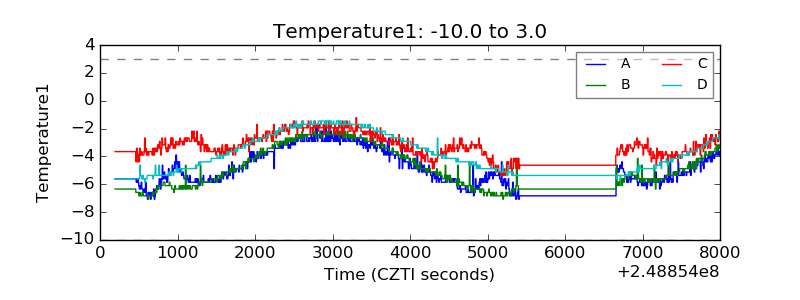 |
| Veto HV Monitor | 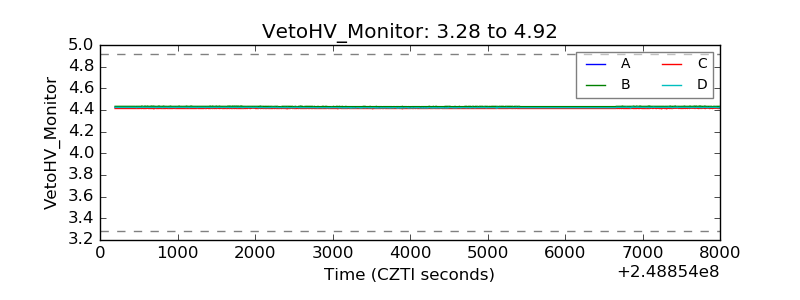 |
| Veto LLD | 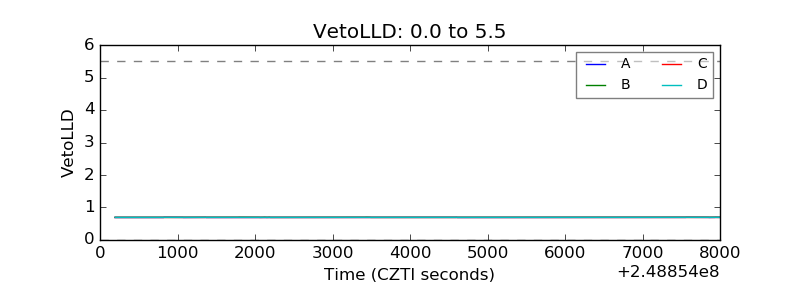 |
| Alpha Counter | 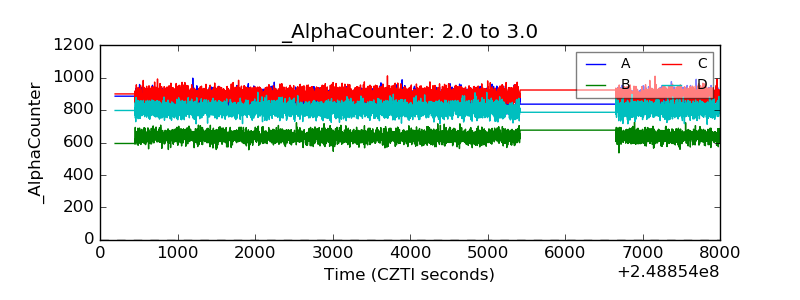 |
| _CPM_Rate | 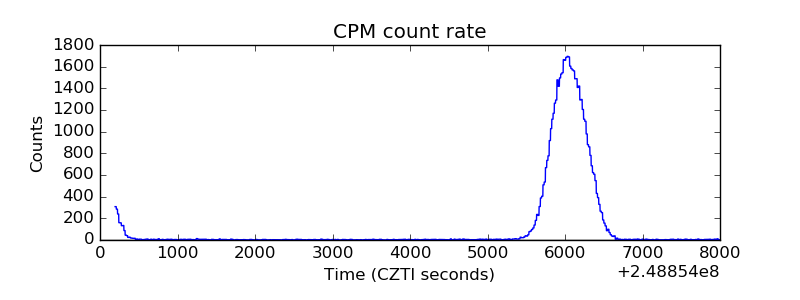 |
| CZT Counter | 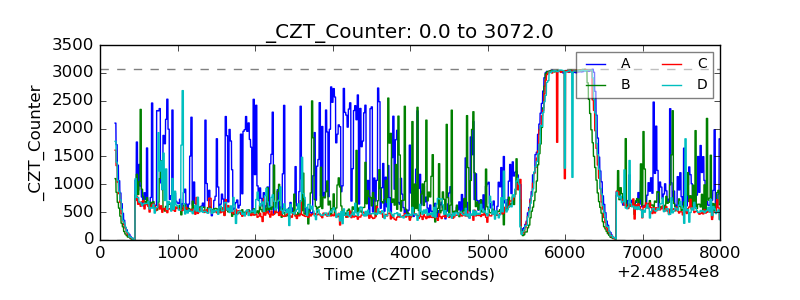 |
| +2.5 Volts monitor |  |
| +5 Volts monitor | 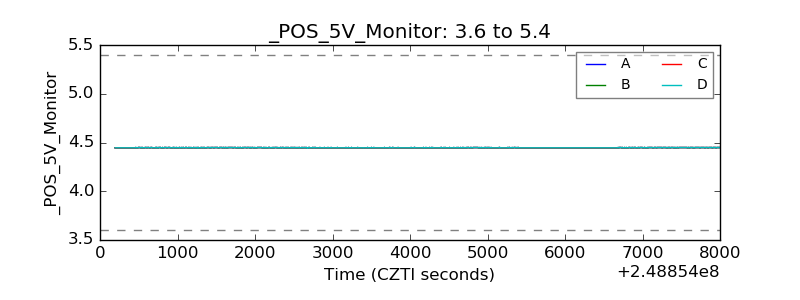 |
| _ROLL_ROT | 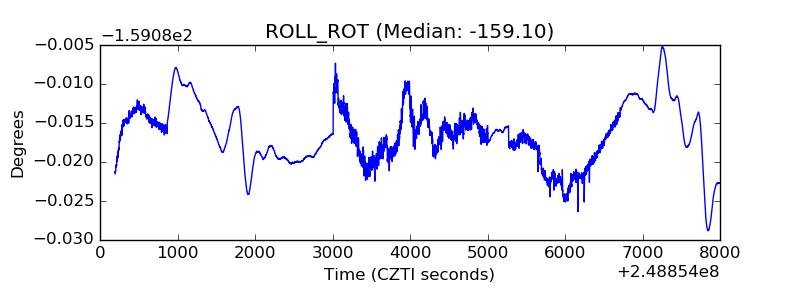 |
| _Roll_DEC | 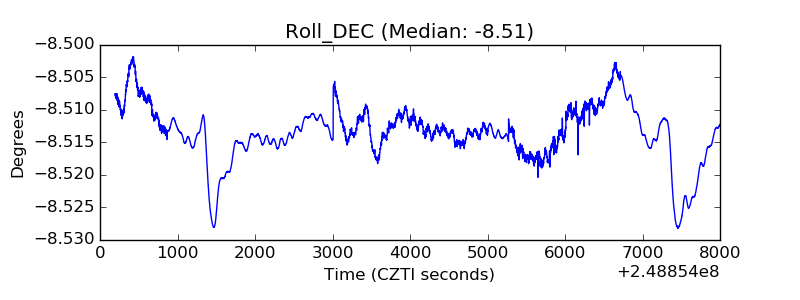 |
| _Roll_RA | 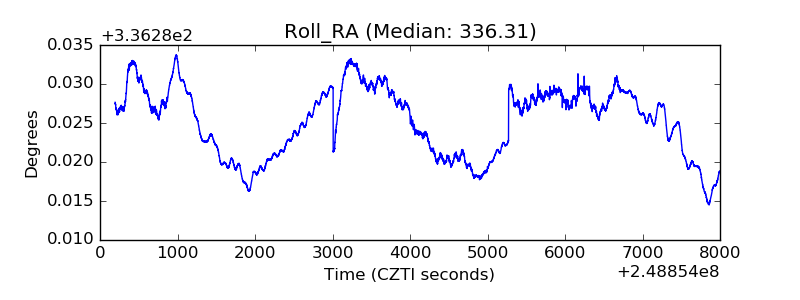 |
| Veto Counter | 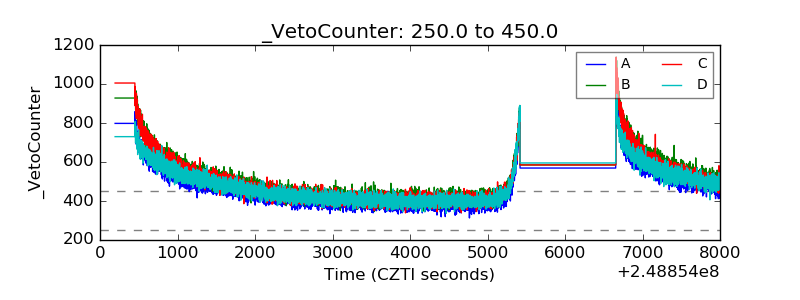 |