| Param | Original file | Final file |
|---|---|---|
| Filename | modeM0/AS1C03_020T01_9000001706_11608cztM0_level2.evt | modeM0/AS1C03_020T01_9000001706_11608cztM0_level2_quad_clean.evt |
| Size (bytes) | 592,862,400 | 89,228,160 |
| Size | 565.4 MB | 85.1 MB |
| Events in quadrant A | 5,909,437 | 557,030 |
| Events in quadrant B | 4,762,280 | 576,704 |
| Events in quadrant C | 3,172,934 | 578,665 |
| Events in quadrant D | 3,683,263 | 549,419 |
| Mode M0 | |||
|---|---|---|---|
| Quadrant | BADHDUFLAG | Total packets | Discarded packets |
| A | 0 | 22190 | 3 |
| B | 0 | 18390 | 2 |
| C | 0 | 13386 | 2 |
| D | 0 | 14811 | 2 |
| Mode M9 | |||
|---|---|---|---|
| Quadrant | BADHDUFLAG | Total packets | Discarded packets |
| A | 0 | 18 | 0 |
| B | 0 | 18 | 0 |
| C | 0 | 18 | 0 |
| D | 0 | 19 | 0 |
| Mode SS | |||
|---|---|---|---|
| Quadrant | BADHDUFLAG | Total packets | Discarded packets |
| A | 0 | 128 | 0 |
| B | 0 | 128 | 0 |
| C | 0 | 128 | 0 |
| D | 0 | 128 | 0 |
| Quadrant | Total seconds | Saturated seconds | Saturation percentage |
|---|---|---|---|
| A | 6306 | 692 | 10.973676% |
| B | 6306 | 442 | 7.009198% |
| C | 6306 | 84 | 1.332065% |
| D | 6306 | 205 | 3.250872% |
Noise dominated data is calculated using 1-second bins in cleaned event files. If a bin has >2000 counts, and if more than 50% of those come from <1% of pixels, then it is considered to be noise-dominated and hence unusable.
| Quadrant | # 1 sec bins | Bins with >0 counts | Bins with >2000 counts | High rate bins dominated by noise | Noise dominated (total time) | Noise dominated (detector-on time) | Marked lightcurve |
|---|---|---|---|---|---|---|---|
| A | 7572 | 6308 | 350 | 350 | 4.62% | 5.55% | 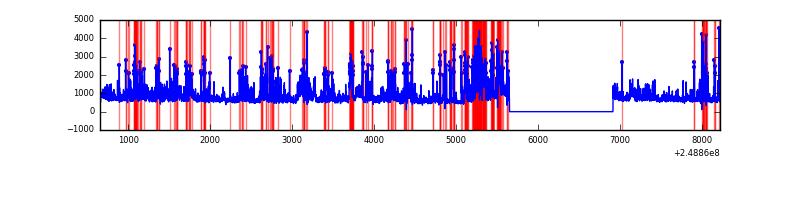 |
| B | 7572 | 6308 | 202 | 202 | 2.67% | 3.20% | 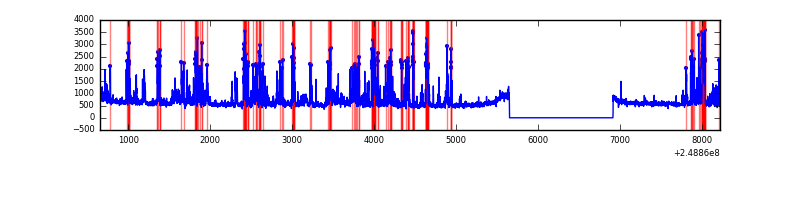 |
| C | 7572 | 6308 | 0 | 0 | 0.00% | 0.00% | 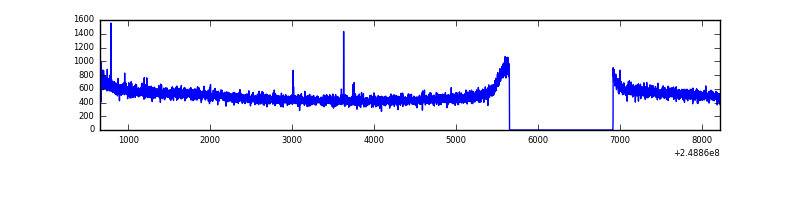 |
| D | 7572 | 6308 | 61 | 61 | 0.81% | 0.97% | 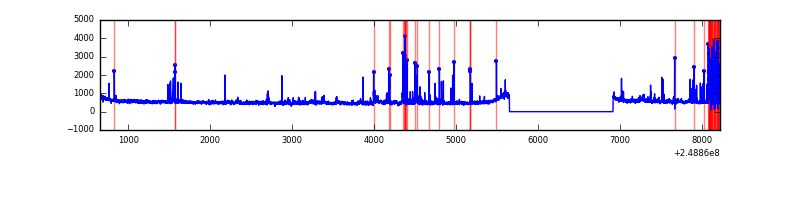 |
Top three noisy pixels from each quadrant. If the there are fewer than three noisy pixels in the level2.evt file, extra rows are filled as -1
| Pixel properties | Quadrant properties | ||||||
|---|---|---|---|---|---|---|---|
| Quadrant | DetID | PixID | Counts | Sigma | Mean | Median | Sigma |
| A | 8 | 5 | 2376860 | 14479.08 | 815 | 799 | 164.1 |
| A | 1 | 162 | 131281 | 795.12 | 815 | 799 | 164.1 |
| A | 1 | 178 | 75961 | 458.02 | 815 | 799 | 164.1 |
| B | 4 | 239 | 1193802 | 7600.54 | 833 | 817 | 157.0 |
| B | 3 | 64 | 67718 | 426.23 | 833 | 817 | 157.0 |
| B | 0 | 219 | 52441 | 328.9 | 833 | 817 | 157.0 |
| C | 13 | 61 | 5892 | 27.24 | 812 | 819 | 186.3 |
| C | 14 | 234 | 2930 | 11.33 | 812 | 819 | 186.3 |
| C | 12 | 4 | 2287 | 7.88 | 812 | 819 | 186.3 |
| D | 1 | 52 | 394030 | 2011.85 | 813 | 793 | 195.5 |
| D | 8 | 195 | 87904 | 445.67 | 813 | 793 | 195.5 |
| D | 13 | 104 | 48291 | 243.01 | 813 | 793 | 195.5 |
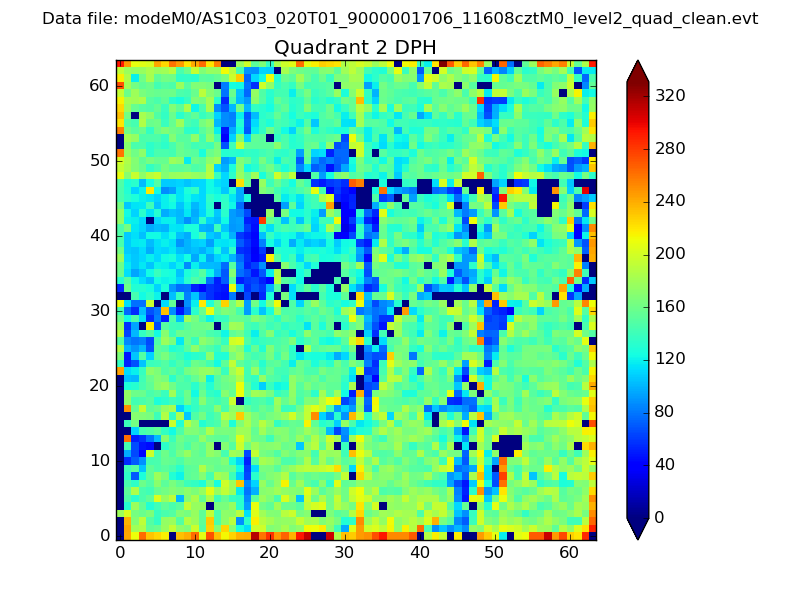
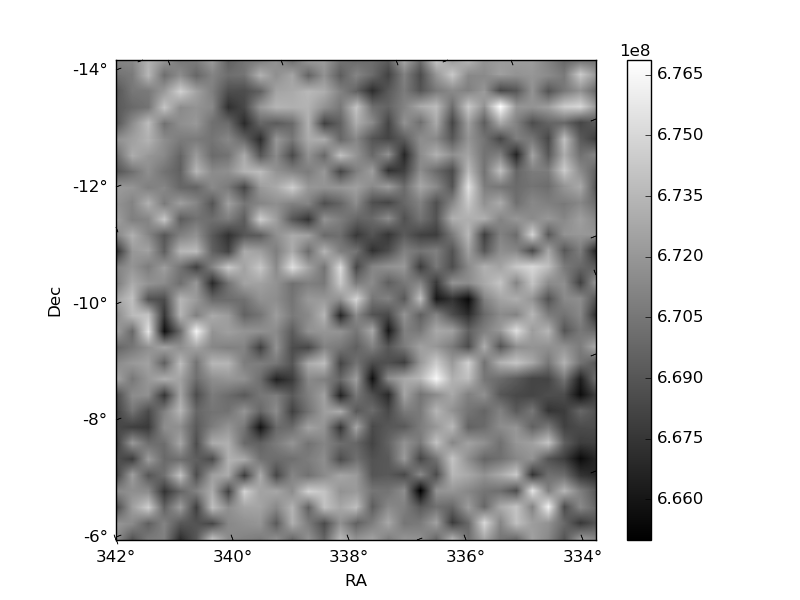
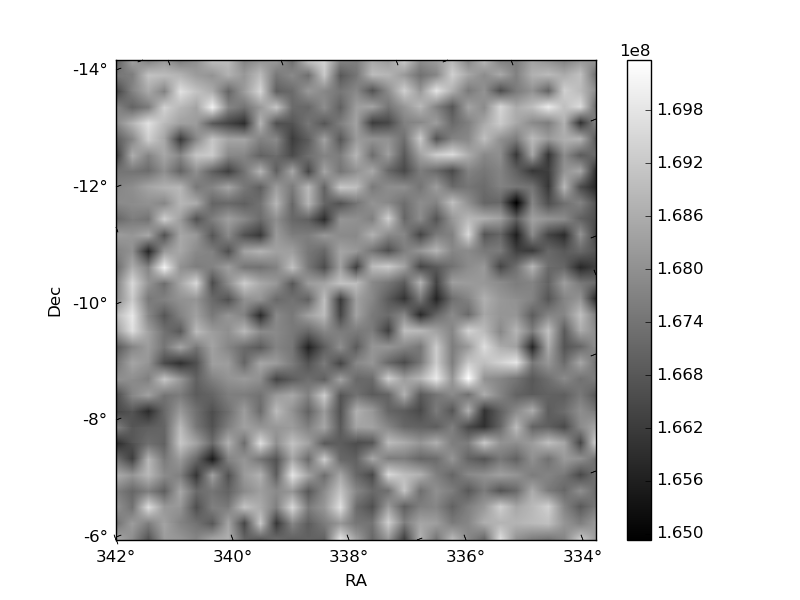
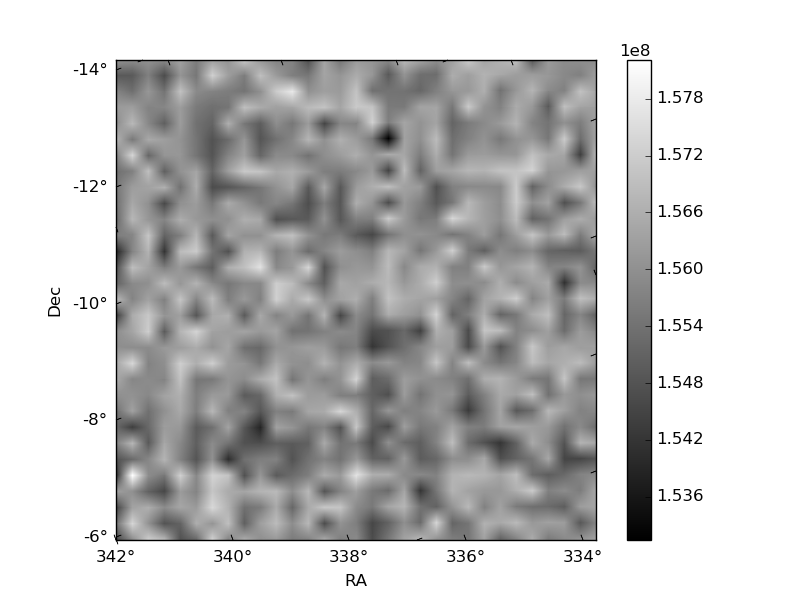
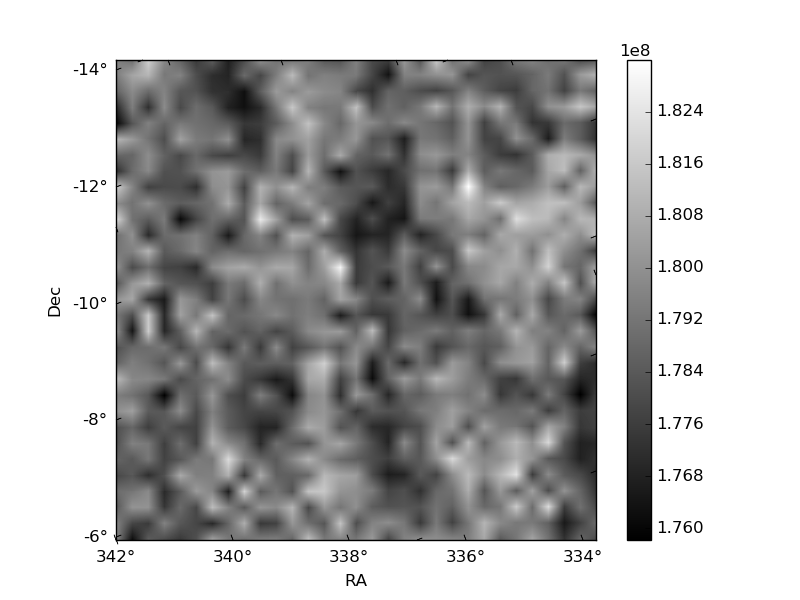
Histogram calculated using DETX and DETY for each event in the final _common_clean file
| Quadrant A | 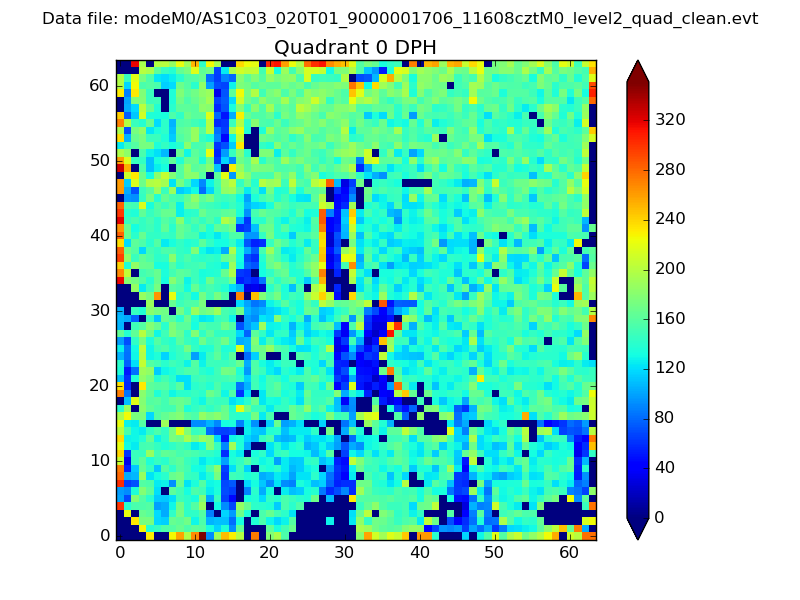 |
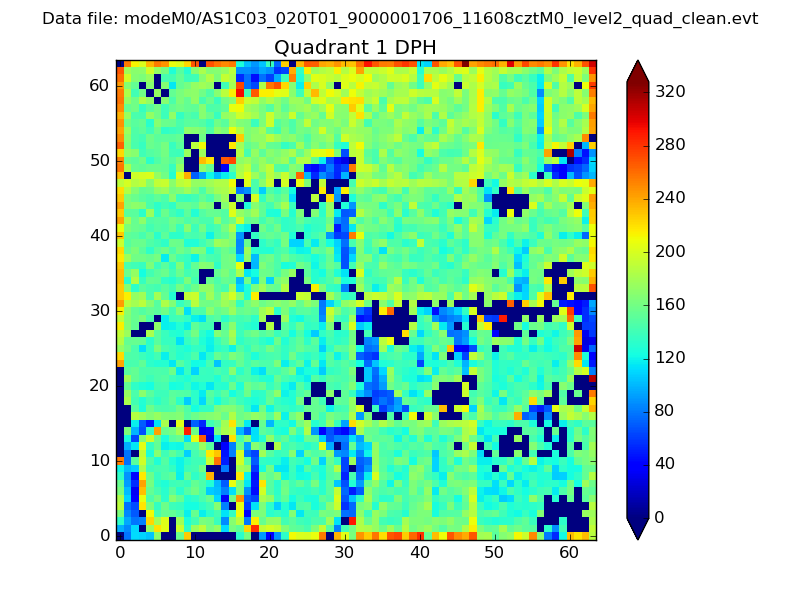 |
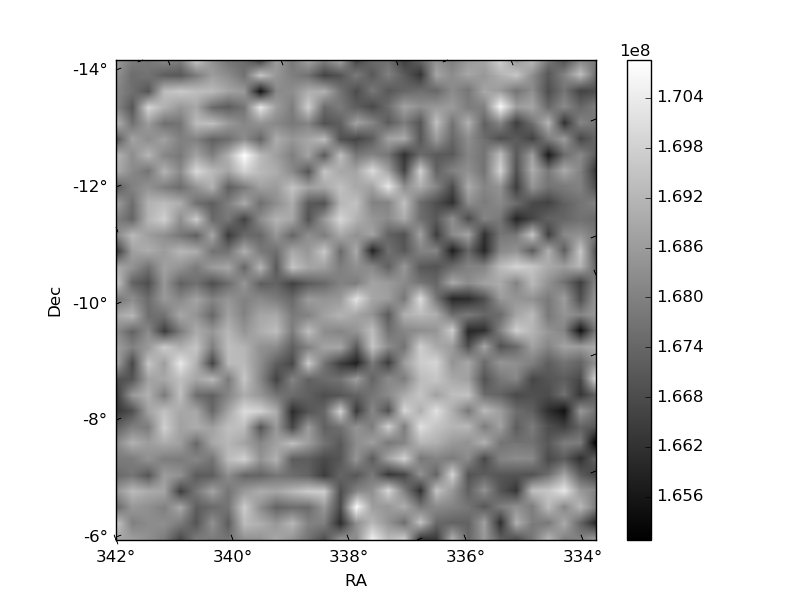
Quadrant B |
|---|---|---|---|
| Quadrant D | 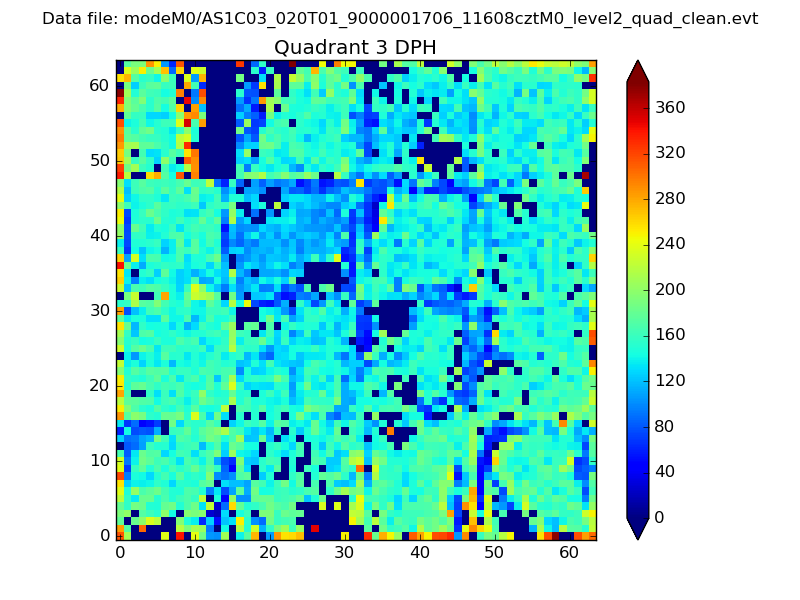 |
 |
Quadrant C |
| Plot type | Count rate plots | Images |
|---|---|---|
| Comparison with Poisson distribution Blue bars denote a histogram of data divided into 1 sec bins. Red curve is a Poisson curve with rate = median count rate of data. |
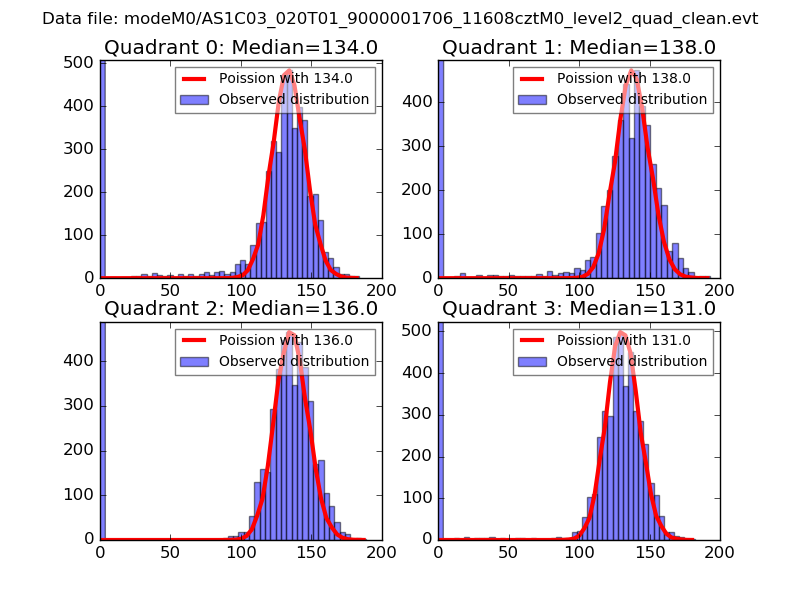 |
 |
| Quadrant-wise count rates Data is divided into 100 sec bins |
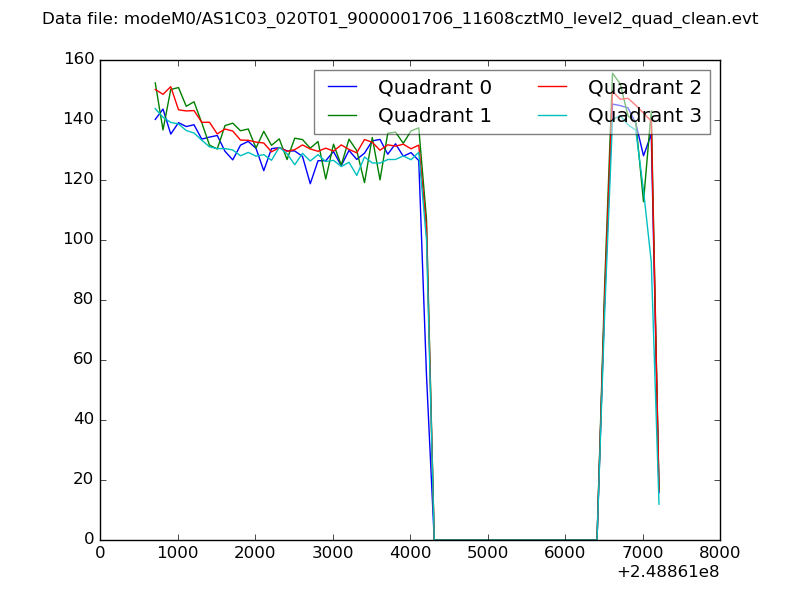 |
|
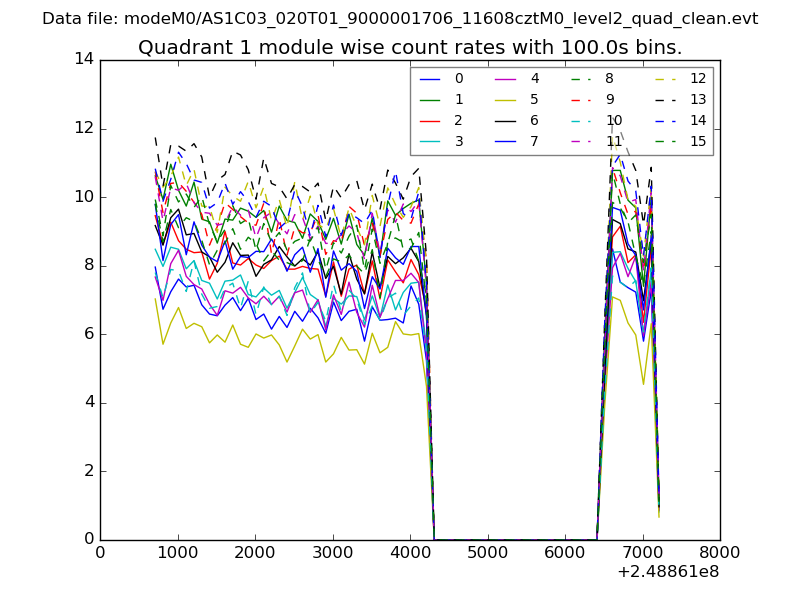
| Module-wise count rates for Quadrant A Data is divided into 100 sec bins |
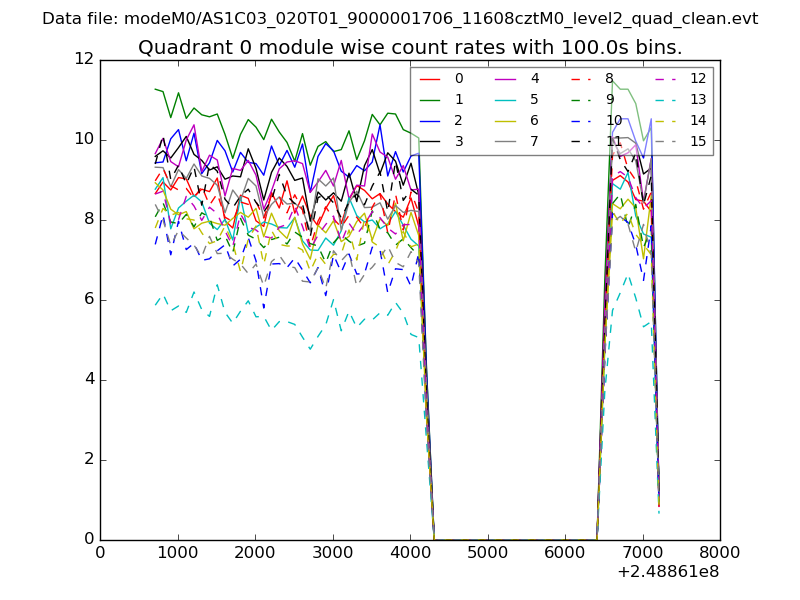 |
 |
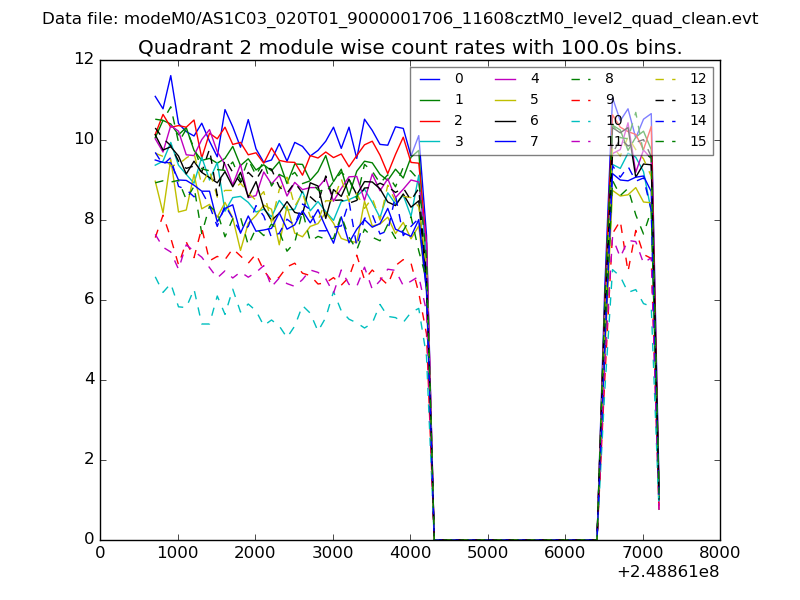
| Module-wise count rates for Quadrant B Data is divided into 100 sec bins |
 |
 |
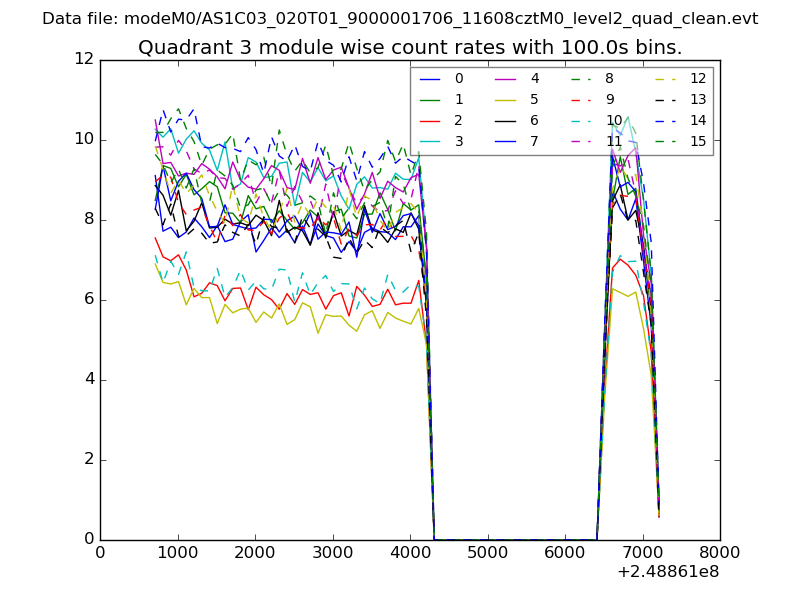
| Module-wise count rates for Quadrant C Data is divided into 100 sec bins |
 |
 |
| Module-wise count rates for Quadrant D Data is divided into 100 sec bins |
 |
 |
| Parameter | Plot |
|---|---|
| CZT HV Monitor | 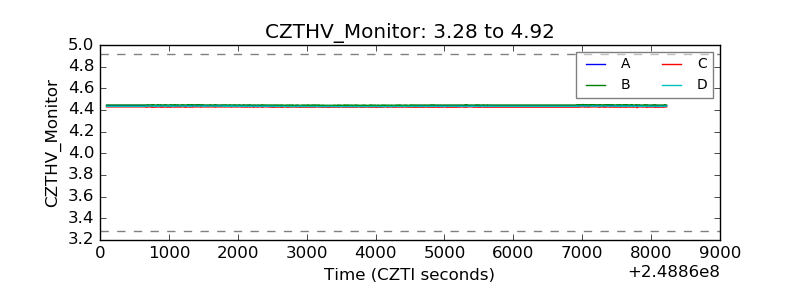 |
| D_VDD | 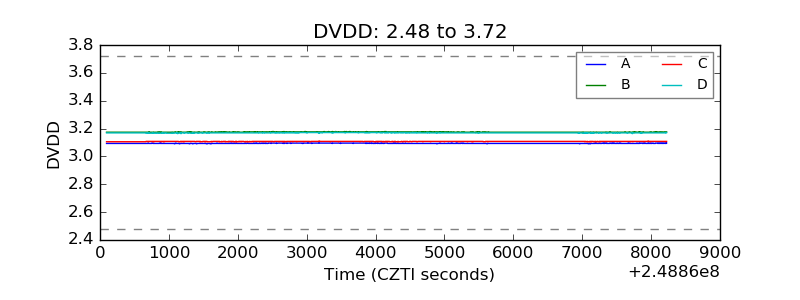 |
| Temperature 1 | 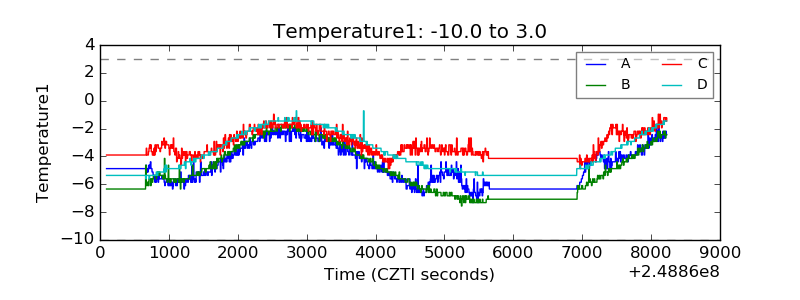 |
| Veto HV Monitor | 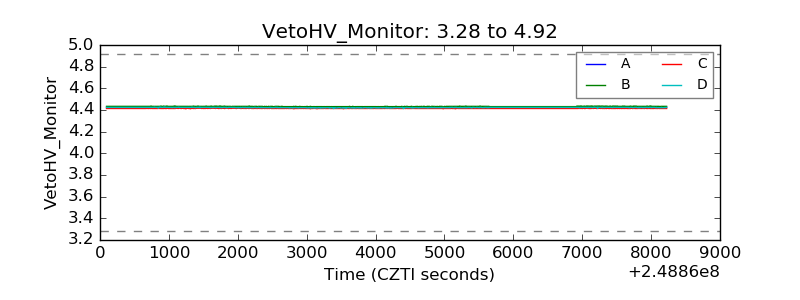 |
| Veto LLD | 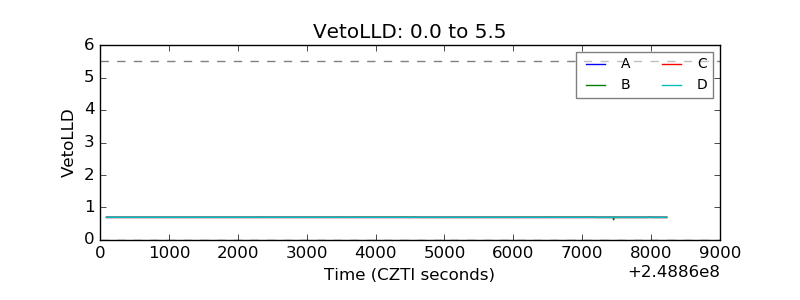 |
| Alpha Counter | 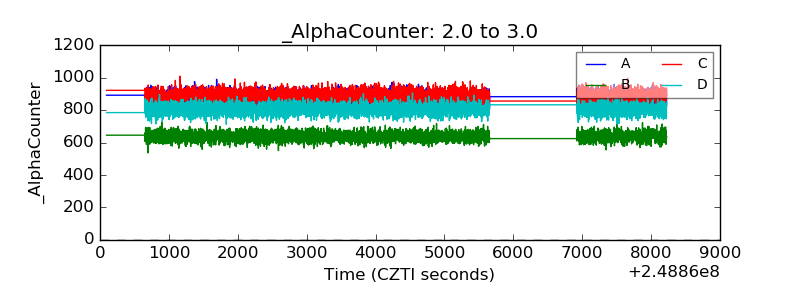 |
| _CPM_Rate | 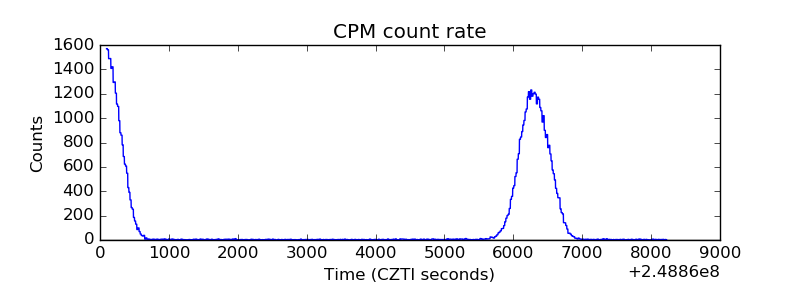 |
| CZT Counter | 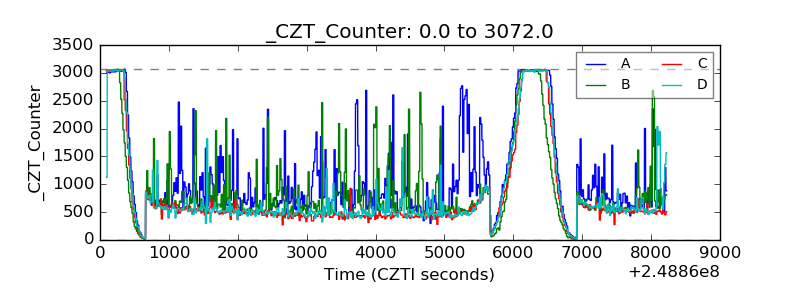 |
| +2.5 Volts monitor |  |
| +5 Volts monitor |  |
| _ROLL_ROT | 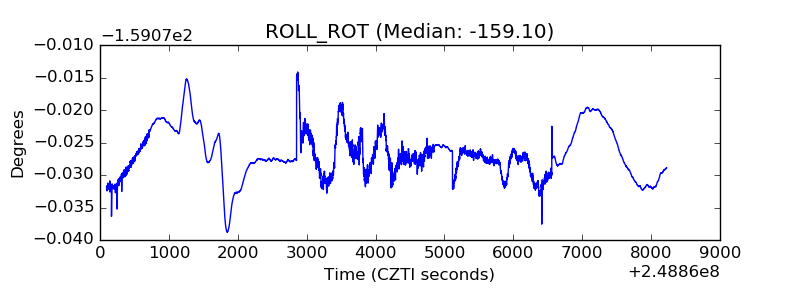 |
| _Roll_DEC | 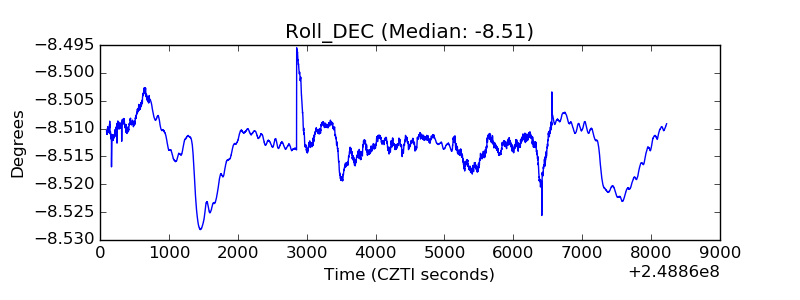 |
| _Roll_RA | 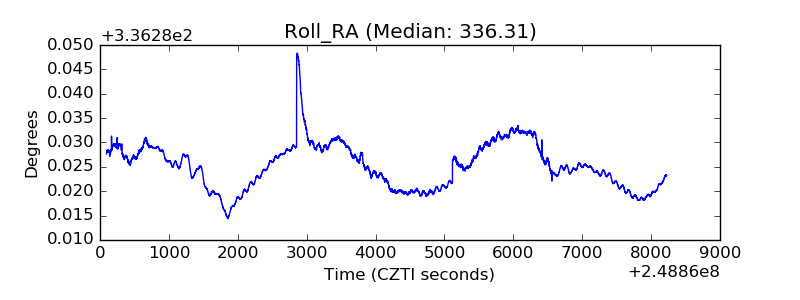 |
| Veto Counter | 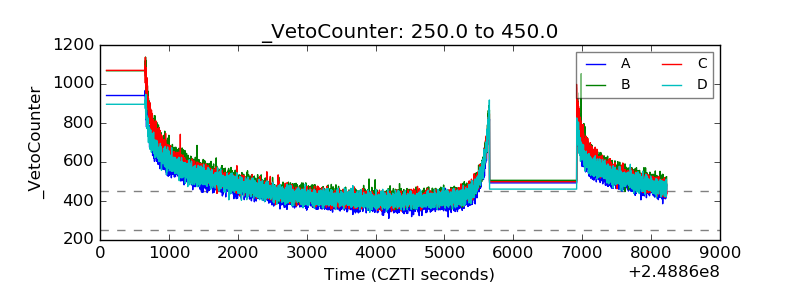 |