| Param | Original file | Final file |
|---|---|---|
| Filename | modeM0/AS1C03_020T01_9000001706_11609cztM0_level2.evt | modeM0/AS1C03_020T01_9000001706_11609cztM0_level2_quad_clean.evt |
| Size (bytes) | 677,784,960 | 94,622,400 |
| Size | 646.4 MB | 90.2 MB |
| Events in quadrant A | 6,816,019 | 588,393 |
| Events in quadrant B | 4,790,641 | 622,466 |
| Events in quadrant C | 3,150,841 | 627,526 |
| Events in quadrant D | 5,333,329 | 576,766 |
| Mode M0 | |||
|---|---|---|---|
| Quadrant | BADHDUFLAG | Total packets | Discarded packets |
| A | 0 | 24933 | 3 |
| B | 0 | 18490 | 2 |
| C | 0 | 13515 | 2 |
| D | 0 | 20171 | 2 |
| Mode M9 | |||
|---|---|---|---|
| Quadrant | BADHDUFLAG | Total packets | Discarded packets |
| A | 0 | 19 | 0 |
| B | 0 | 19 | 0 |
| C | 0 | 19 | 0 |
| D | 0 | 20 | 0 |
| Mode SS | |||
|---|---|---|---|
| Quadrant | BADHDUFLAG | Total packets | Discarded packets |
| A | 0 | 130 | 0 |
| B | 0 | 130 | 0 |
| C | 0 | 130 | 0 |
| D | 0 | 130 | 0 |
| Quadrant | Total seconds | Saturated seconds | Saturation percentage |
|---|---|---|---|
| A | 6450 | 1088 | 16.868217% |
| B | 6450 | 507 | 7.860465% |
| C | 6450 | 88 | 1.364341% |
| D | 6450 | 678 | 10.511628% |
Noise dominated data is calculated using 1-second bins in cleaned event files. If a bin has >2000 counts, and if more than 50% of those come from <1% of pixels, then it is considered to be noise-dominated and hence unusable.
| Quadrant | # 1 sec bins | Bins with >0 counts | Bins with >2000 counts | High rate bins dominated by noise | Noise dominated (total time) | Noise dominated (detector-on time) | Marked lightcurve |
|---|---|---|---|---|---|---|---|
| A | 7616 | 6452 | 597 | 597 | 7.84% | 9.25% | 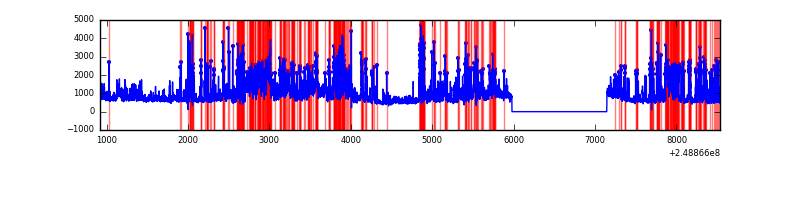 |
| B | 7616 | 6452 | 244 | 244 | 3.20% | 3.78% | 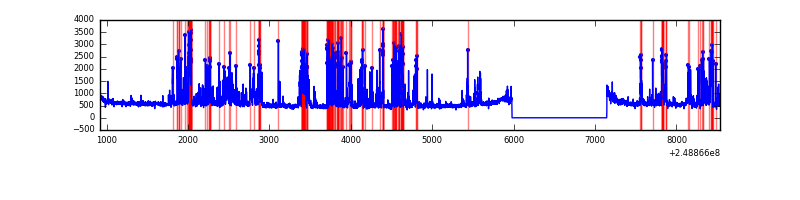 |
| C | 7616 | 6452 | 0 | 0 | 0.00% | 0.00% | 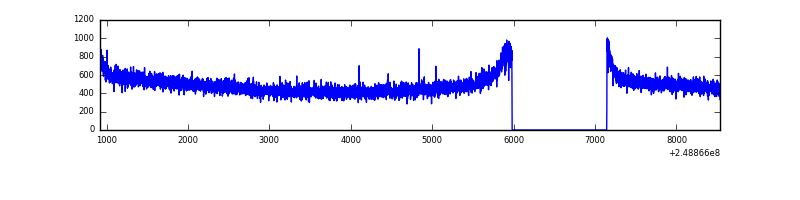 |
| D | 7616 | 6452 | 302 | 302 | 3.97% | 4.68% | 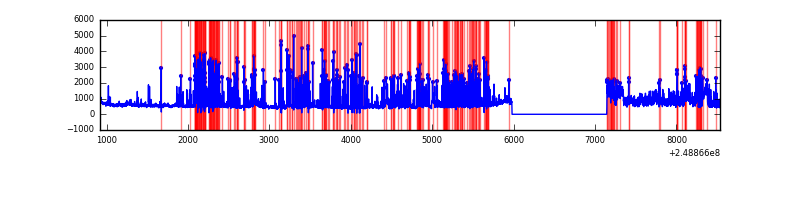 |
Top three noisy pixels from each quadrant. If the there are fewer than three noisy pixels in the level2.evt file, extra rows are filled as -1
| Pixel properties | Quadrant properties | ||||||
|---|---|---|---|---|---|---|---|
| Quadrant | DetID | PixID | Counts | Sigma | Mean | Median | Sigma |
| A | 8 | 5 | 3341811 | 20429.54 | 806 | 790 | 163.5 |
| A | 1 | 162 | 128381 | 780.19 | 806 | 790 | 163.5 |
| A | 1 | 178 | 72459 | 438.24 | 806 | 790 | 163.5 |
| B | 4 | 239 | 1341604 | 8478.29 | 826 | 807 | 158.1 |
| B | 0 | 219 | 52776 | 328.62 | 826 | 807 | 158.1 |
| B | 3 | 189 | 42406 | 263.04 | 826 | 807 | 158.1 |
| C | 13 | 61 | 5778 | 26.57 | 807 | 811 | 186.9 |
| C | 3 | 202 | 1966 | 6.18 | 807 | 811 | 186.9 |
| C | 13 | 250 | 1953 | 6.11 | 807 | 811 | 186.9 |
| D | 1 | 52 | 2178030 | 11562.27 | 784 | 762 | 188.3 |
| D | 8 | 195 | 64140 | 336.56 | 784 | 762 | 188.3 |
| D | 12 | 6 | 40602 | 211.57 | 784 | 762 | 188.3 |
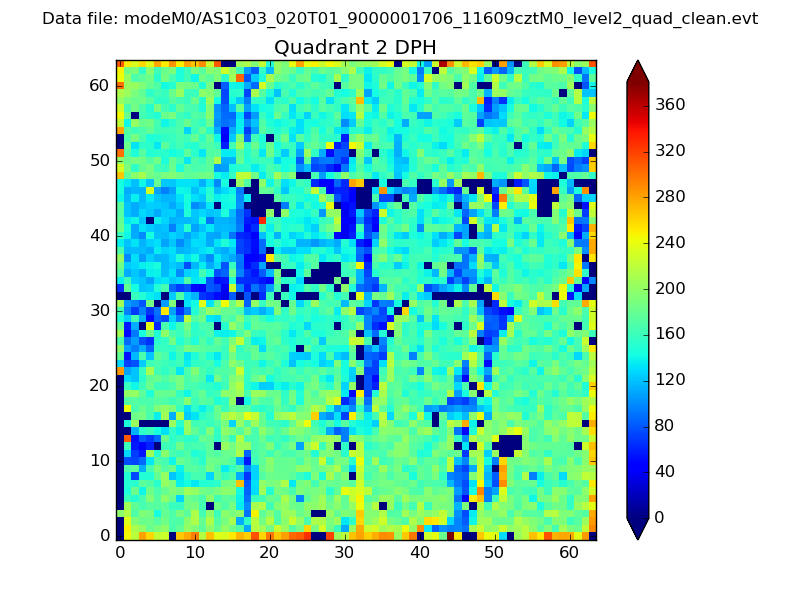
Histogram calculated using DETX and DETY for each event in the final _common_clean file
| Quadrant A | 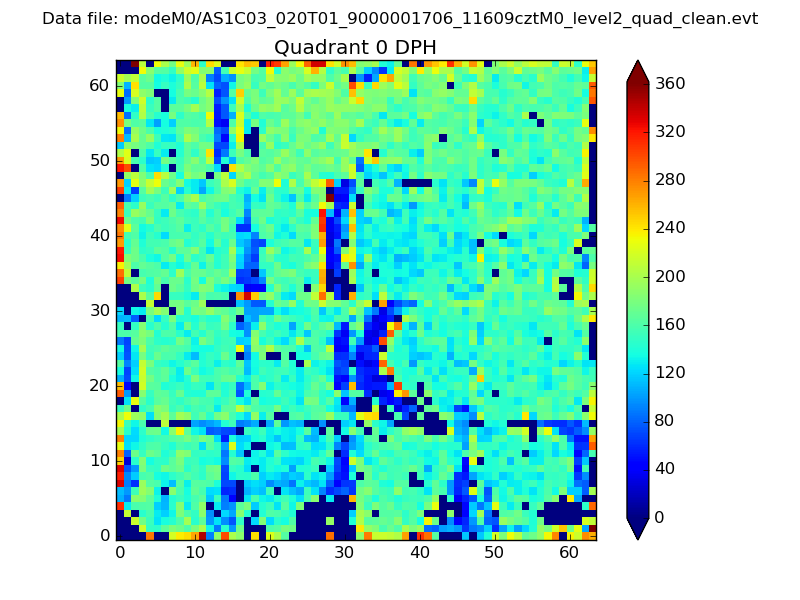 |
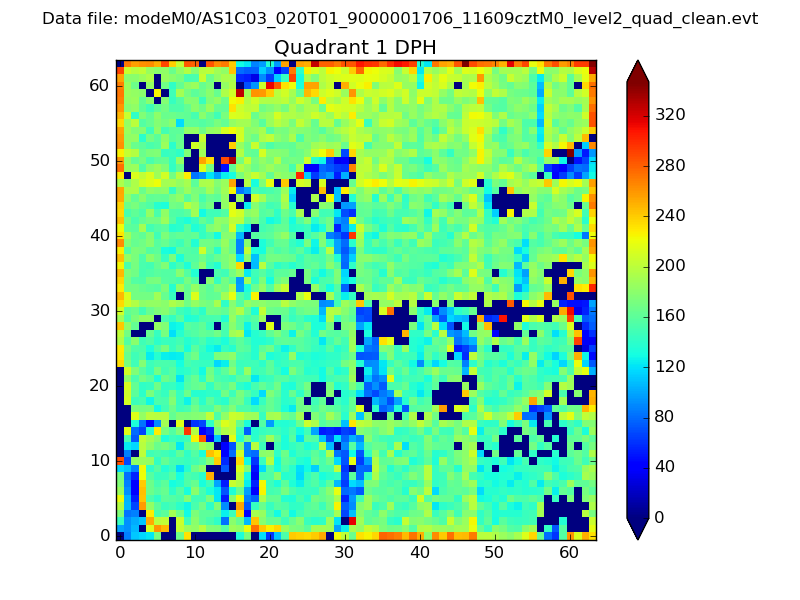 |
Quadrant B |
|---|---|---|---|
| Quadrant D | 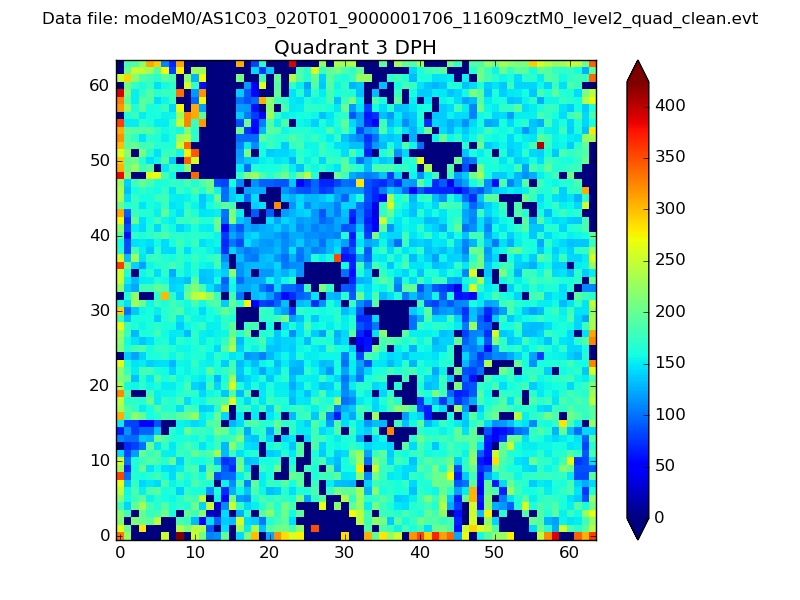 |
 |
Quadrant C |
| Plot type | Count rate plots | Images |
|---|---|---|
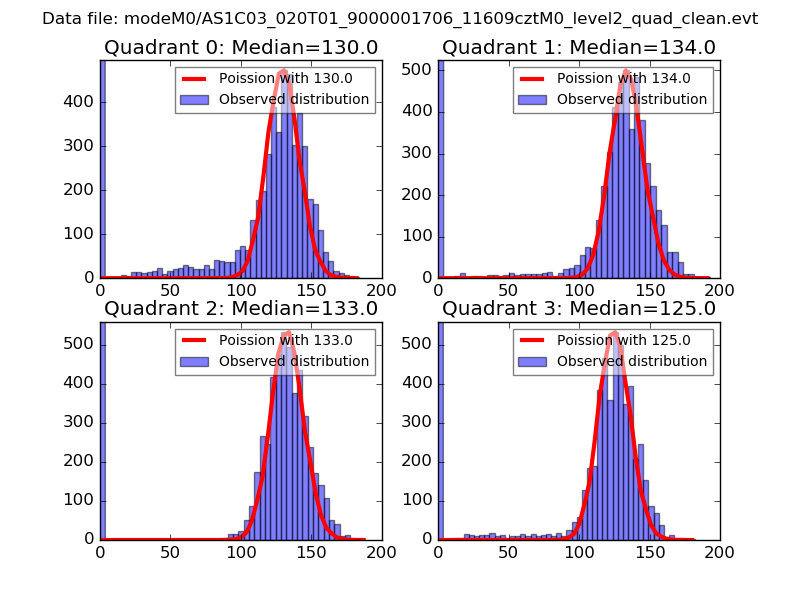
| Comparison with Poisson distribution Blue bars denote a histogram of data divided into 1 sec bins. Red curve is a Poisson curve with rate = median count rate of data. |
 |
 |
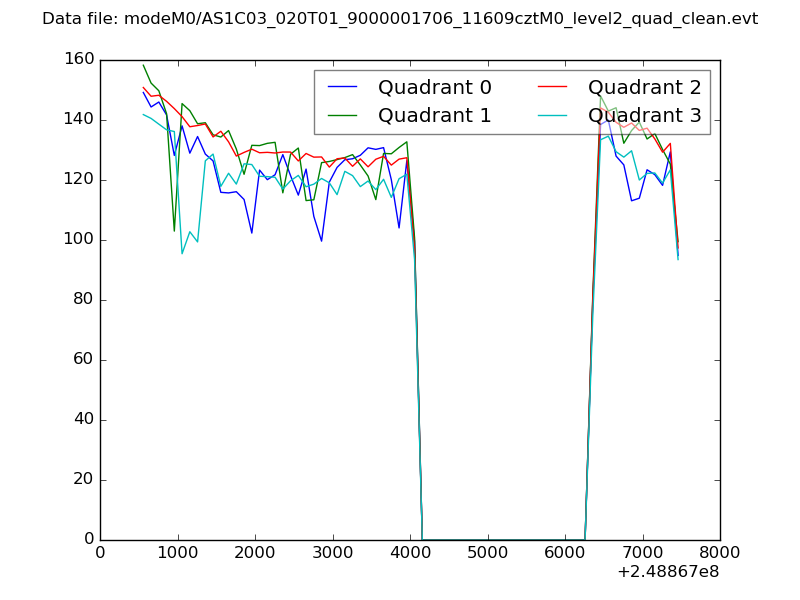
| Quadrant-wise count rates Data is divided into 100 sec bins |
 |
|
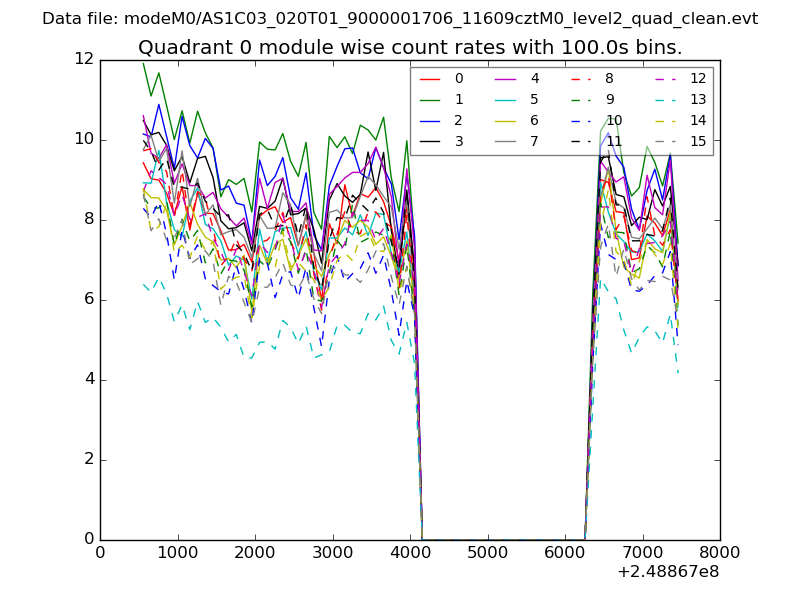
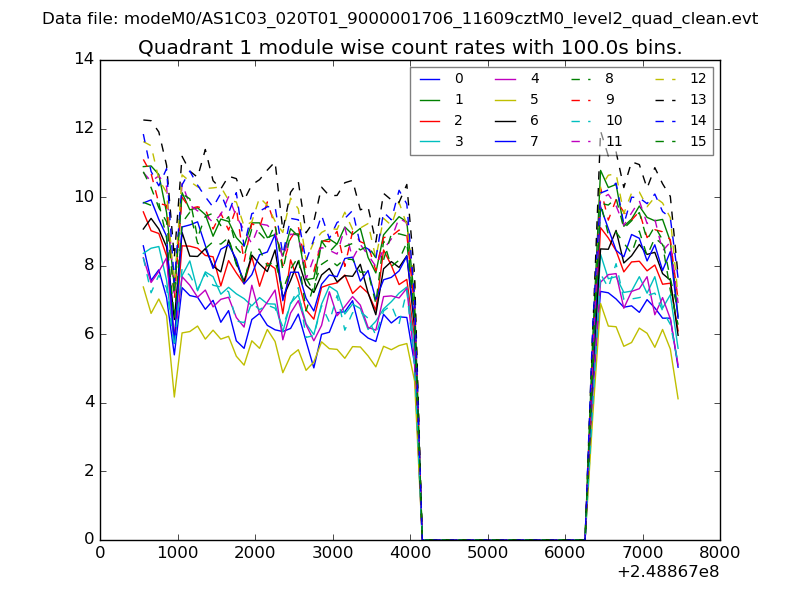
| Module-wise count rates for Quadrant A Data is divided into 100 sec bins |
 |
 |
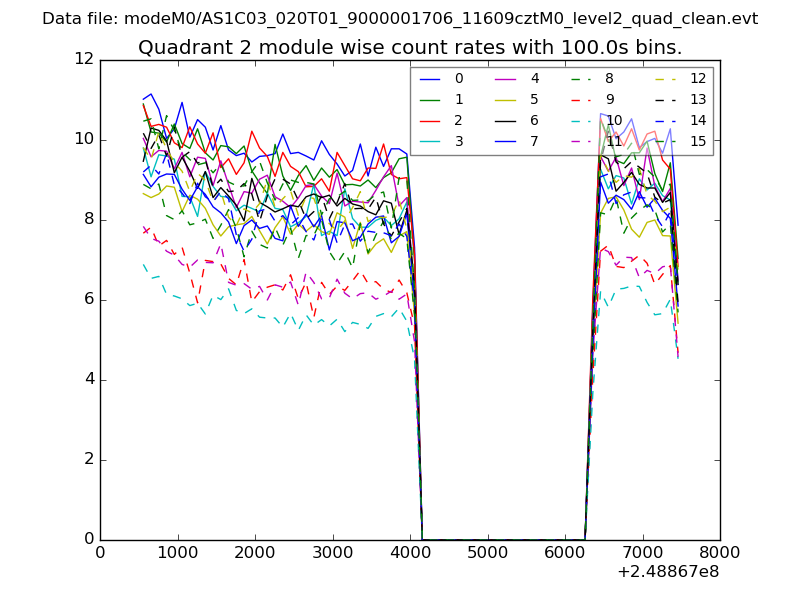
| Module-wise count rates for Quadrant B Data is divided into 100 sec bins |
 |
 |
| Module-wise count rates for Quadrant C Data is divided into 100 sec bins |
 |
 |
| Module-wise count rates for Quadrant D Data is divided into 100 sec bins |
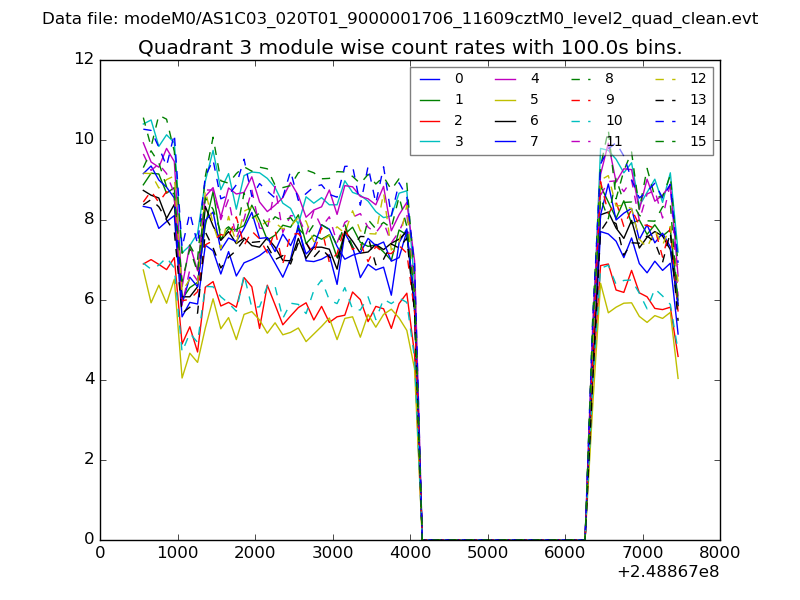 |
 |
| Parameter | Plot |
|---|---|
| CZT HV Monitor | 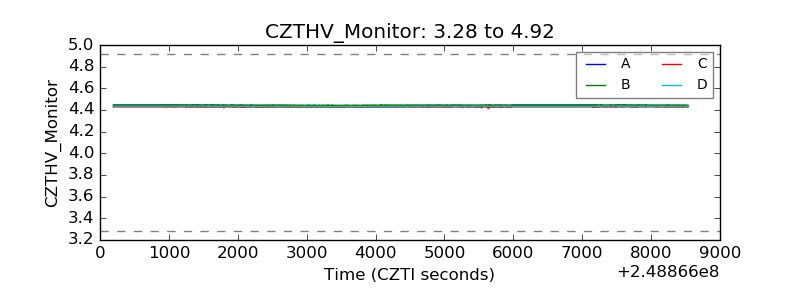 |
| D_VDD | 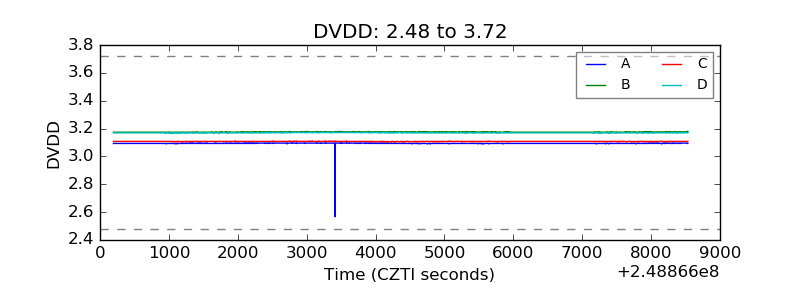 |
| Temperature 1 | 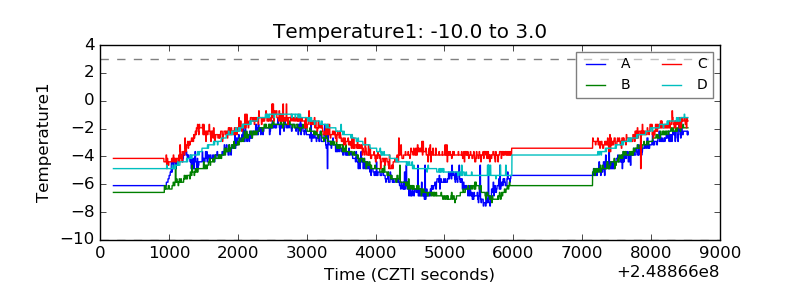 |
| Veto HV Monitor | 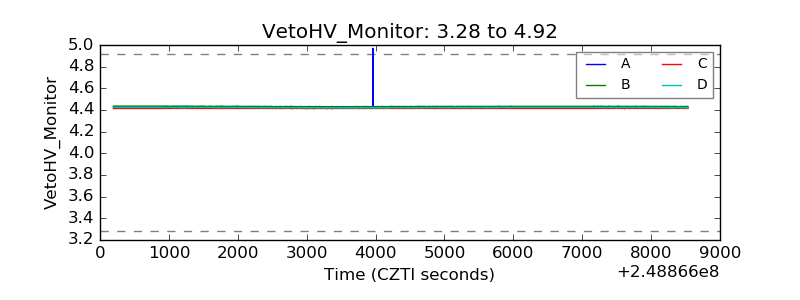 |
| Veto LLD | 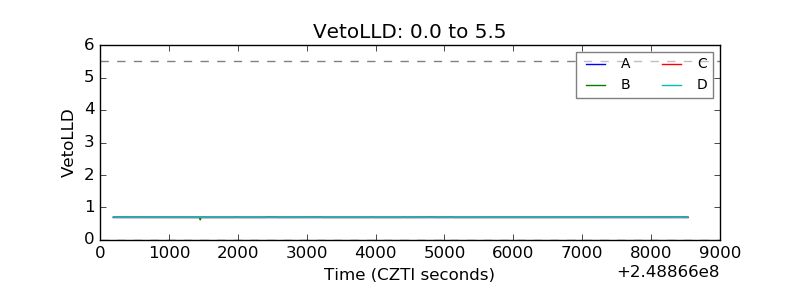 |
| Alpha Counter | 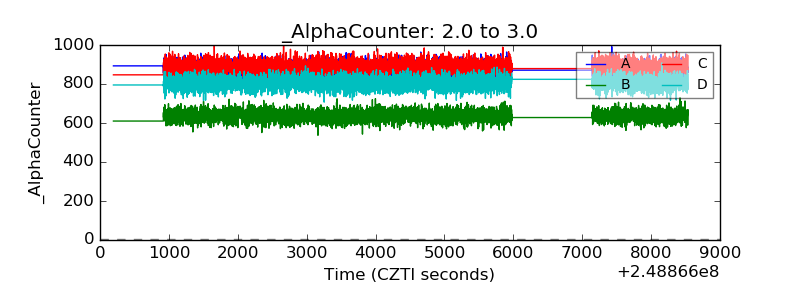 |
| _CPM_Rate | 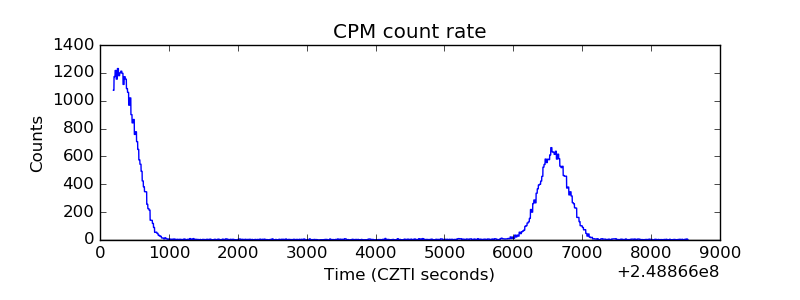 |
| CZT Counter | 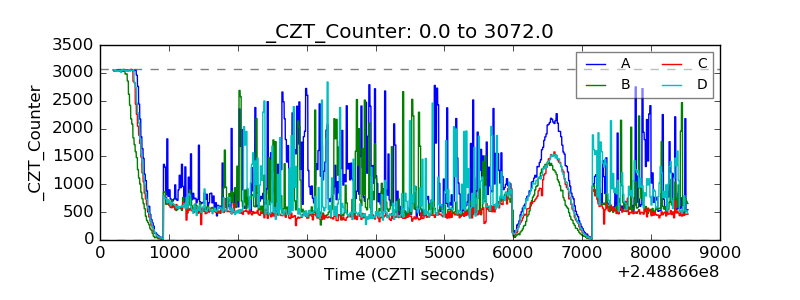 |
| +2.5 Volts monitor |  |
| +5 Volts monitor |  |
| _ROLL_ROT | 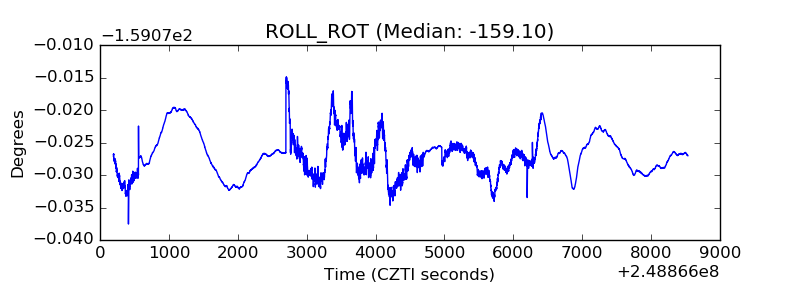 |
| _Roll_DEC | 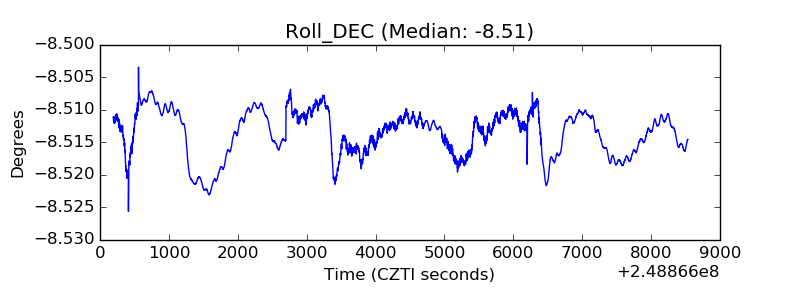 |
| _Roll_RA | 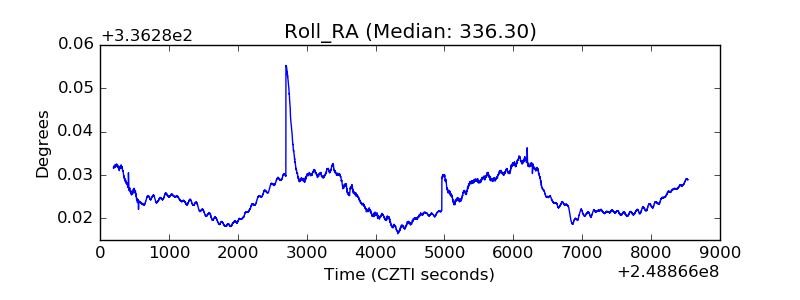 |
| Veto Counter | 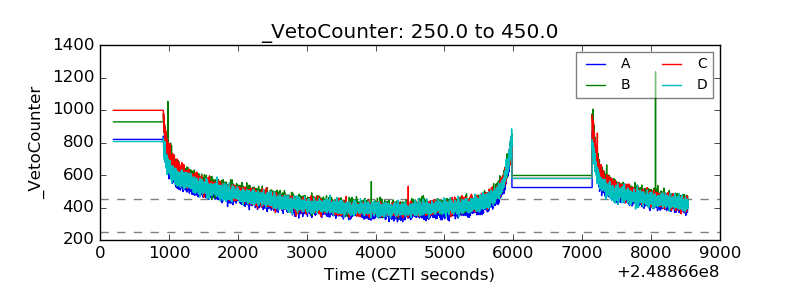 |