| Param | Original file | Final file |
|---|---|---|
| Filename | modeM0/AS1C03_020T01_9000001706_11610cztM0_level2.evt | modeM0/AS1C03_020T01_9000001706_11610cztM0_level2_quad_clean.evt |
| Size (bytes) | 589,769,280 | 86,016,960 |
| Size | 562.4 MB | 82.0 MB |
| Events in quadrant A | 6,734,897 | 525,160 |
| Events in quadrant B | 4,293,210 | 560,169 |
| Events in quadrant C | 2,728,455 | 568,275 |
| Events in quadrant D | 3,704,650 | 538,092 |
| Mode M0 | |||
|---|---|---|---|
| Quadrant | BADHDUFLAG | Total packets | Discarded packets |
| A | 0 | 24076 | 2 |
| B | 0 | 16579 | 1 |
| C | 0 | 12146 | 1 |
| D | 0 | 15007 | 1 |
| Mode M9 | |||
|---|---|---|---|
| Quadrant | BADHDUFLAG | Total packets | Discarded packets |
| A | 0 | 9 | 0 |
| B | 0 | 9 | 0 |
| C | 0 | 9 | 0 |
| D | 0 | 9 | 0 |
| Mode SS | |||
|---|---|---|---|
| Quadrant | BADHDUFLAG | Total packets | Discarded packets |
| A | 0 | 122 | 0 |
| B | 0 | 122 | 0 |
| C | 0 | 122 | 0 |
| D | 0 | 122 | 0 |
| Quadrant | Total seconds | Saturated seconds | Saturation percentage |
|---|---|---|---|
| A | 5897 | 1357 | 23.011701% |
| B | 5897 | 438 | 7.427506% |
| C | 5897 | 55 | 0.932678% |
| D | 5897 | 220 | 3.730711% |
Noise dominated data is calculated using 1-second bins in cleaned event files. If a bin has >2000 counts, and if more than 50% of those come from <1% of pixels, then it is considered to be noise-dominated and hence unusable.
| Quadrant | # 1 sec bins | Bins with >0 counts | Bins with >2000 counts | High rate bins dominated by noise | Noise dominated (total time) | Noise dominated (detector-on time) | Marked lightcurve |
|---|---|---|---|---|---|---|---|
| A | 6878 | 5898 | 944 | 944 | 13.72% | 16.01% | 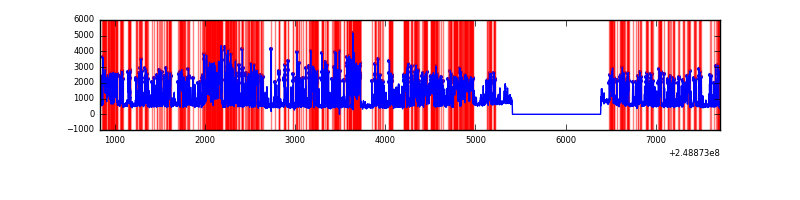 |
| B | 6878 | 5899 | 218 | 218 | 3.17% | 3.70% | 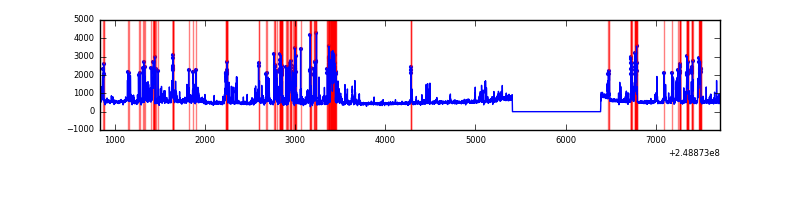 |
| C | 6878 | 5899 | 0 | 0 | 0.00% | 0.00% | 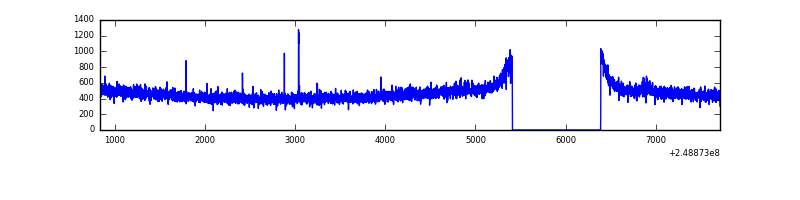 |
| D | 6878 | 5899 | 109 | 109 | 1.58% | 1.85% | 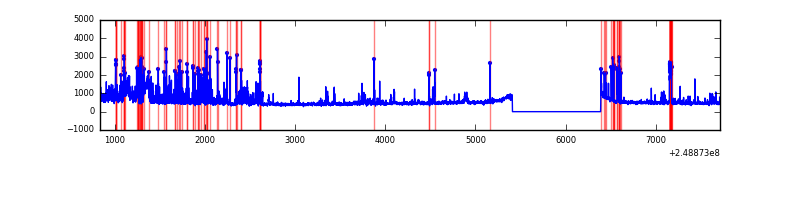 |
Top three noisy pixels from each quadrant. If the there are fewer than three noisy pixels in the level2.evt file, extra rows are filled as -1
| Pixel properties | Quadrant properties | ||||||
|---|---|---|---|---|---|---|---|
| Quadrant | DetID | PixID | Counts | Sigma | Mean | Median | Sigma |
| A | 8 | 5 | 3707651 | 26587.24 | 681 | 667 | 139.4 |
| A | 1 | 162 | 141290 | 1008.58 | 681 | 667 | 139.4 |
| A | 1 | 178 | 82230 | 584.99 | 681 | 667 | 139.4 |
| B | 4 | 239 | 1173104 | 8534.41 | 711 | 696 | 137.4 |
| B | 3 | 64 | 188917 | 1370.13 | 711 | 696 | 137.4 |
| B | 0 | 219 | 46055 | 330.19 | 711 | 696 | 137.4 |
| C | 8 | 208 | 5491 | 29.65 | 698 | 701 | 161.5 |
| C | 13 | 61 | 5078 | 27.1 | 698 | 701 | 161.5 |
| C | 9 | 54 | 3695 | 18.53 | 698 | 701 | 161.5 |
| D | 1 | 52 | 879151 | 5238.44 | 695 | 676 | 167.7 |
| D | 13 | 104 | 29596 | 172.45 | 695 | 676 | 167.7 |
| D | 2 | 136 | 28203 | 164.15 | 695 | 676 | 167.7 |
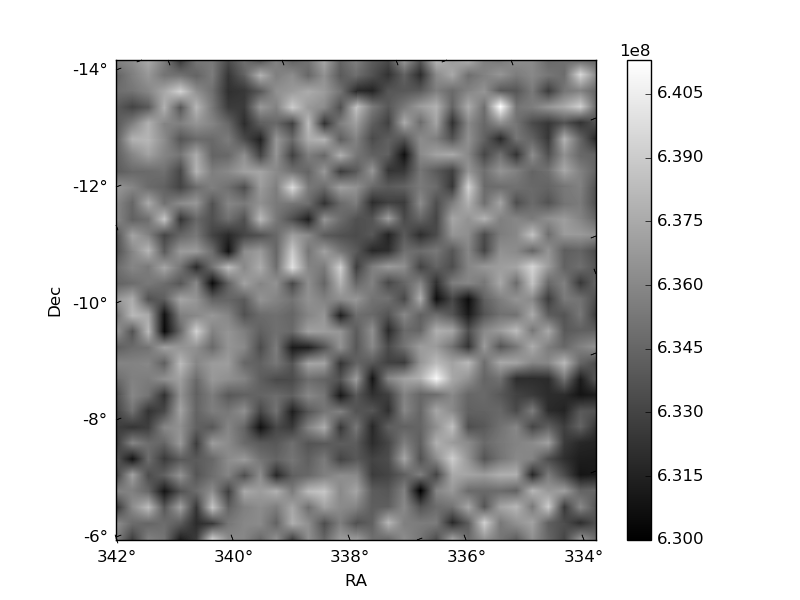
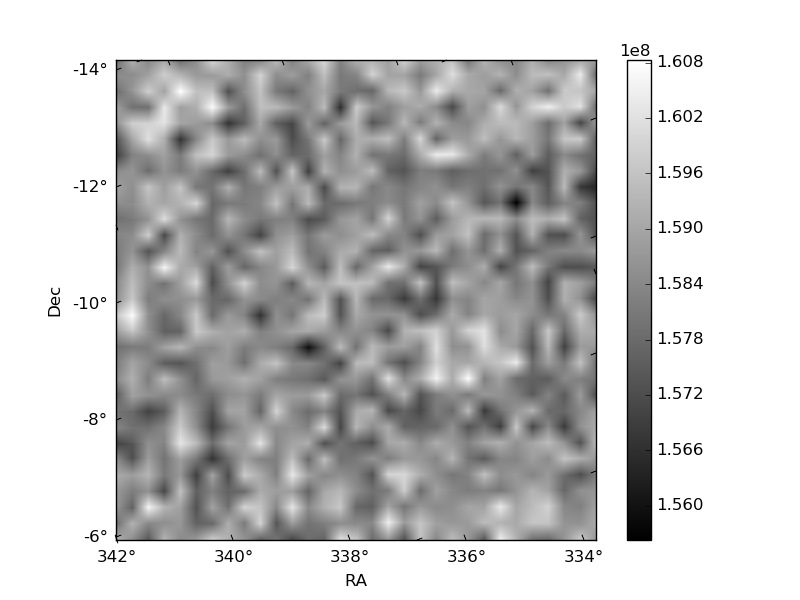
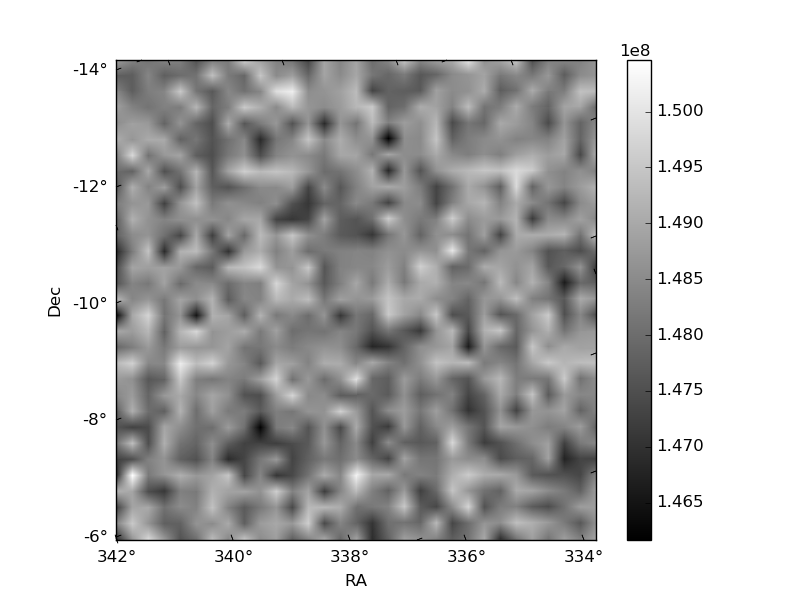
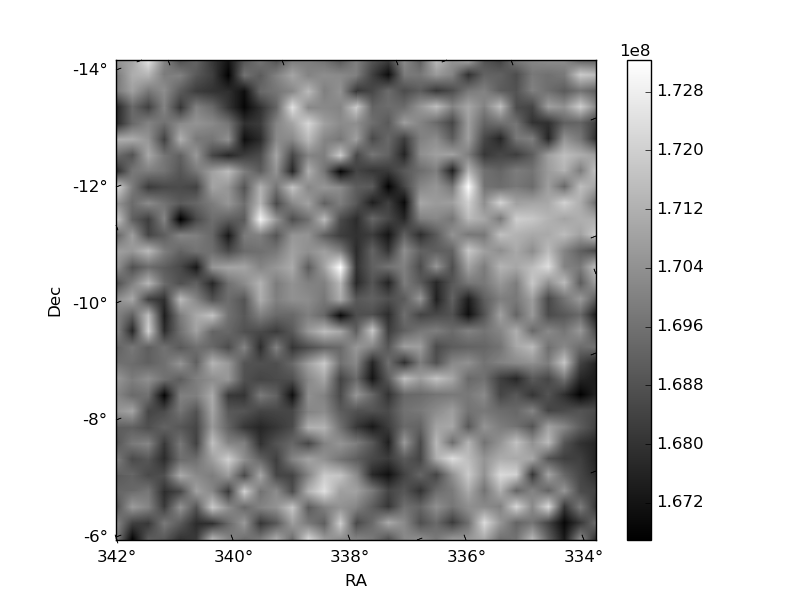
Histogram calculated using DETX and DETY for each event in the final _common_clean file
| Quadrant A | 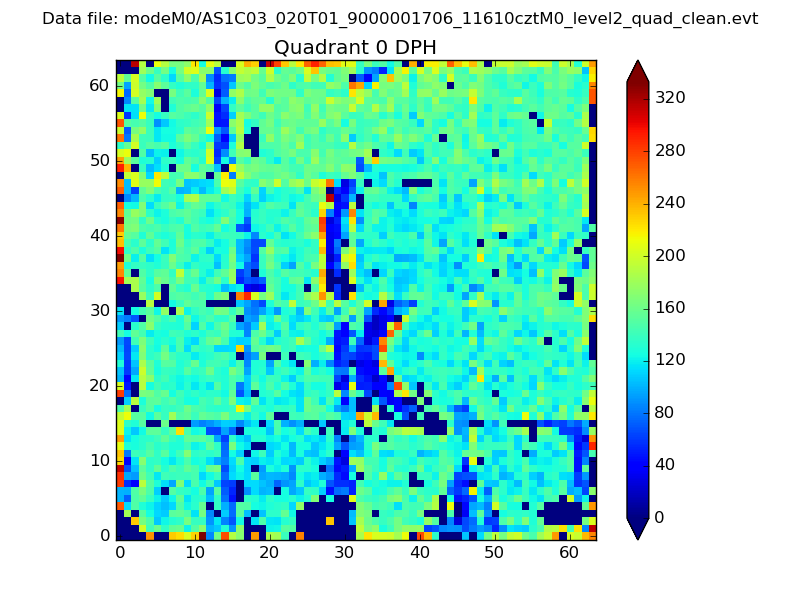 |
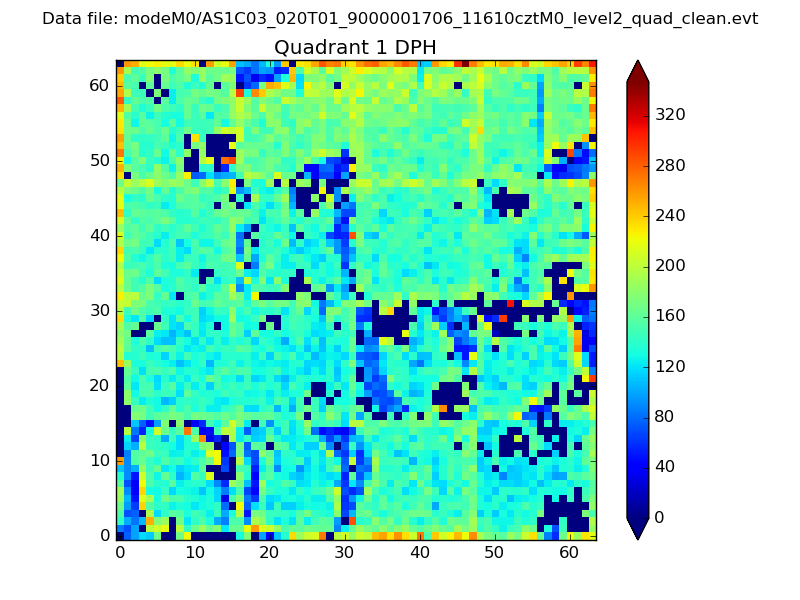 |
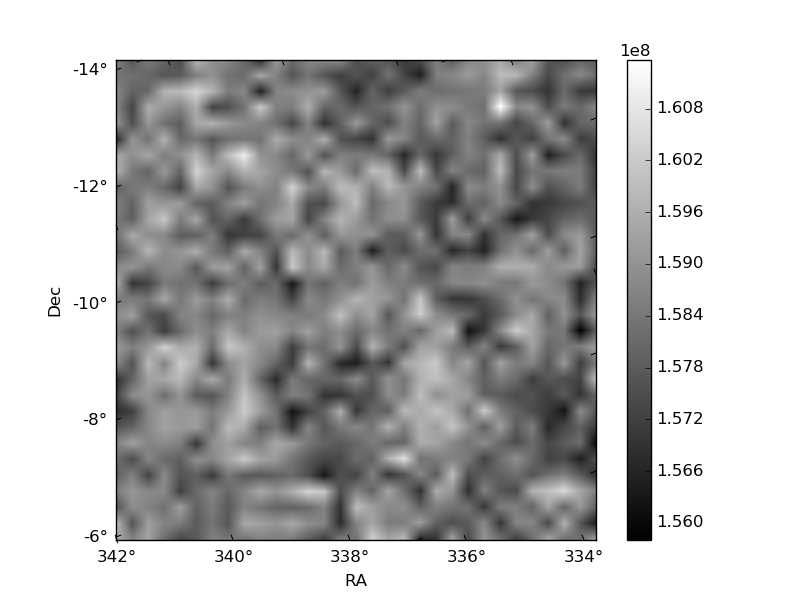
Quadrant B |
|---|---|---|---|
| Quadrant D | 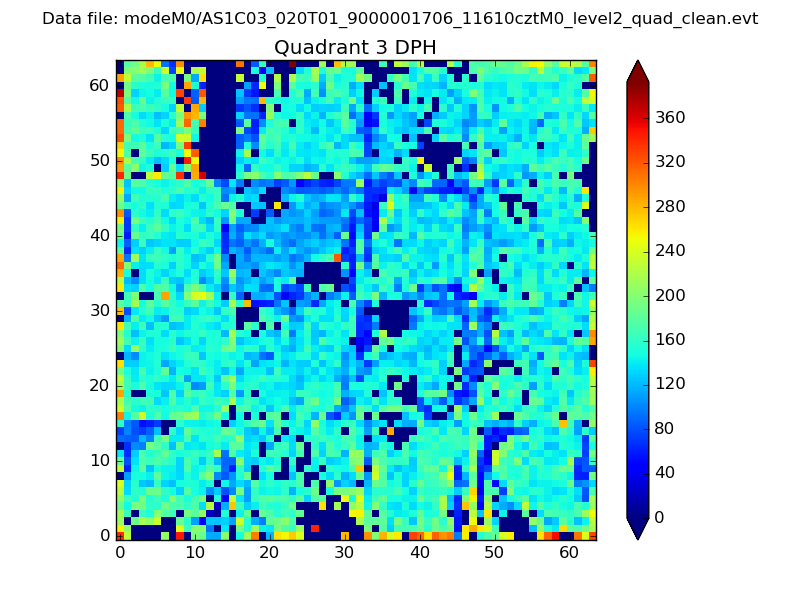 |
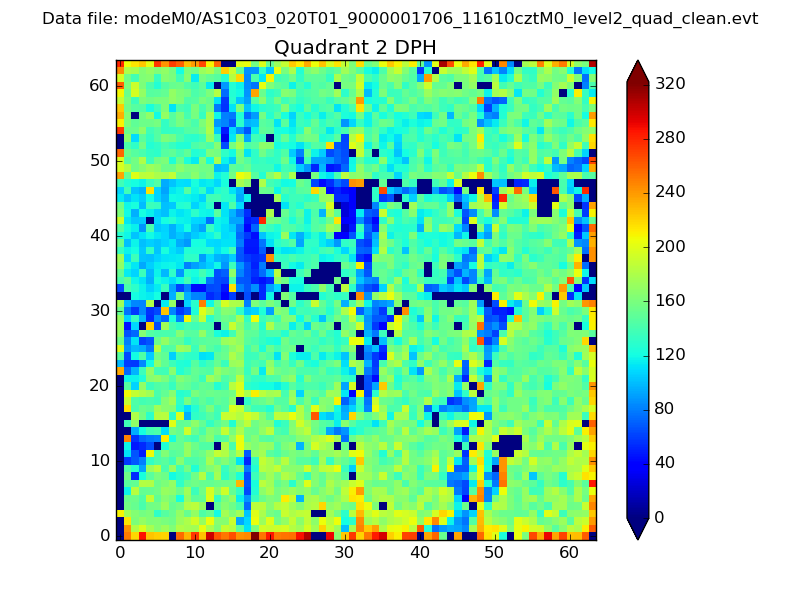 |
Quadrant C |
| Plot type | Count rate plots | Images |
|---|---|---|
| Comparison with Poisson distribution Blue bars denote a histogram of data divided into 1 sec bins. Red curve is a Poisson curve with rate = median count rate of data. |
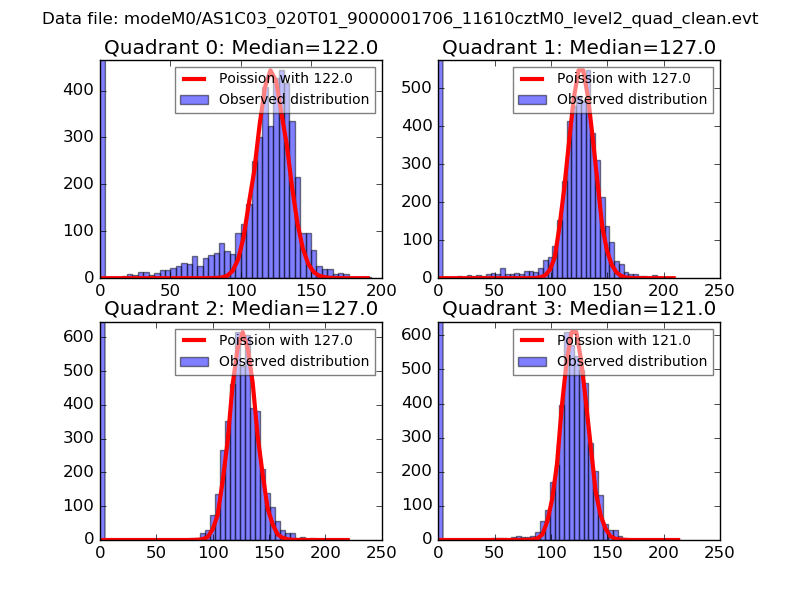 |
 |
| Quadrant-wise count rates Data is divided into 100 sec bins |
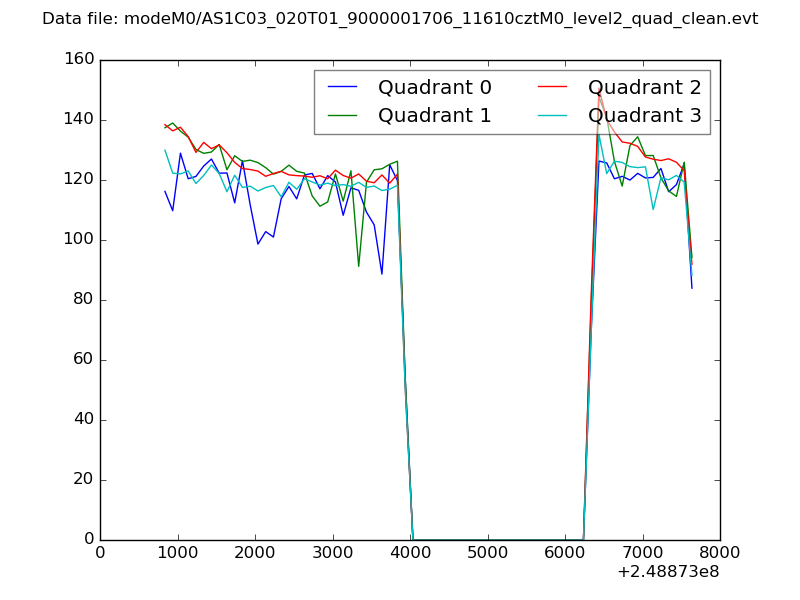 |
|
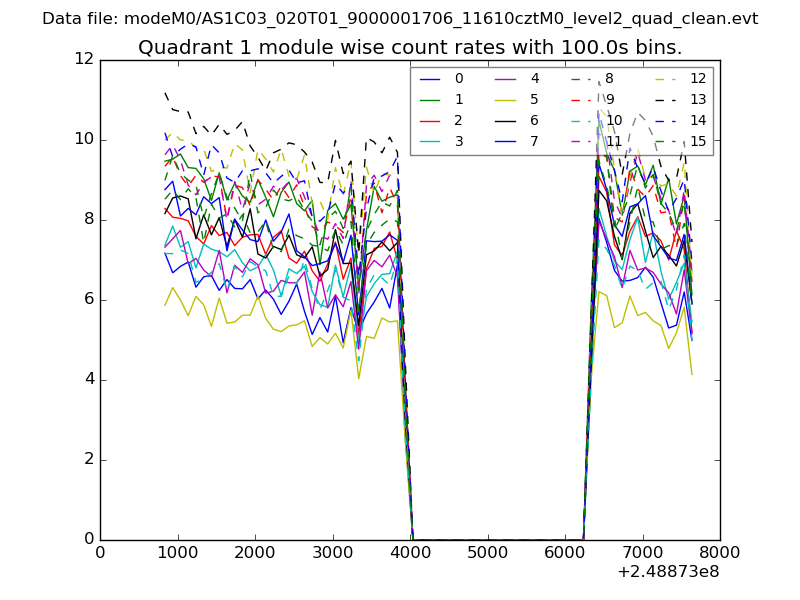
| Module-wise count rates for Quadrant A Data is divided into 100 sec bins |
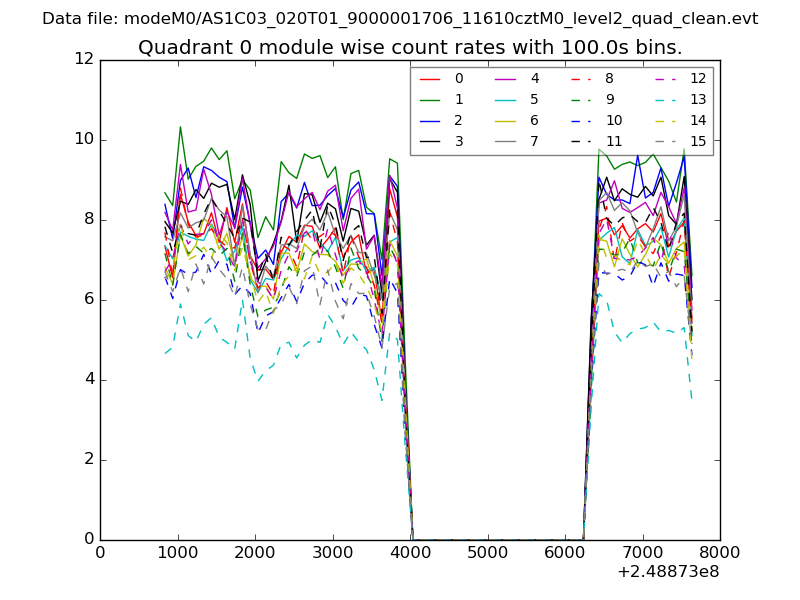 |
 |
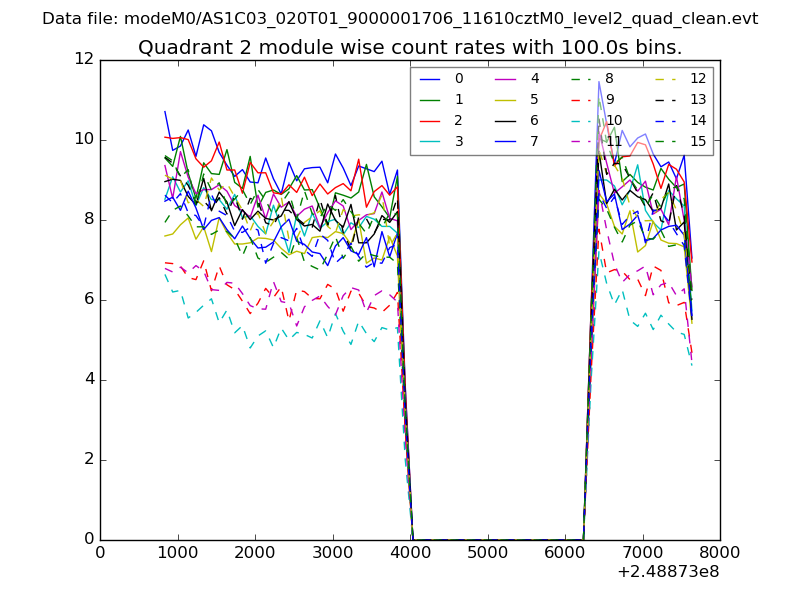
| Module-wise count rates for Quadrant B Data is divided into 100 sec bins |
 |
 |
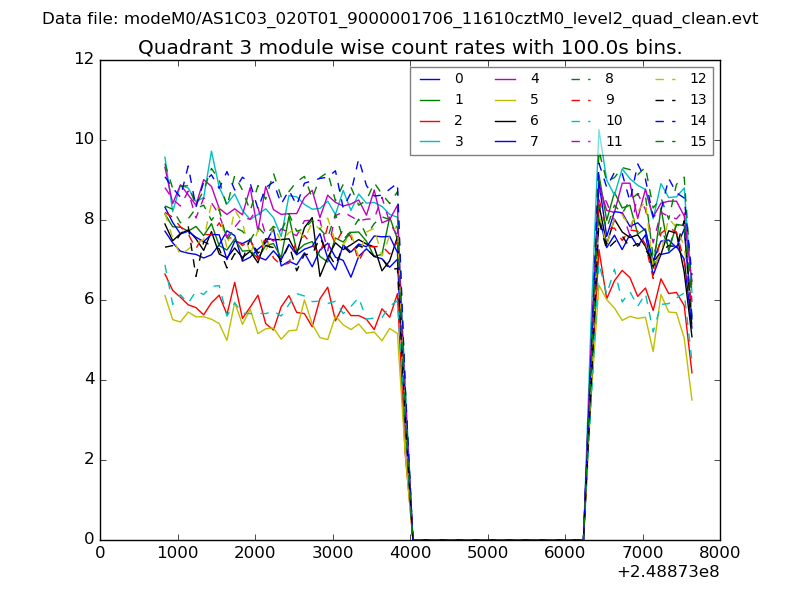
| Module-wise count rates for Quadrant C Data is divided into 100 sec bins |
 |
 |
| Module-wise count rates for Quadrant D Data is divided into 100 sec bins |
 |
 |
| Parameter | Plot |
|---|---|
| CZT HV Monitor | 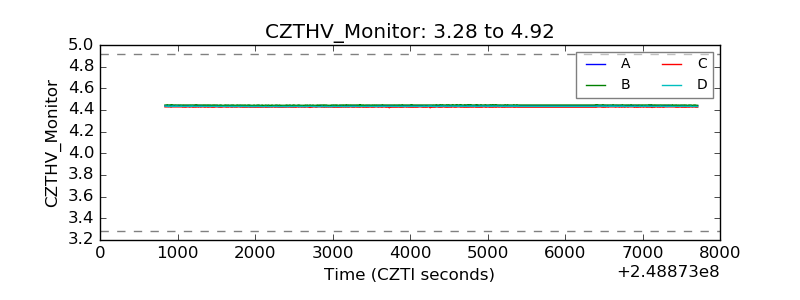 |
| D_VDD | 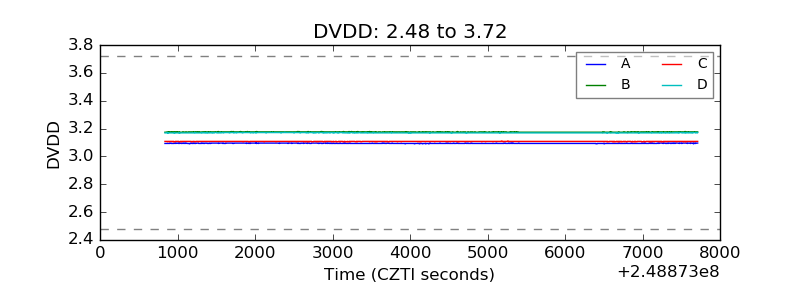 |
| Temperature 1 | 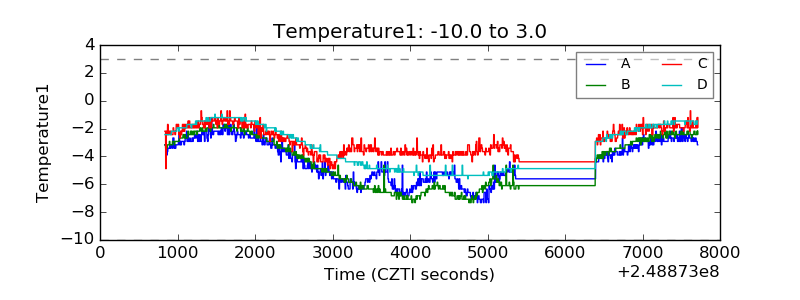 |
| Veto HV Monitor | 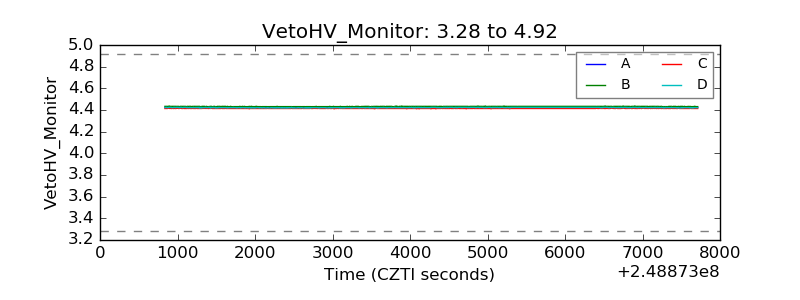 |
| Veto LLD | 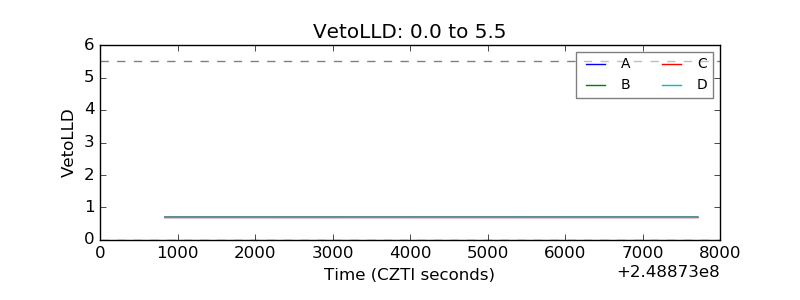 |
| Alpha Counter | 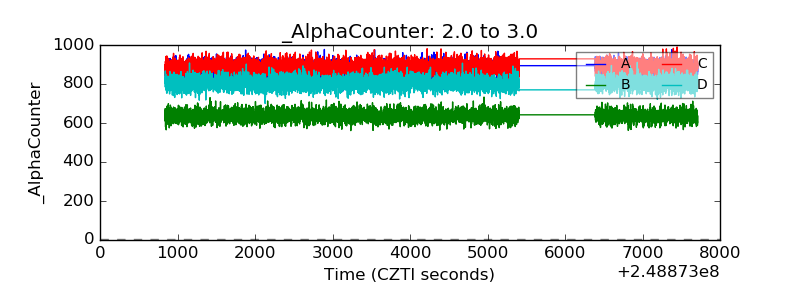 |
| _CPM_Rate | 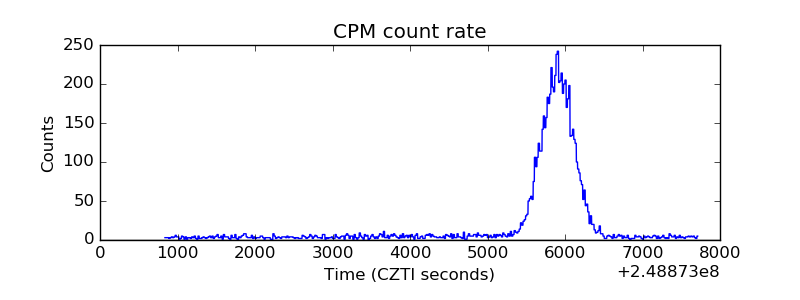 |
| CZT Counter | 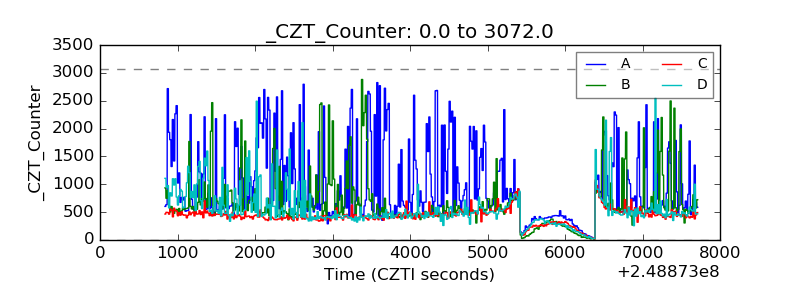 |
| +2.5 Volts monitor |  |
| +5 Volts monitor |  |
| _ROLL_ROT | 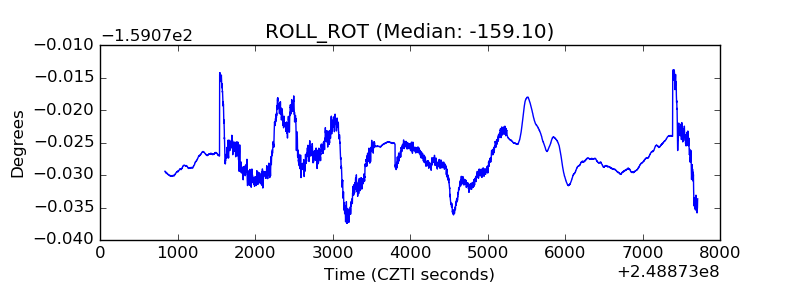 |
| _Roll_DEC | 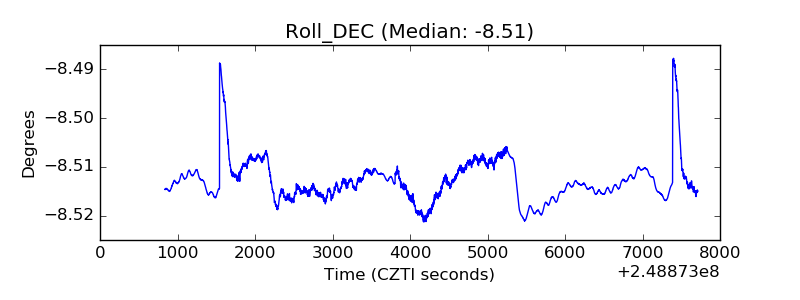 |
| _Roll_RA | 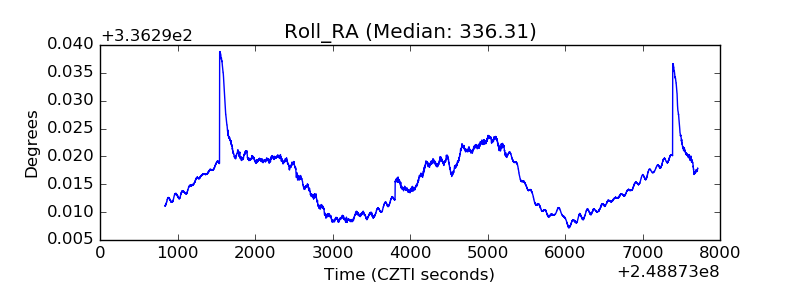 |
| Veto Counter | 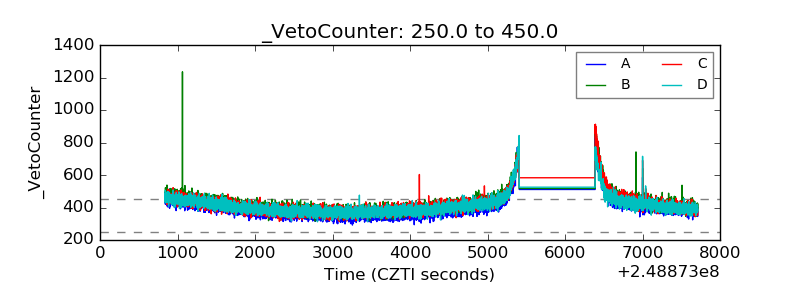 |