| Param | Original file | Final file |
|---|---|---|
| Filename | modeM0/AS1C03_020T01_9000001706_11614cztM0_level2.evt | modeM0/AS1C03_020T01_9000001706_11614cztM0_level2_quad_clean.evt |
| Size (bytes) | 625,259,520 | 91,569,600 |
| Size | 596.3 MB | 87.3 MB |
| Events in quadrant A | 6,113,435 | 566,357 |
| Events in quadrant B | 4,850,085 | 576,067 |
| Events in quadrant C | 3,188,662 | 586,274 |
| Events in quadrant D | 4,304,611 | 550,779 |
| Mode M0 | |||
|---|---|---|---|
| Quadrant | BADHDUFLAG | Total packets | Discarded packets |
| A | 0 | 22954 | 1 |
| B | 0 | 19108 | 1 |
| C | 0 | 14517 | 1 |
| D | 0 | 17879 | 1 |
| Mode M9 | |||
|---|---|---|---|
| Quadrant | BADHDUFLAG | Total packets | Discarded packets |
| A | 0 | 3 | 0 |
| B | 0 | 3 | 0 |
| C | 0 | 3 | 0 |
| D | 0 | 3 | 0 |
| Mode SS | |||
|---|---|---|---|
| Quadrant | BADHDUFLAG | Total packets | Discarded packets |
| A | 0 | 142 | 0 |
| B | 0 | 142 | 0 |
| C | 0 | 142 | 0 |
| D | 0 | 142 | 0 |
| Quadrant | Total seconds | Saturated seconds | Saturation percentage |
|---|---|---|---|
| A | 7087 | 595 | 8.395654% |
| B | 7087 | 400 | 5.644137% |
| C | 7087 | 11 | 0.155214% |
| D | 7087 | 279 | 3.936786% |
Noise dominated data is calculated using 1-second bins in cleaned event files. If a bin has >2000 counts, and if more than 50% of those come from <1% of pixels, then it is considered to be noise-dominated and hence unusable.
| Quadrant | # 1 sec bins | Bins with >0 counts | Bins with >2000 counts | High rate bins dominated by noise | Noise dominated (total time) | Noise dominated (detector-on time) | Marked lightcurve |
|---|---|---|---|---|---|---|---|
| A | 7363 | 7089 | 338 | 338 | 4.59% | 4.77% | 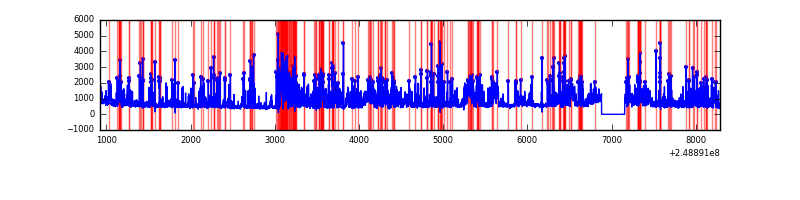 |
| B | 7363 | 7089 | 212 | 212 | 2.88% | 2.99% | 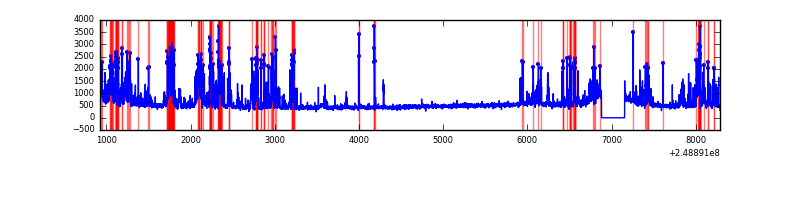 |
| C | 7363 | 7089 | 0 | 0 | 0.00% | 0.00% | 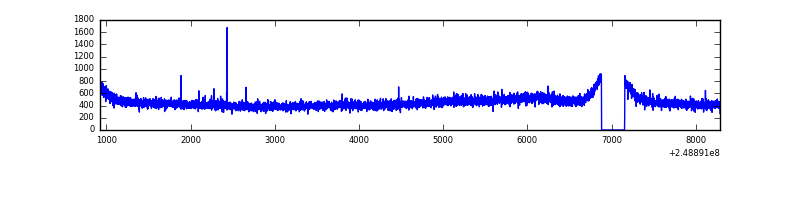 |
| D | 7363 | 7089 | 239 | 239 | 3.25% | 3.37% | 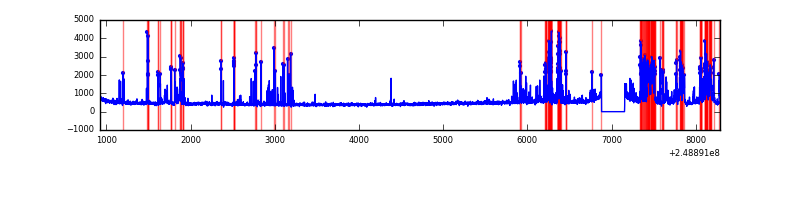 |
Top three noisy pixels from each quadrant. If the there are fewer than three noisy pixels in the level2.evt file, extra rows are filled as -1
| Pixel properties | Quadrant properties | ||||||
|---|---|---|---|---|---|---|---|
| Quadrant | DetID | PixID | Counts | Sigma | Mean | Median | Sigma |
| A | 8 | 5 | 2566398 | 14994.61 | 829 | 810 | 171.1 |
| A | 1 | 162 | 117170 | 680.07 | 829 | 810 | 171.1 |
| A | 1 | 178 | 64624 | 372.96 | 829 | 810 | 171.1 |
| B | 4 | 239 | 1203596 | 7398.38 | 837 | 813 | 162.6 |
| B | 10 | 16 | 154678 | 946.43 | 837 | 813 | 162.6 |
| B | 3 | 64 | 132237 | 808.39 | 837 | 813 | 162.6 |
| C | 13 | 61 | 6048 | 27.35 | 817 | 820 | 191.1 |
| C | 12 | 4 | 3594 | 14.51 | 817 | 820 | 191.1 |
| C | 3 | 202 | 2085 | 6.62 | 817 | 820 | 191.1 |
| D | 13 | 104 | 374063 | 1923.49 | 805 | 783 | 194.1 |
| D | 1 | 52 | 335078 | 1722.6 | 805 | 783 | 194.1 |
| D | 10 | 253 | 264577 | 1359.32 | 805 | 783 | 194.1 |
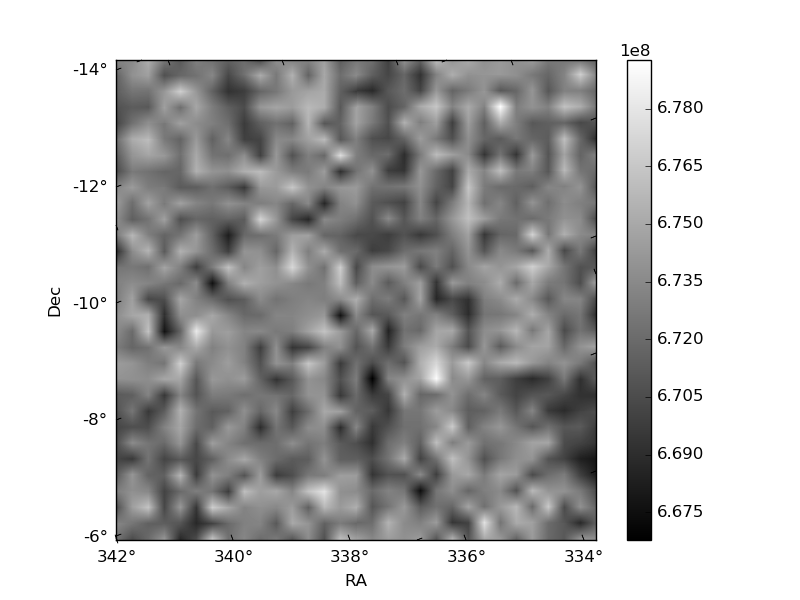
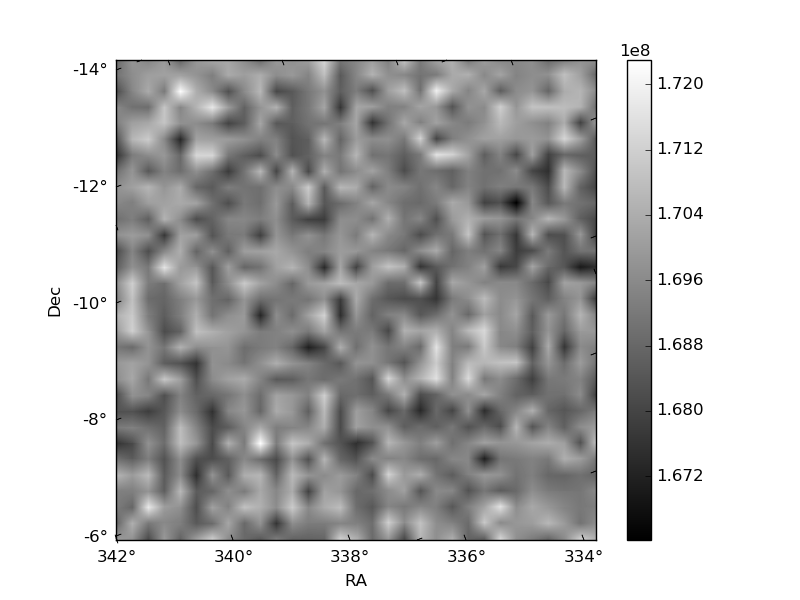
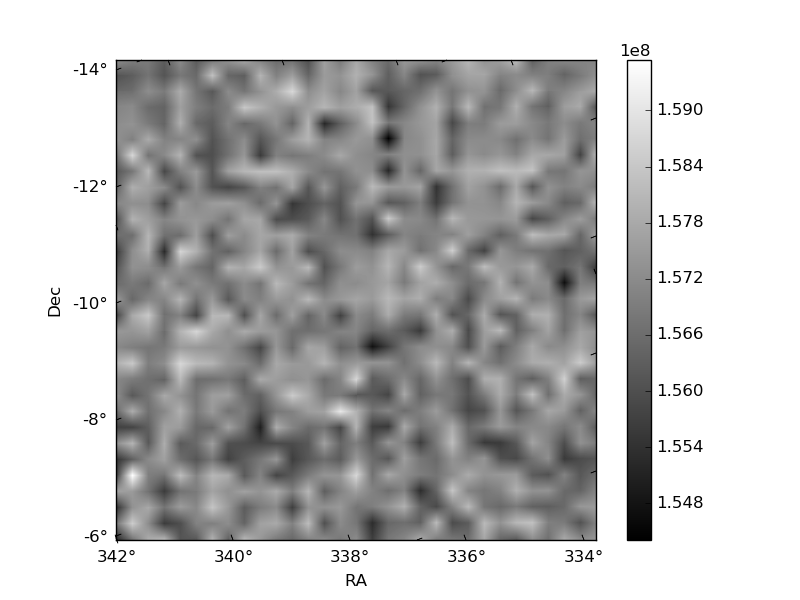
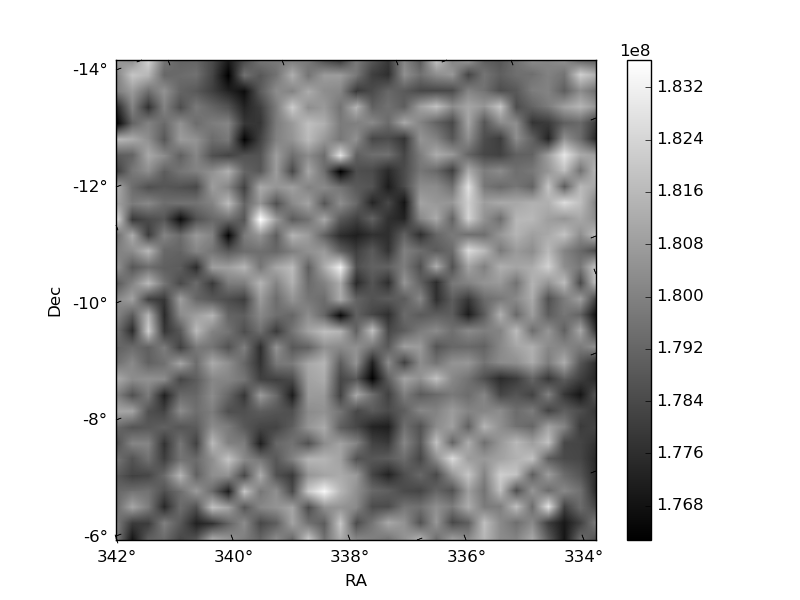
Histogram calculated using DETX and DETY for each event in the final _common_clean file
| Quadrant A | 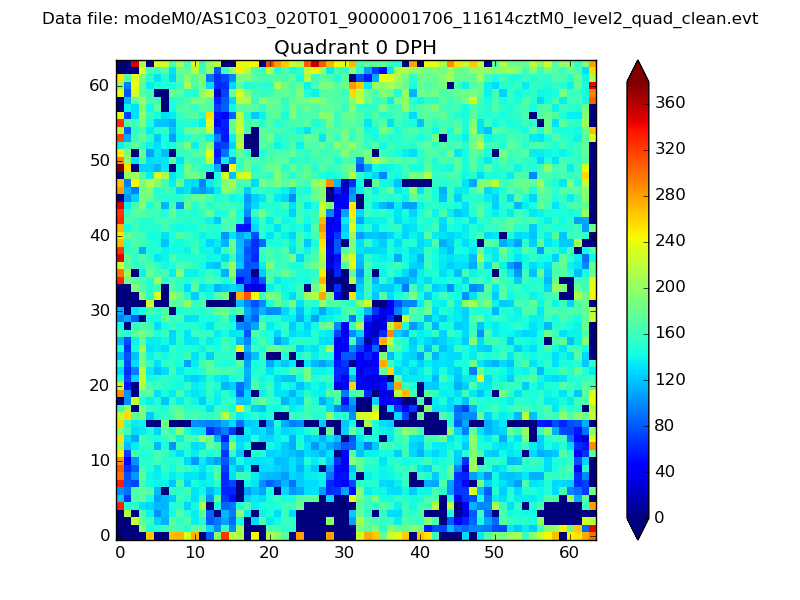 |
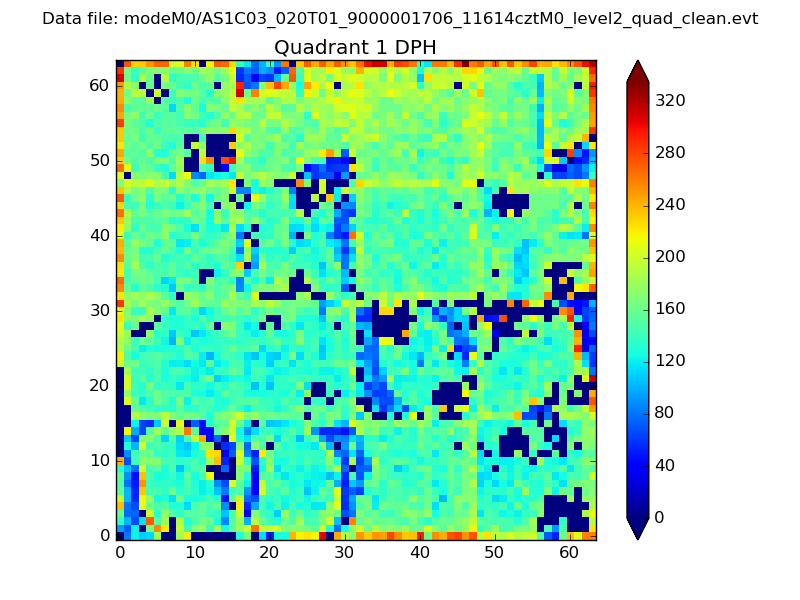 |
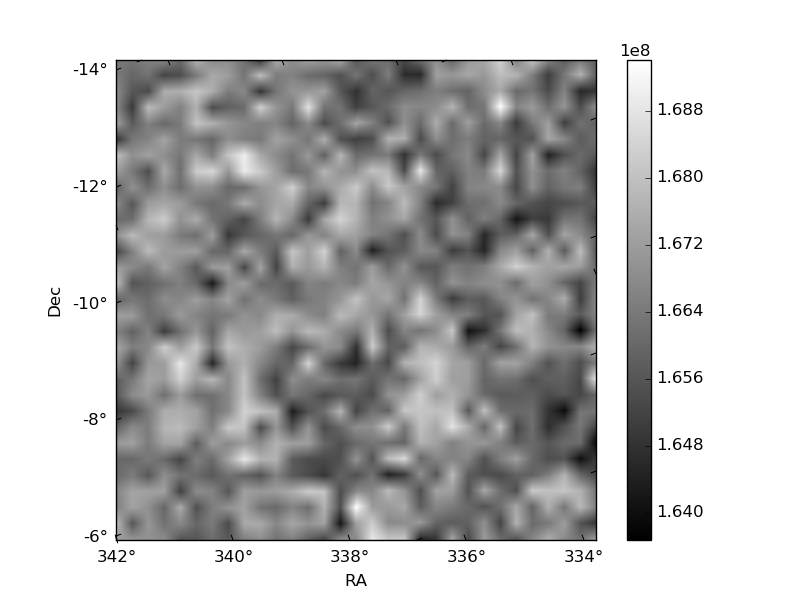
Quadrant B |
|---|---|---|---|
| Quadrant D | 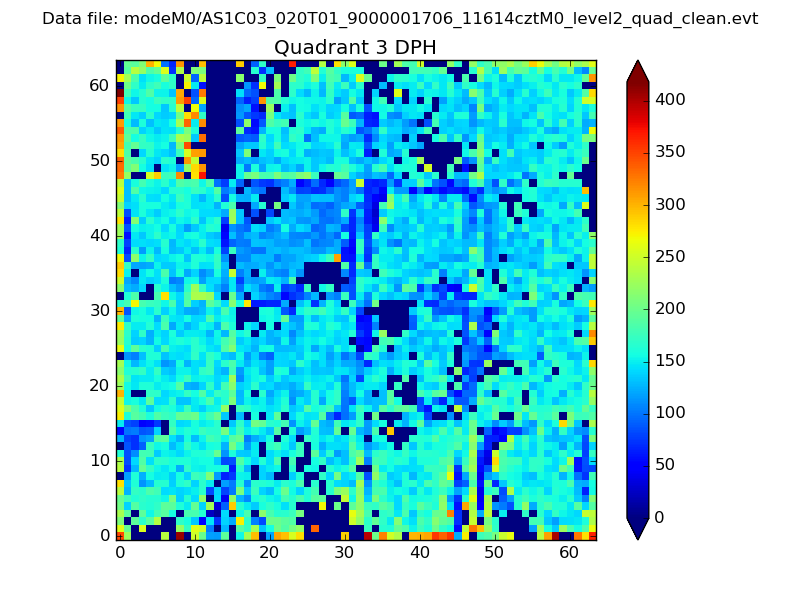 |
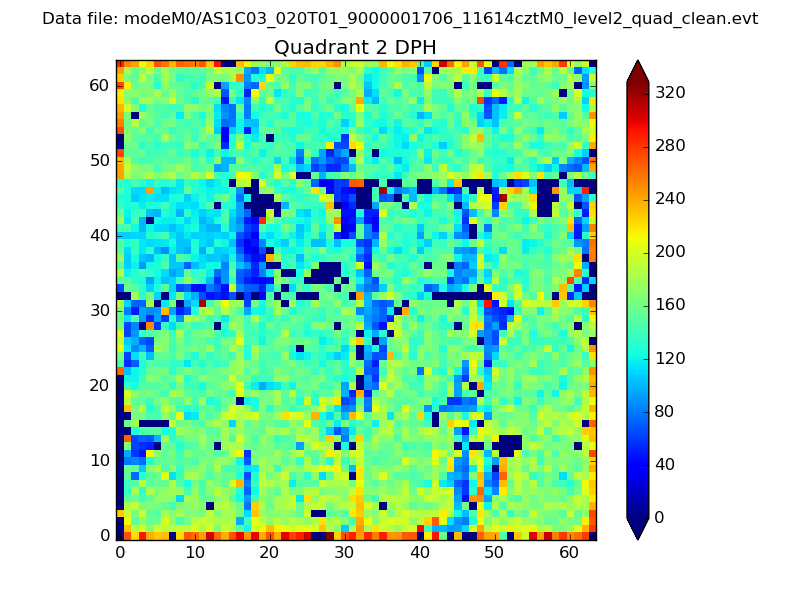 |
Quadrant C |
| Plot type | Count rate plots | Images |
|---|---|---|
| Comparison with Poisson distribution Blue bars denote a histogram of data divided into 1 sec bins. Red curve is a Poisson curve with rate = median count rate of data. |
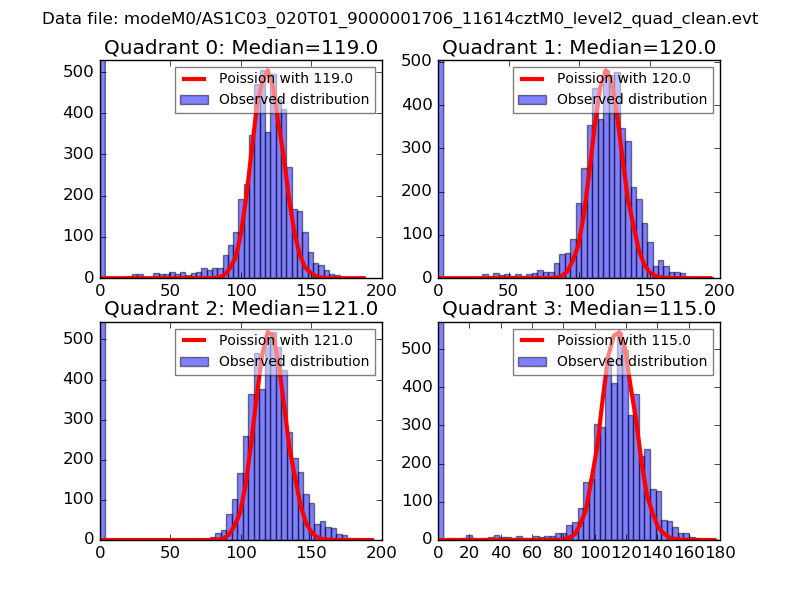 |
 |
| Quadrant-wise count rates Data is divided into 100 sec bins |
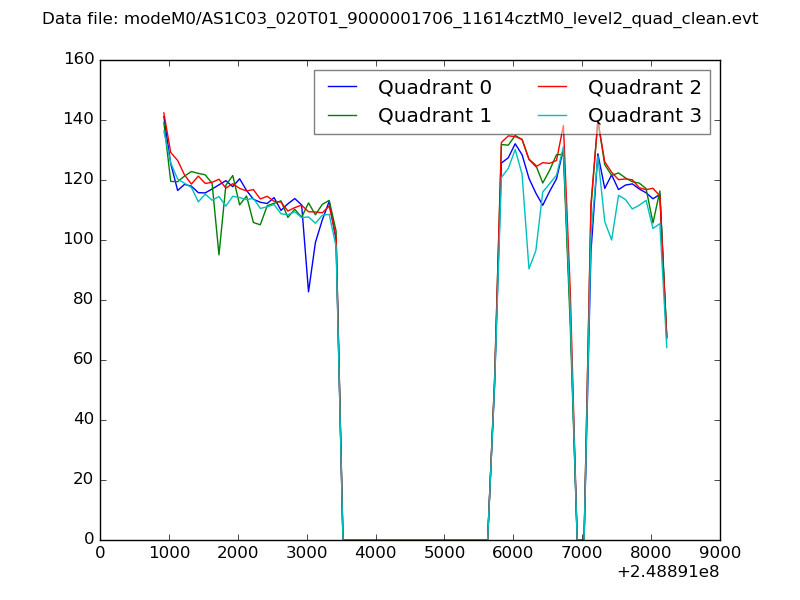 |
|
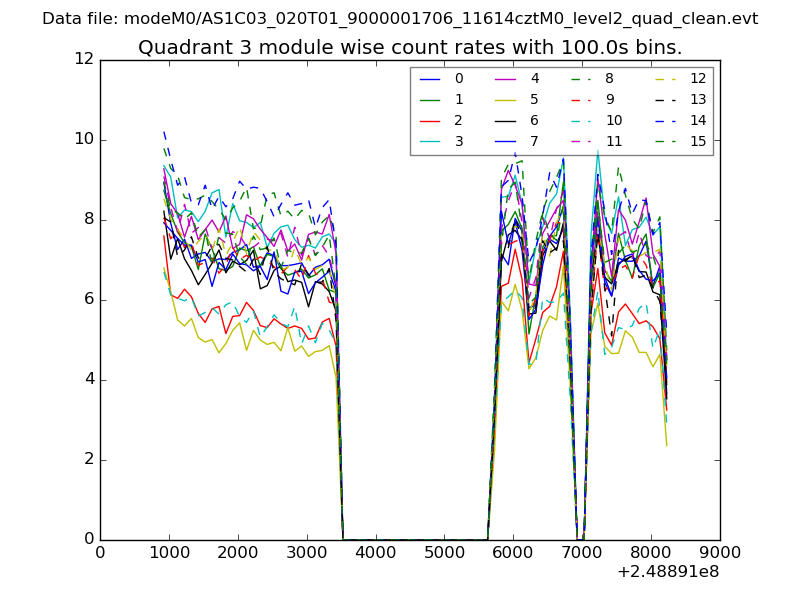
| Module-wise count rates for Quadrant A Data is divided into 100 sec bins |
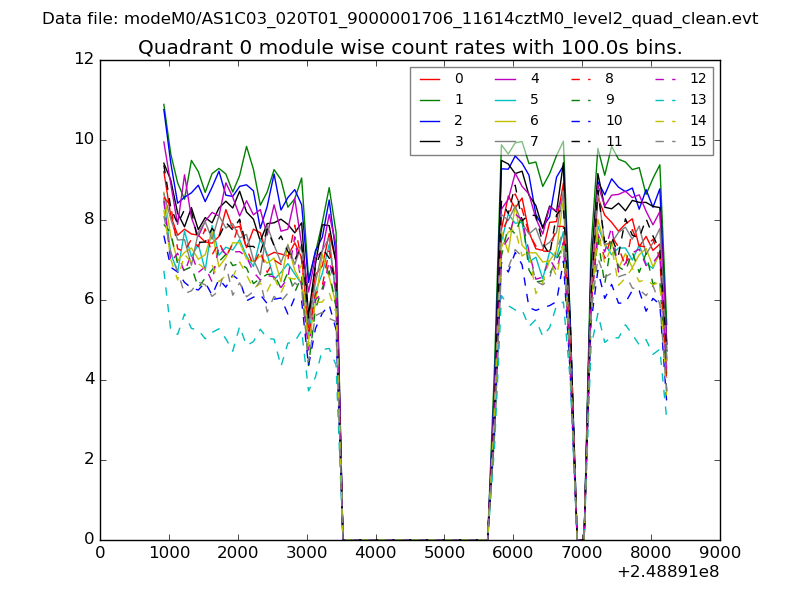 |
 |
| Module-wise count rates for Quadrant B Data is divided into 100 sec bins |
 |
 |
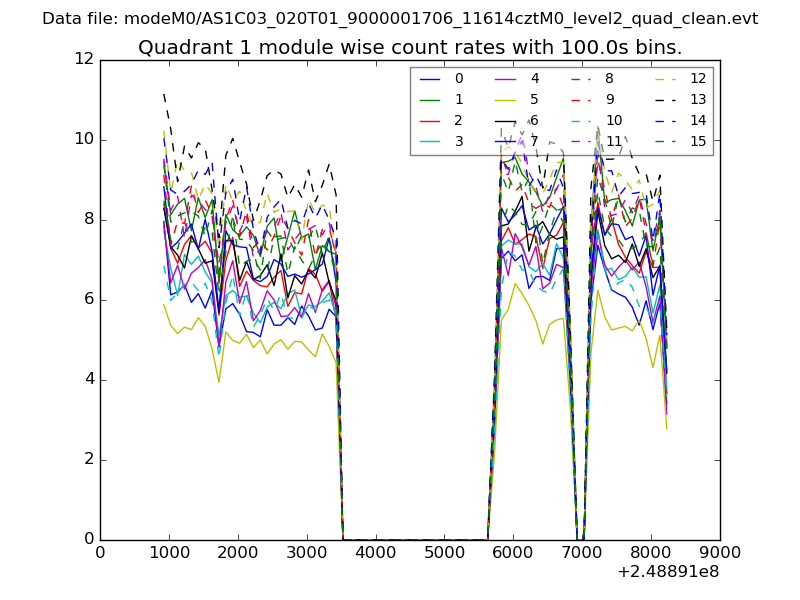
| Module-wise count rates for Quadrant C Data is divided into 100 sec bins |
 |
 |
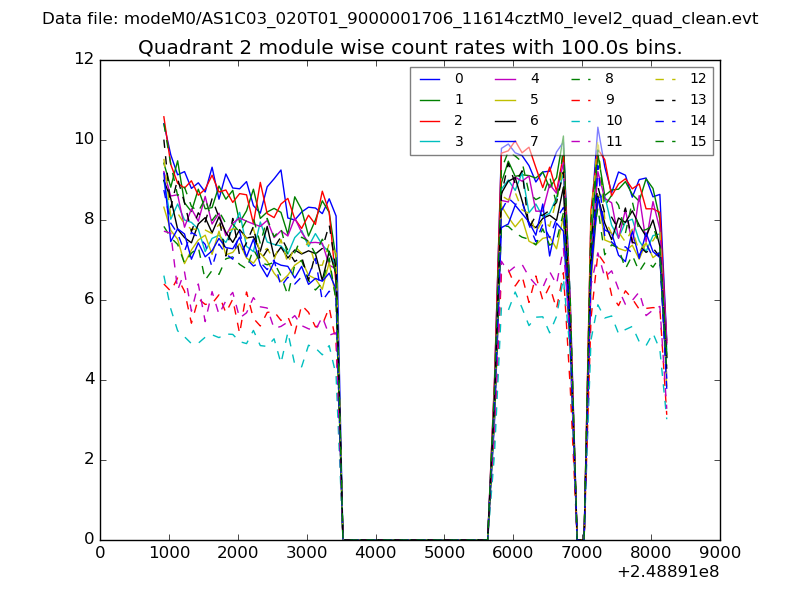
| Module-wise count rates for Quadrant D Data is divided into 100 sec bins |
 |
 |
| Parameter | Plot |
|---|---|
| CZT HV Monitor | 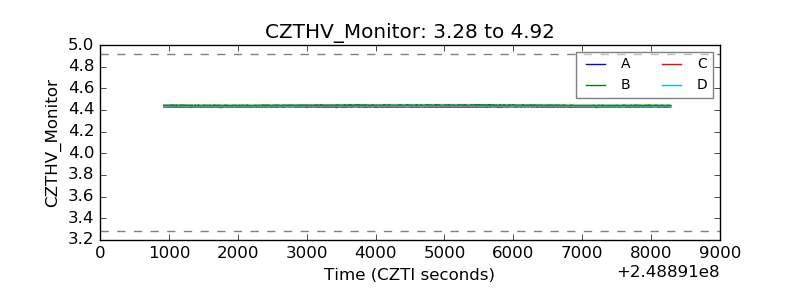 |
| D_VDD | 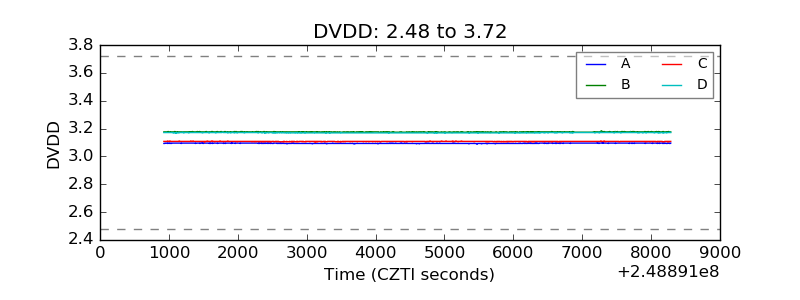 |
| Temperature 1 | 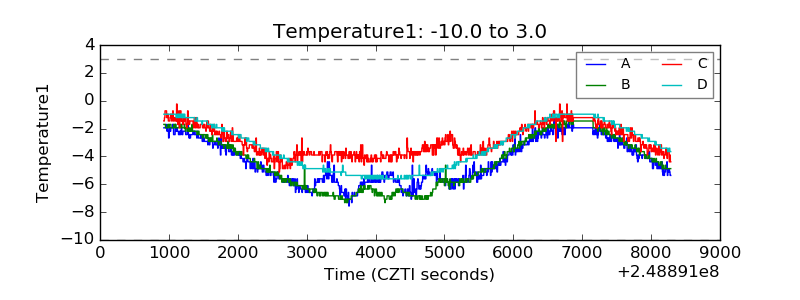 |
| Veto HV Monitor | 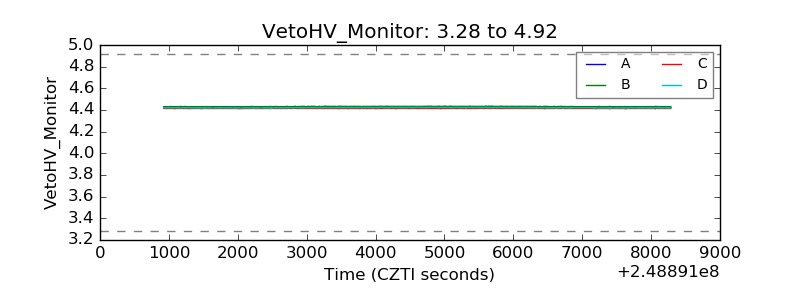 |
| Veto LLD | 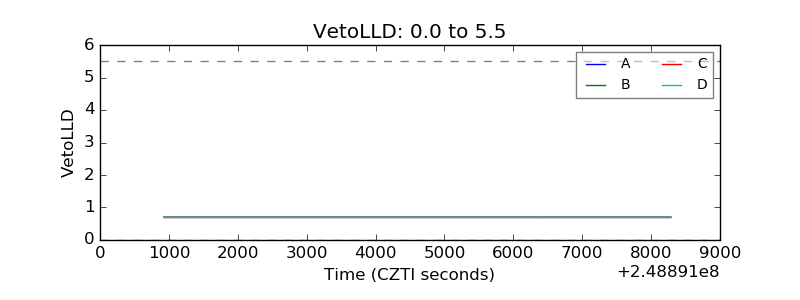 |
| Alpha Counter | 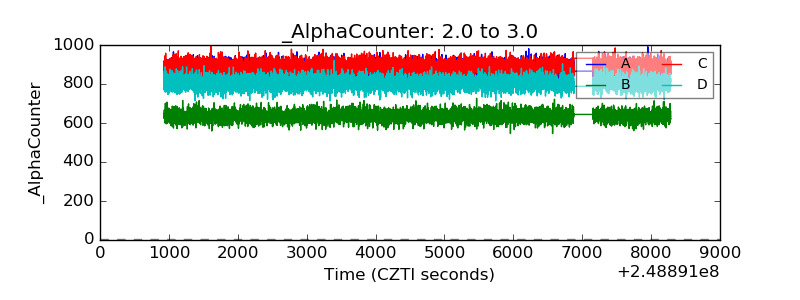 |
| _CPM_Rate | 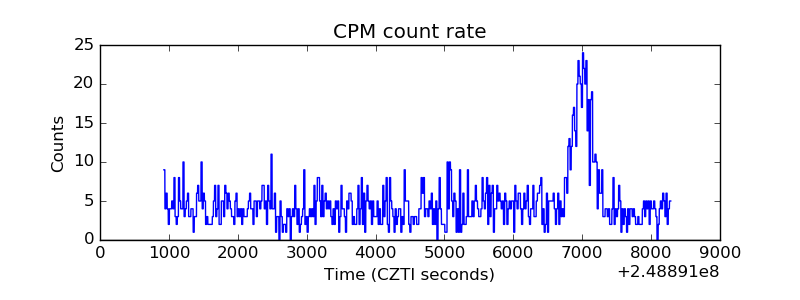 |
| CZT Counter | 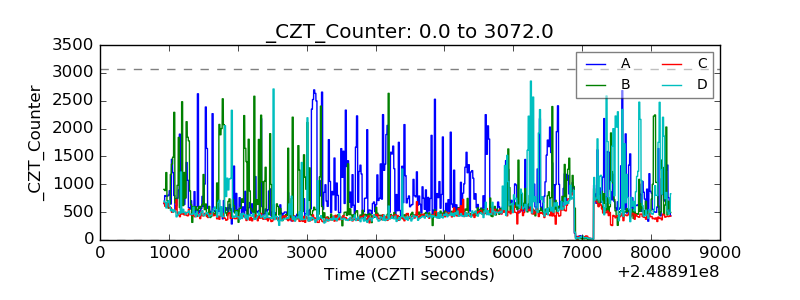 |
| +2.5 Volts monitor |  |
| +5 Volts monitor |  |
| _ROLL_ROT | 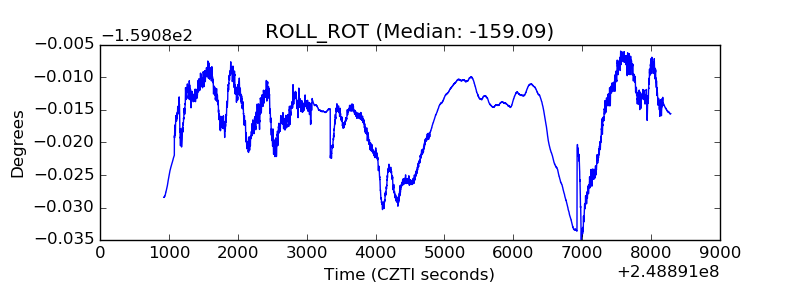 |
| _Roll_DEC | 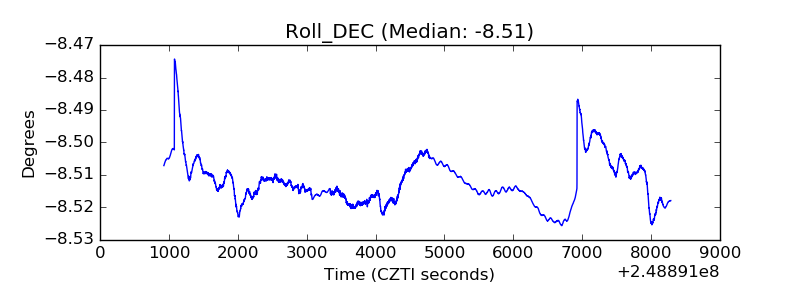 |
| _Roll_RA | 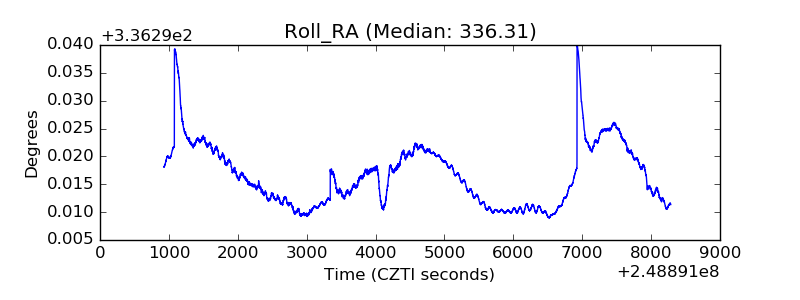 |
| Veto Counter | 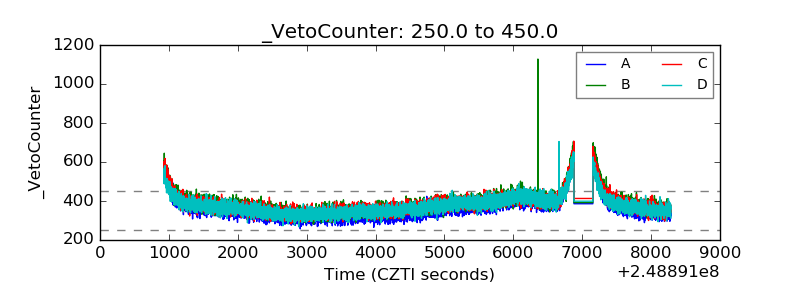 |