| Param | Original file | Final file |
|---|---|---|
| Filename | modeM0/AS1A04_198T01_9000001708cztM0_level2.fits | modeM0/AS1A04_198T01_9000001708cztM0_level2_quad_clean.evt |
| Size (bytes) | 745,254,720 | 722,376,000 |
| Size | 710.7 MB | 688.9 MB |
| Events in quadrant A | 4,361,426 | 4,185,998 |
| Events in quadrant B | 4,422,428 | 4,360,909 |
| Events in quadrant C | 4,583,264 | 4,235,506 |
| Events in quadrant D | 3,670,394 | 3,570,023 |
| Mode SS | |||
|---|---|---|---|
| Quadrant | BADHDUFLAG | Total packets | Discarded packets |
| A | 0 | 1642 | 0 |
| B | 0 | 1642 | 0 |
| C | 0 | 1642 | 0 |
| D | 0 | 1642 | 0 |
| Mode M0 | |||
|---|---|---|---|
| Quadrant | BADHDUFLAG | Total packets | Discarded packets |
| A | 0 | 256043 | 0 |
| B | 0 | 191848 | 0 |
| C | 0 | 165478 | 0 |
| D | 0 | 246632 | 0 |
| Mode M9 | |||
|---|---|---|---|
| Quadrant | BADHDUFLAG | Total packets | Discarded packets |
| A | 0 | 120 | 0 |
| B | 0 | 120 | 0 |
| C | 0 | 120 | 0 |
| D | 0 | 120 | 0 |
| Quadrant | Total seconds | Saturated seconds | Saturation percentage |
|---|---|---|---|
| A | 80571 | 8200 | 10.177359% |
| B | 80571 | 2720 | 3.375904% |
| C | 80571 | 637 | 0.790607% |
| D | 80571 | 9905 | 12.293505% |
Noise dominated data is calculated using 1-second bins in cleaned event files. If a bin has >2000 counts, and if more than 50% of those come from <1% of pixels, then it is considered to be noise-dominated and hence unusable.
| Quadrant | # 1 sec bins | Bins with >0 counts | Bins with >2000 counts | High rate bins dominated by noise | Noise dominated (total time) | Noise dominated (detector-on time) | Marked lightcurve |
|---|---|---|---|---|---|---|---|
| A | 92532 | 80525 | 0 | 0 | 0.00% | 0.00% |  |
| B | 92532 | 80571 | 0 | 0 | 0.00% | 0.00% |  |
| C | 92532 | 80571 | 0 | 0 | 0.00% | 0.00% |  |
| D | 92532 | 80078 | 0 | 0 | 0.00% | 0.00% |  |
Top three noisy pixels from each quadrant. If the there are fewer than three noisy pixels in the level2.evt file, extra rows are filled as -1
| Pixel properties | Quadrant properties | ||||||
|---|---|---|---|---|---|---|---|
| Quadrant | DetID | PixID | Counts | Sigma | Mean | Median | Sigma |
| A | 0 | 29 | 4201 | 10.96 | 1137 | 1061 | 286.6 |
| A | 7 | 110 | 3503 | 8.52 | 1137 | 1061 | 286.6 |
| A | 9 | 19 | 3331 | 7.92 | 1137 | 1061 | 286.6 |
| B | 2 | 9 | 3927 | 12.3 | 1166 | 1110 | 229.1 |
| B | 14 | 254 | 2916 | 7.88 | 1166 | 1110 | 229.1 |
| B | 3 | 17 | 2909 | 7.85 | 1166 | 1110 | 229.1 |
| C | 1 | 81 | 3368 | 7.15 | 1209 | 1125 | 313.6 |
| C | 1 | 80 | 3357 | 7.12 | 1209 | 1125 | 313.6 |
| C | 12 | 241 | 3209 | 6.64 | 1209 | 1125 | 313.6 |
| D | 3 | 14 | 2657 | 6.12 | 1045 | 948 | 279.2 |
| D | 6 | 231 | 2612 | 5.96 | 1045 | 948 | 279.2 |
| D | 10 | 189 | 2588 | 5.87 | 1045 | 948 | 279.2 |
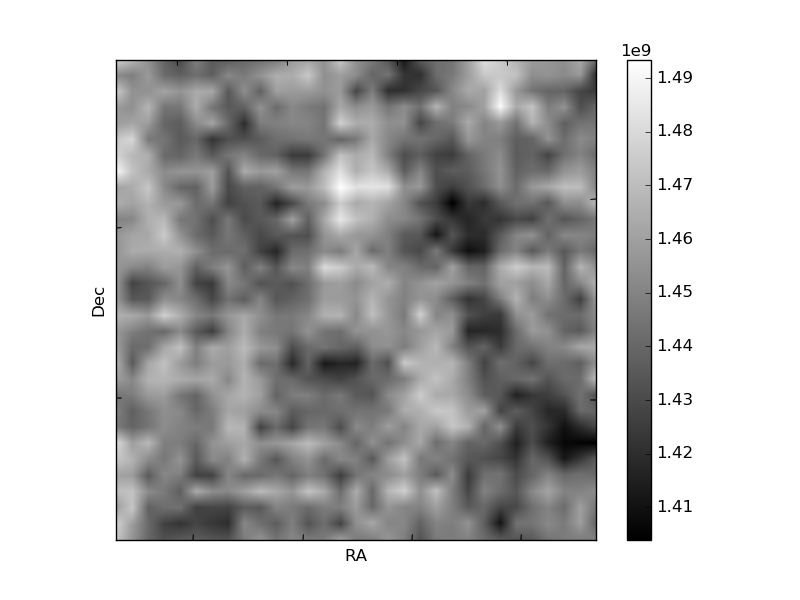
Histogram calculated using DETX and DETY for each event in the final _common_clean file
| Quadrant A | 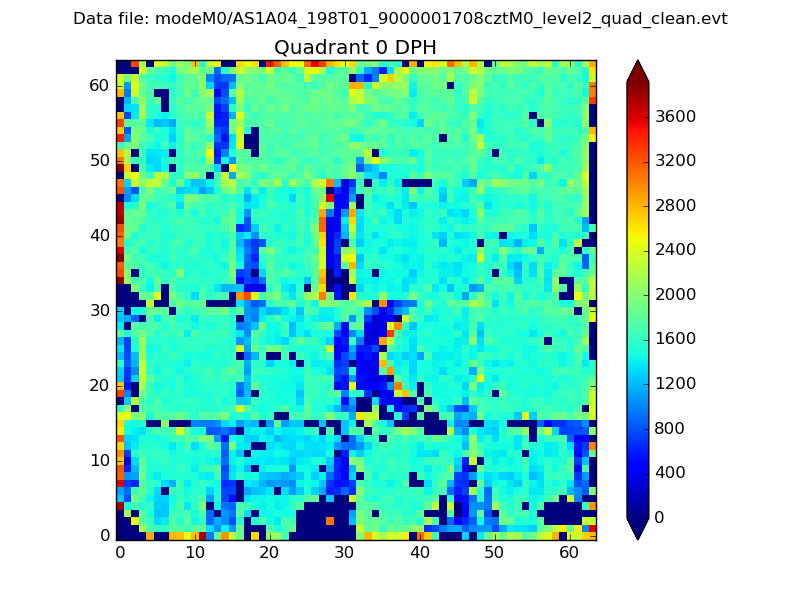 |
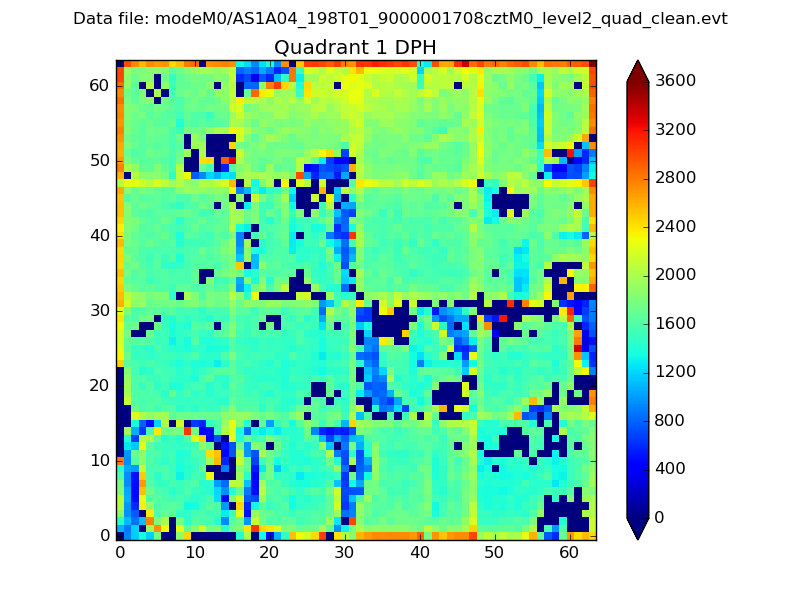 |
Quadrant B |
|---|---|---|---|
| Quadrant D | 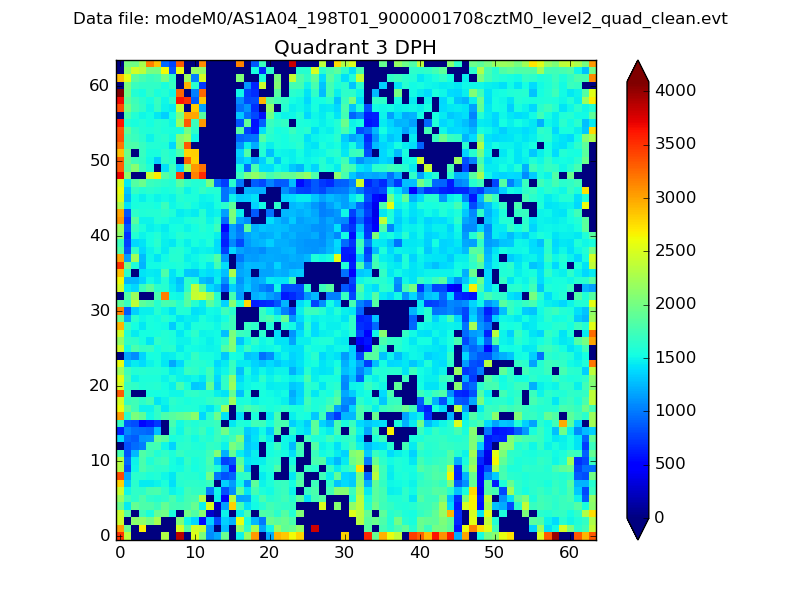 |
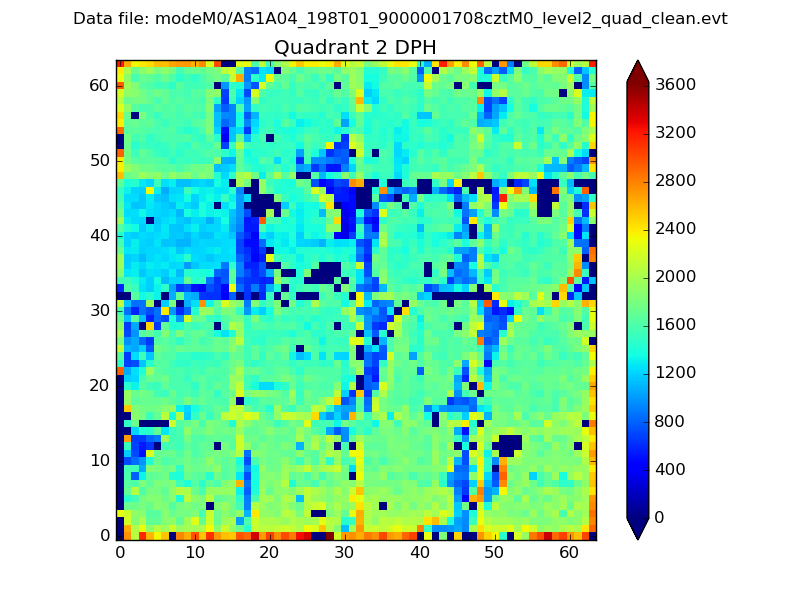 |
Quadrant C |
| Plot type | Count rate plots | Images |
|---|---|---|
| Comparison with Poisson distribution Blue bars denote a histogram of data divided into 1 sec bins. Red curve is a Poisson curve with rate = median count rate of data. |
 |
 |
| Quadrant-wise count rates Data is divided into 100 sec bins |
 |
|
| Module-wise count rates for Quadrant A Data is divided into 100 sec bins |
 |
 |
| Module-wise count rates for Quadrant B Data is divided into 100 sec bins |
 |
 |
| Module-wise count rates for Quadrant C Data is divided into 100 sec bins |
 |
 |
| Module-wise count rates for Quadrant D Data is divided into 100 sec bins |
 |
 |
| Parameter | Plot |
|---|---|
| CZT HV Monitor |  |
| D_VDD | 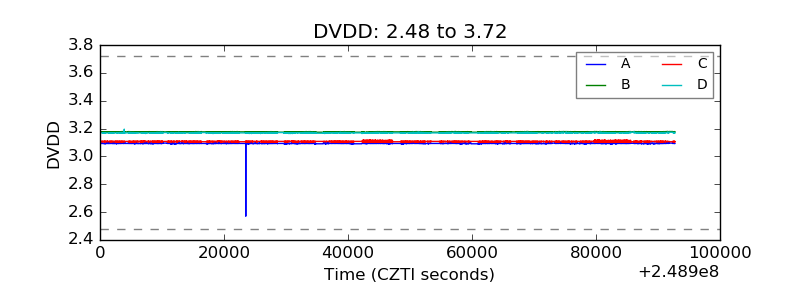 |
| Temperature 1 |  |
| Veto HV Monitor |  |
| Veto LLD |  |
| Alpha Counter |  |
| _CPM_Rate | 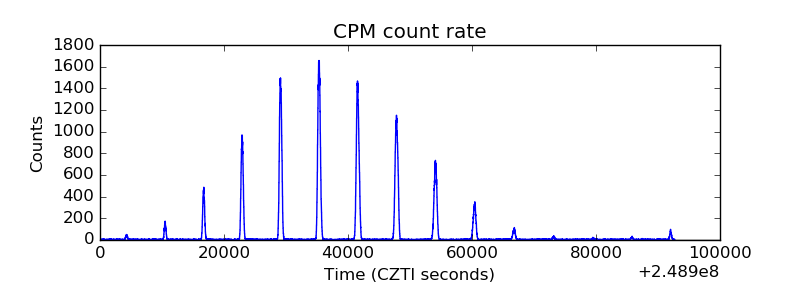 |
| CZT Counter |  |
| +2.5 Volts monitor |  |
| +5 Volts monitor |  |
| _ROLL_ROT |  |
| _Roll_DEC |  |
| _Roll_RA |  |
| Veto Counter |  |