| Param | Original file | Final file |
|---|---|---|
| Filename | modeM0/AS1A04_198T01_9000001708_11617cztM0_level2.evt | modeM0/AS1A04_198T01_9000001708_11617cztM0_level2_quad_clean.evt |
| Size (bytes) | 516,214,080 | 94,386,240 |
| Size | 492.3 MB | 90.0 MB |
| Events in quadrant A | 4,851,834 | 593,114 |
| Events in quadrant B | 3,428,441 | 613,644 |
| Events in quadrant C | 3,095,370 | 597,399 |
| Events in quadrant D | 3,789,922 | 573,572 |
| Mode SS | |||
|---|---|---|---|
| Quadrant | BADHDUFLAG | Total packets | Discarded packets |
| A | 0 | 140 | 0 |
| B | 0 | 140 | 0 |
| C | 0 | 140 | 0 |
| D | 0 | 140 | 0 |
| Mode M0 | |||
|---|---|---|---|
| Quadrant | BADHDUFLAG | Total packets | Discarded packets |
| A | 0 | 18984 | 3 |
| B | 0 | 14684 | 2 |
| C | 0 | 13972 | 2 |
| D | 0 | 16095 | 2 |
| Mode M9 | |||
|---|---|---|---|
| Quadrant | BADHDUFLAG | Total packets | Discarded packets |
| A | 0 | 18 | 0 |
| B | 0 | 18 | 0 |
| C | 0 | 18 | 0 |
| D | 0 | 18 | 0 |
| Quadrant | Total seconds | Saturated seconds | Saturation percentage |
|---|---|---|---|
| A | 6902 | 399 | 5.780933% |
| B | 6902 | 69 | 0.999710% |
| C | 6902 | 25 | 0.362214% |
| D | 6902 | 85 | 1.231527% |
Noise dominated data is calculated using 1-second bins in cleaned event files. If a bin has >2000 counts, and if more than 50% of those come from <1% of pixels, then it is considered to be noise-dominated and hence unusable.
| Quadrant | # 1 sec bins | Bins with >0 counts | Bins with >2000 counts | High rate bins dominated by noise | Noise dominated (total time) | Noise dominated (detector-on time) | Marked lightcurve |
|---|---|---|---|---|---|---|---|
| A | 8584 | 6905 | 180 | 180 | 2.10% | 2.61% | 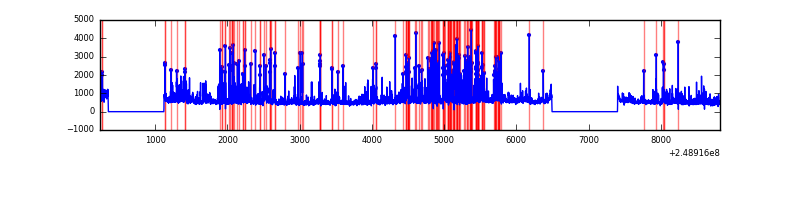 |
| B | 8584 | 6905 | 14 | 14 | 0.16% | 0.20% | 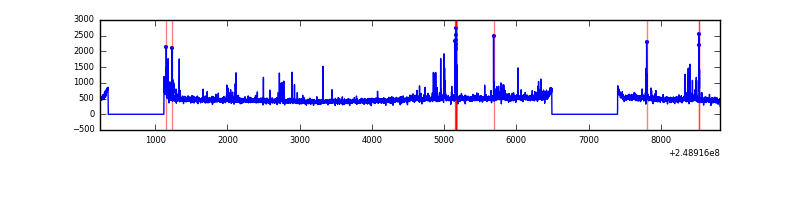 |
| C | 8584 | 6905 | 0 | 0 | 0.00% | 0.00% | 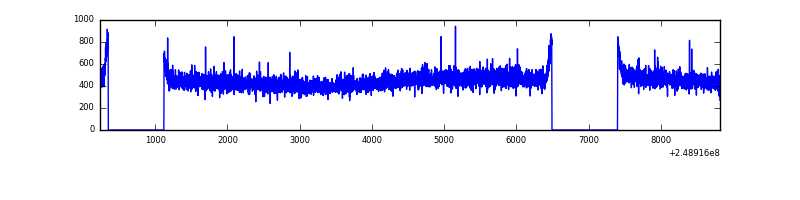 |
| D | 8584 | 6905 | 38 | 38 | 0.44% | 0.55% | 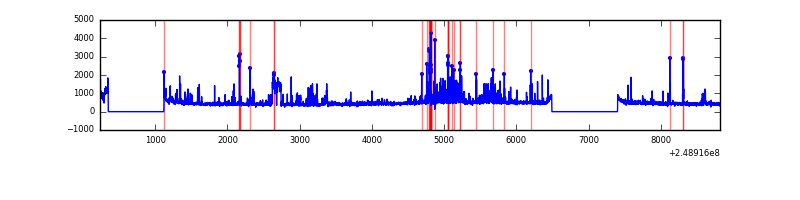 |
Top three noisy pixels from each quadrant. If the there are fewer than three noisy pixels in the level2.evt file, extra rows are filled as -1
| Pixel properties | Quadrant properties | ||||||
|---|---|---|---|---|---|---|---|
| Quadrant | DetID | PixID | Counts | Sigma | Mean | Median | Sigma |
| A | 8 | 5 | 1365225 | 8423.69 | 791 | 772 | 162.0 |
| A | 1 | 162 | 160215 | 984.35 | 791 | 772 | 162.0 |
| A | 1 | 178 | 90353 | 553.04 | 791 | 772 | 162.0 |
| B | 4 | 239 | 181839 | 1149.92 | 814 | 792 | 157.4 |
| B | 15 | 204 | 23113 | 141.77 | 814 | 792 | 157.4 |
| B | 0 | 214 | 20730 | 126.64 | 814 | 792 | 157.4 |
| C | 13 | 61 | 5738 | 26.75 | 793 | 796 | 184.7 |
| C | 14 | 67 | 1963 | 6.32 | 793 | 796 | 184.7 |
| C | 3 | 202 | 1927 | 6.12 | 793 | 796 | 184.7 |
| D | 1 | 52 | 367665 | 1962.17 | 779 | 758 | 187.0 |
| D | 13 | 104 | 291144 | 1552.94 | 779 | 758 | 187.0 |
| D | 2 | 136 | 48320 | 254.35 | 779 | 758 | 187.0 |
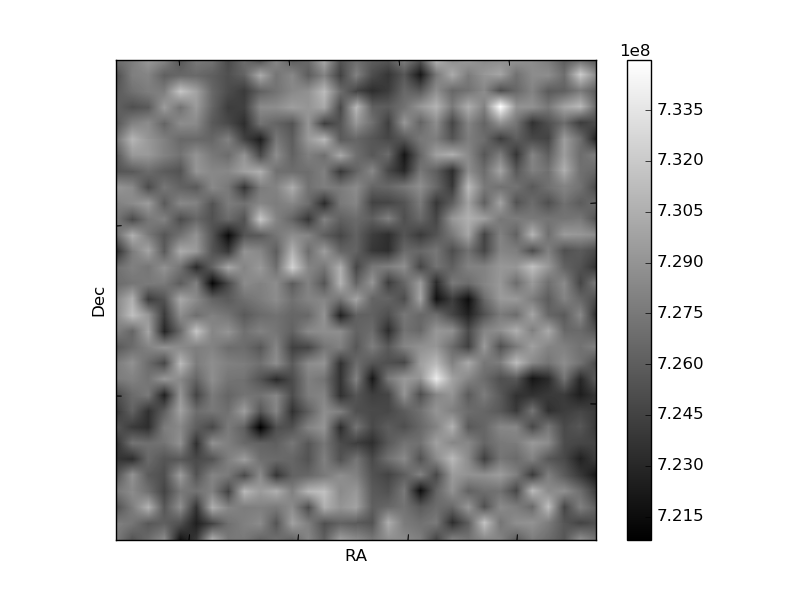
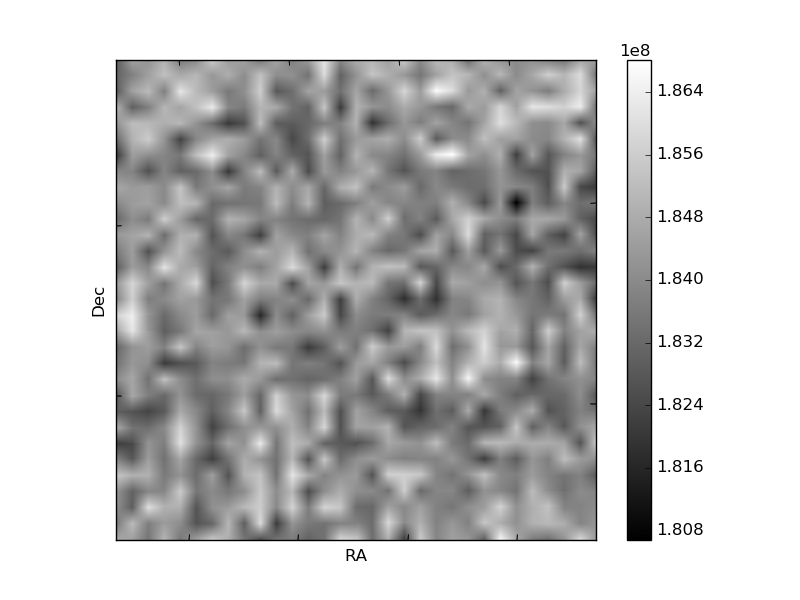
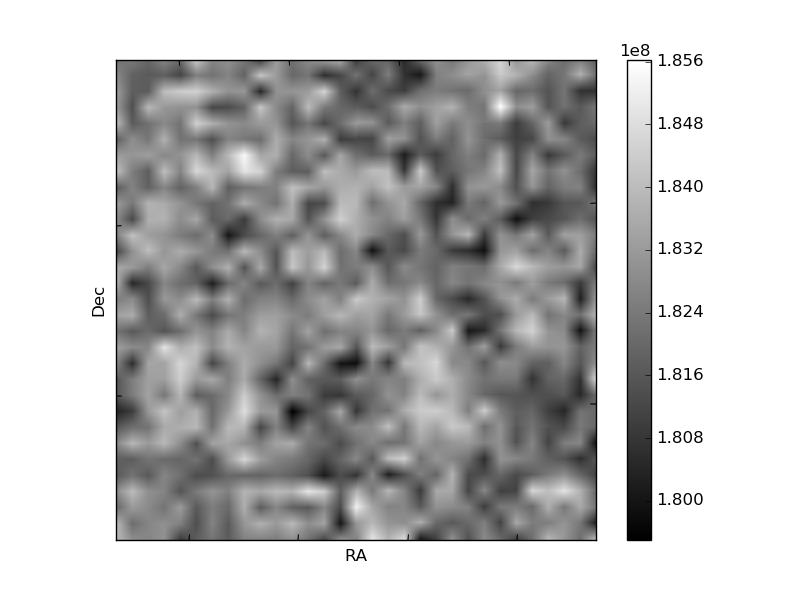
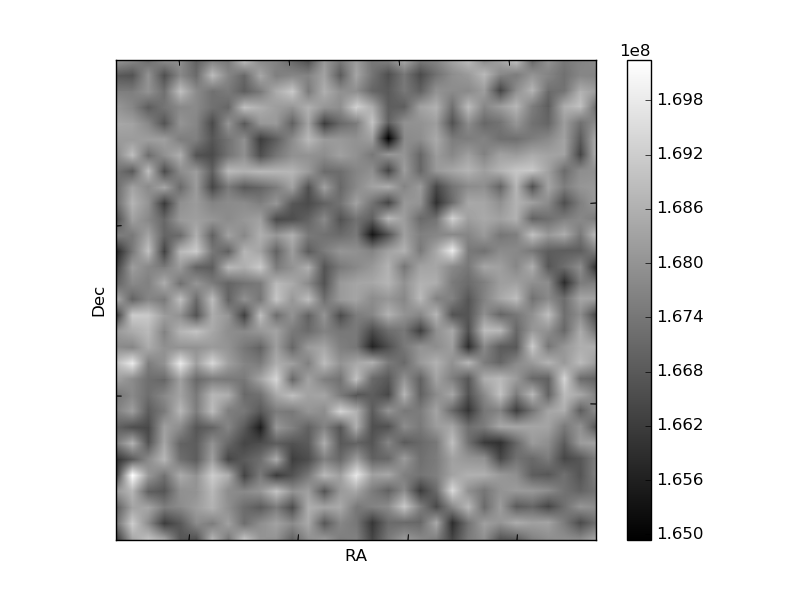
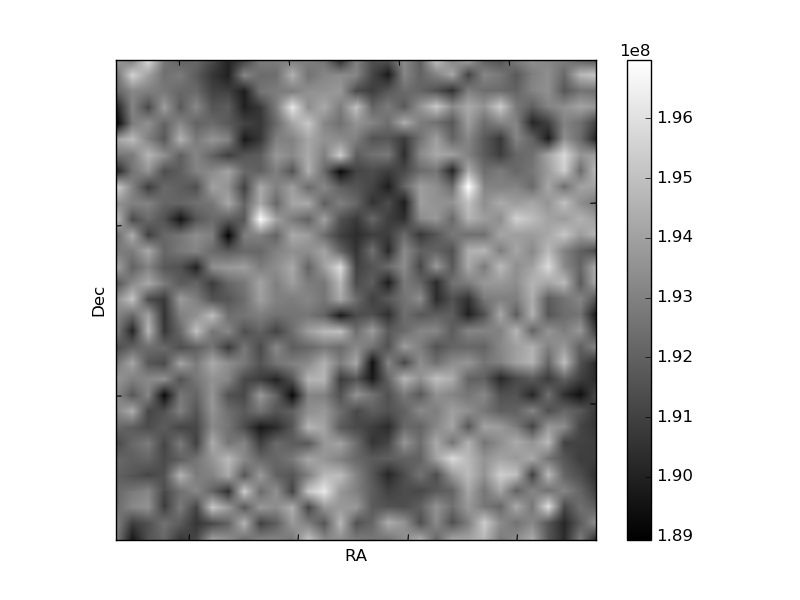
Histogram calculated using DETX and DETY for each event in the final _common_clean file
| Quadrant A | 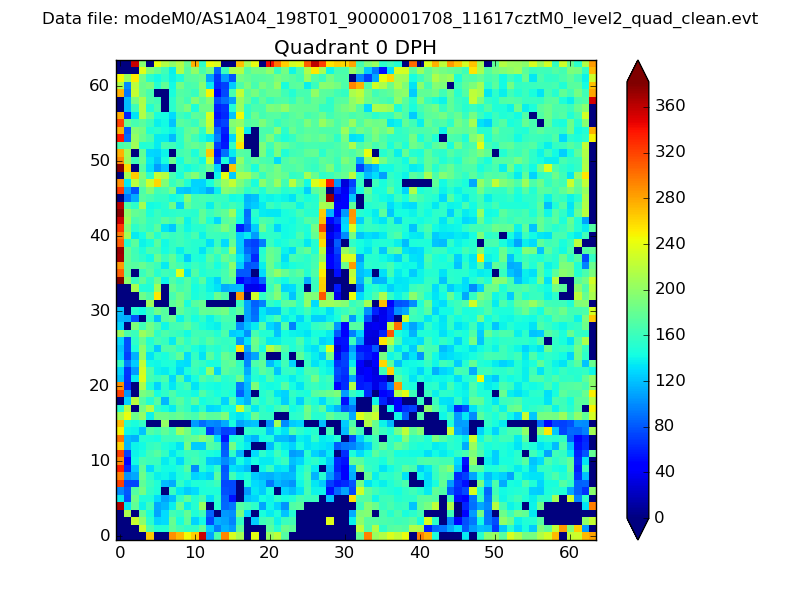 |
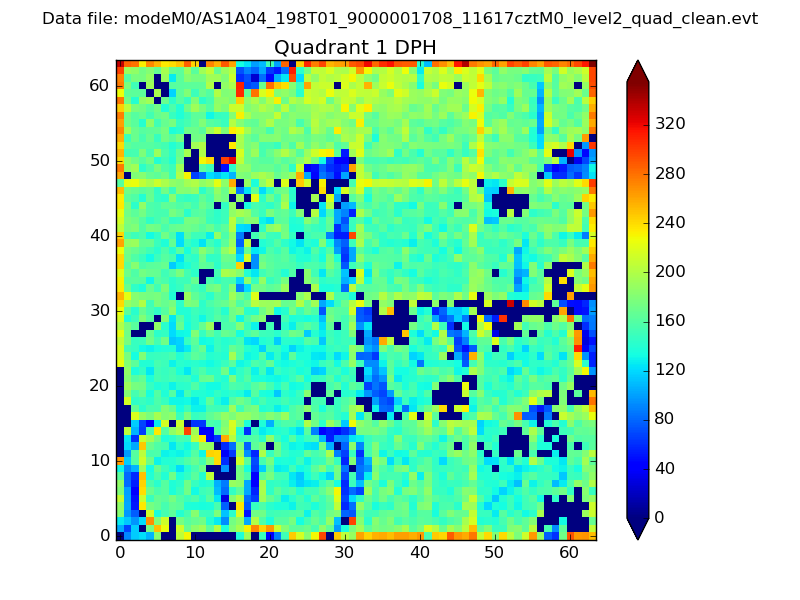 |
Quadrant B |
|---|---|---|---|
| Quadrant D | 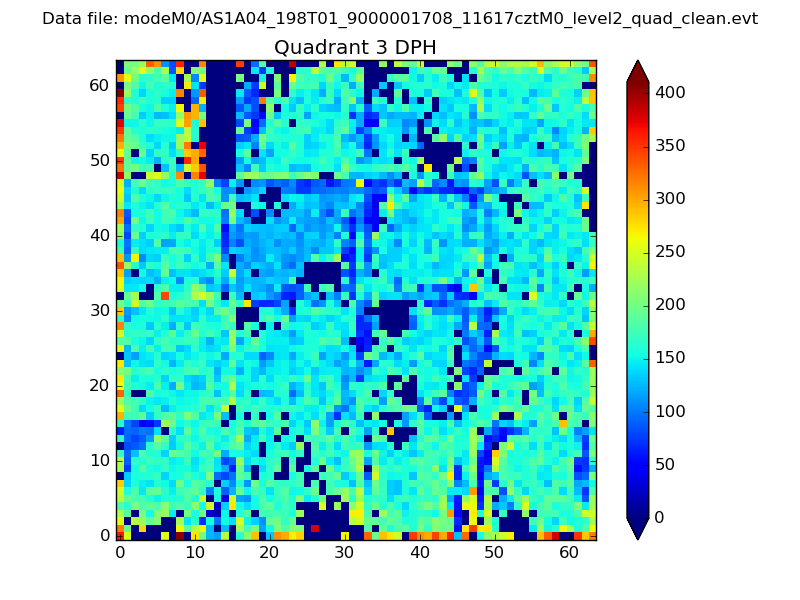 |
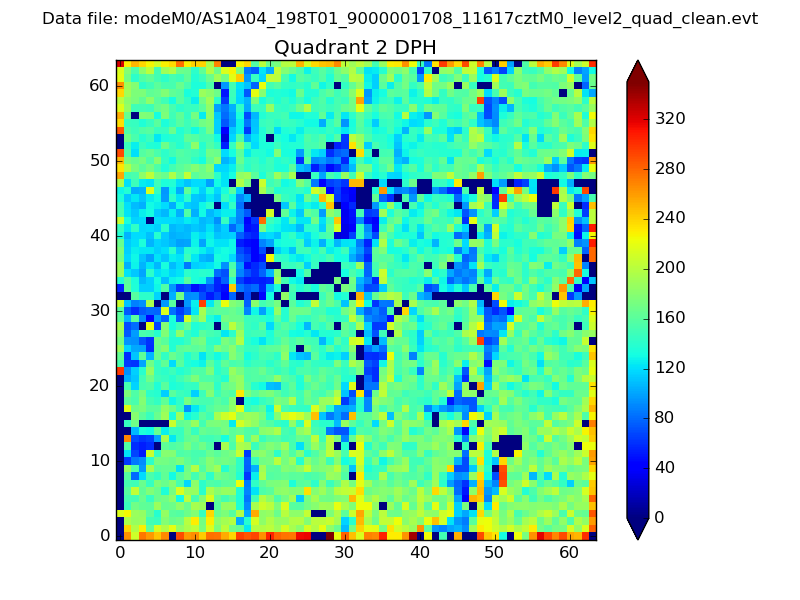 |
Quadrant C |
| Plot type | Count rate plots | Images |
|---|---|---|
| Comparison with Poisson distribution Blue bars denote a histogram of data divided into 1 sec bins. Red curve is a Poisson curve with rate = median count rate of data. |
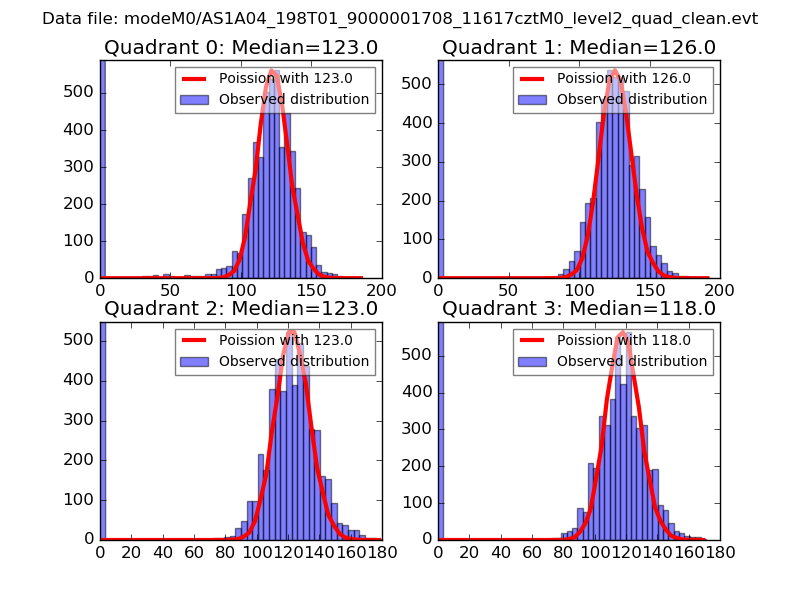 |
 |
| Quadrant-wise count rates Data is divided into 100 sec bins |
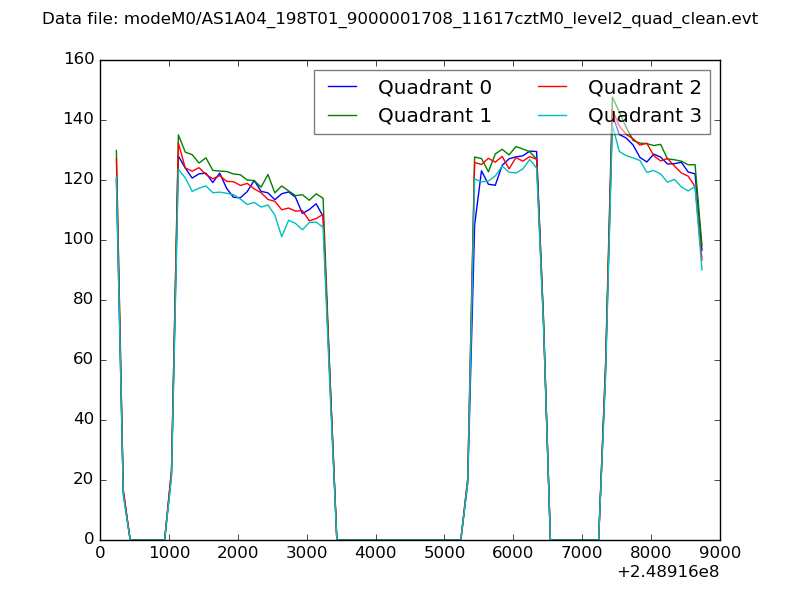 |
|
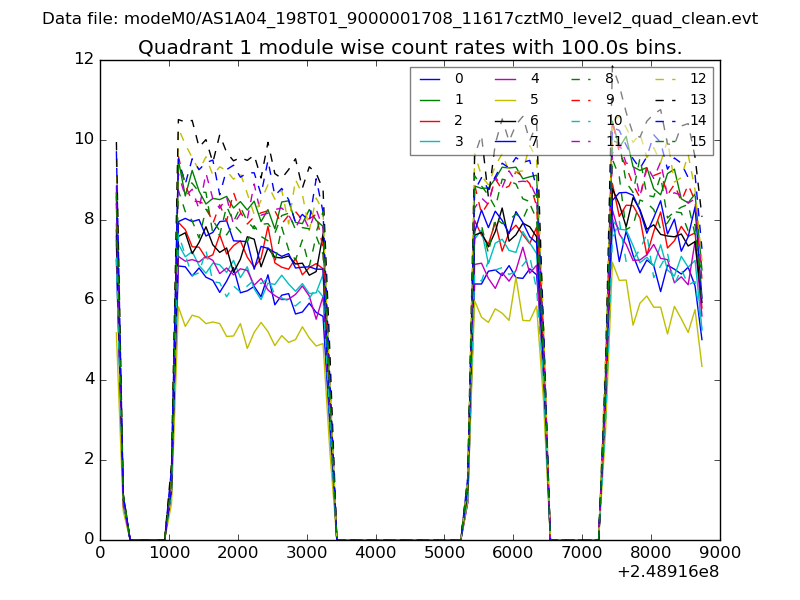
| Module-wise count rates for Quadrant A Data is divided into 100 sec bins |
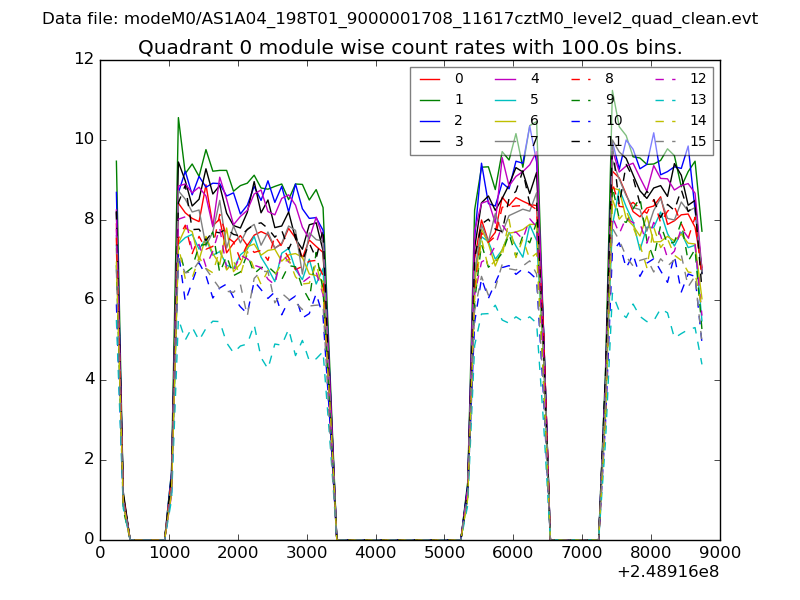 |
 |
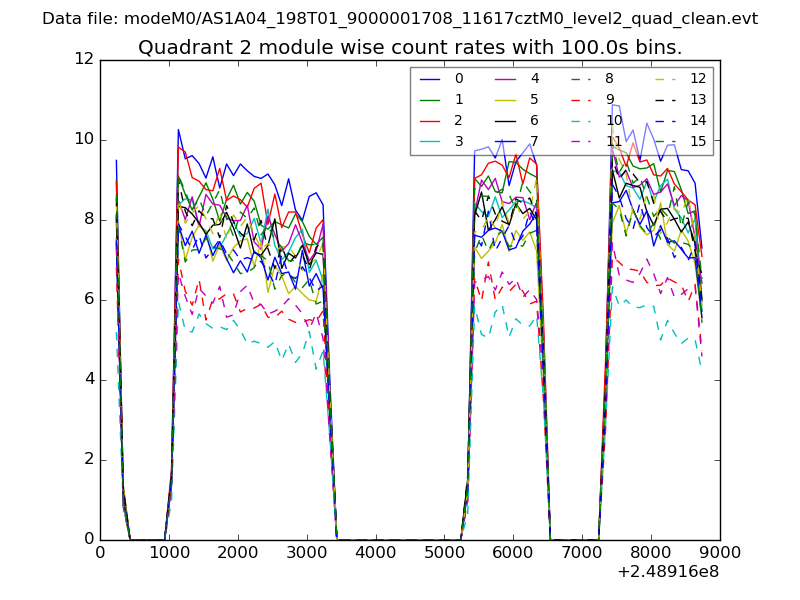
| Module-wise count rates for Quadrant B Data is divided into 100 sec bins |
 |
 |
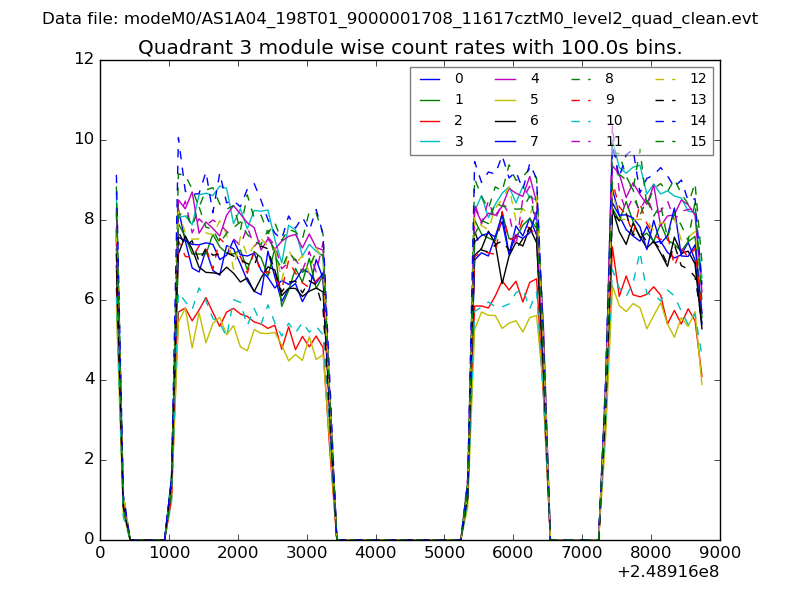
| Module-wise count rates for Quadrant C Data is divided into 100 sec bins |
 |
 |
| Module-wise count rates for Quadrant D Data is divided into 100 sec bins |
 |
 |
| Parameter | Plot |
|---|---|
| CZT HV Monitor | 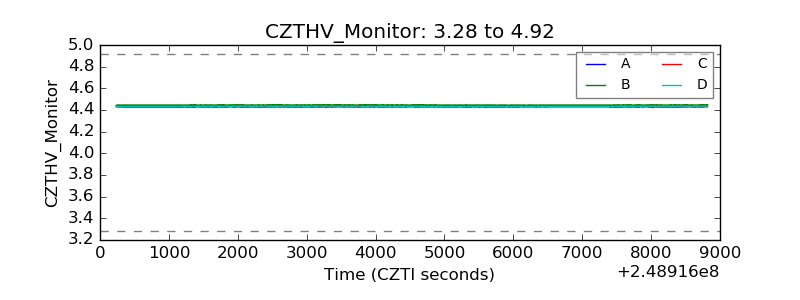 |
| D_VDD | 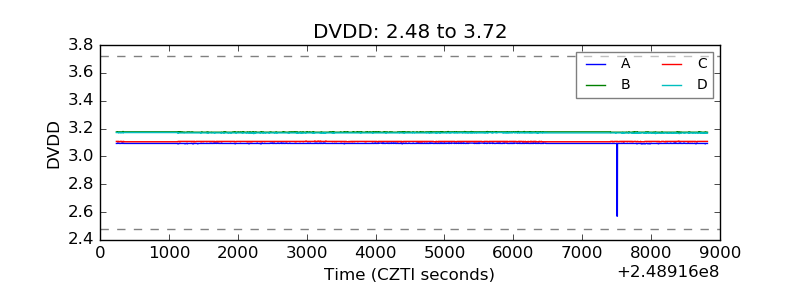 |
| Temperature 1 | 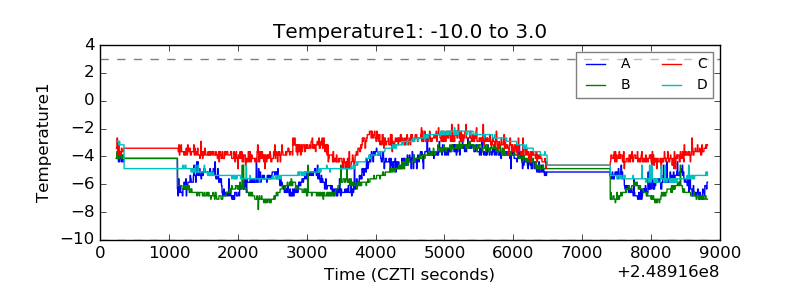 |
| Veto HV Monitor | 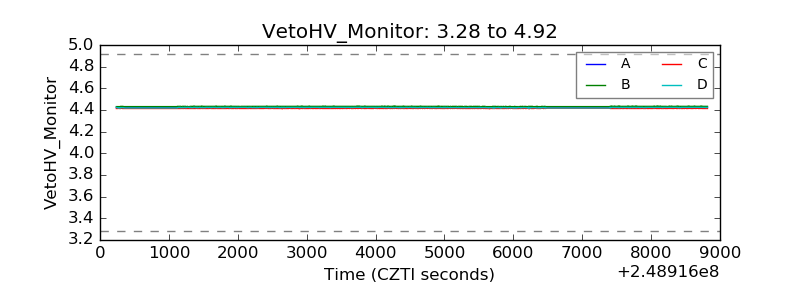 |
| Veto LLD | 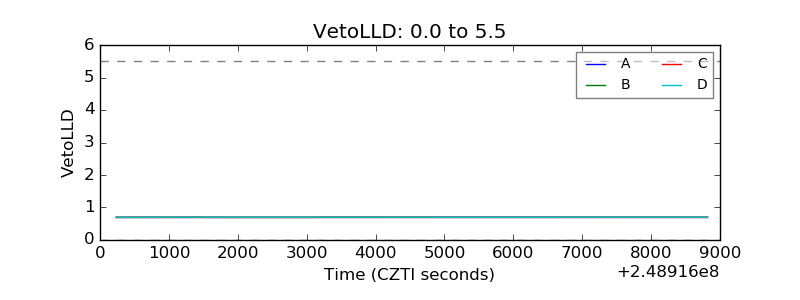 |
| Alpha Counter | 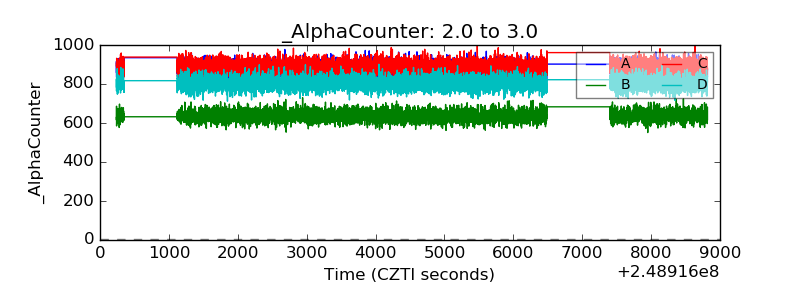 |
| _CPM_Rate | 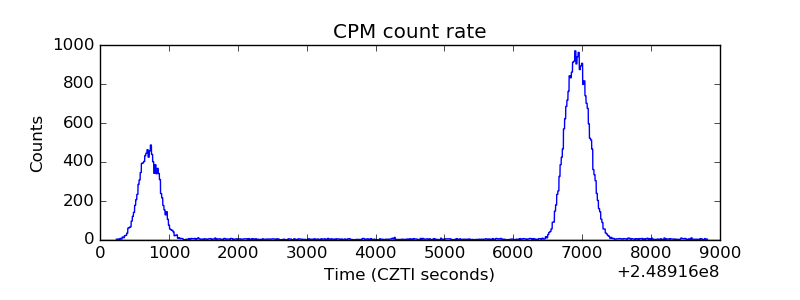 |
| CZT Counter | 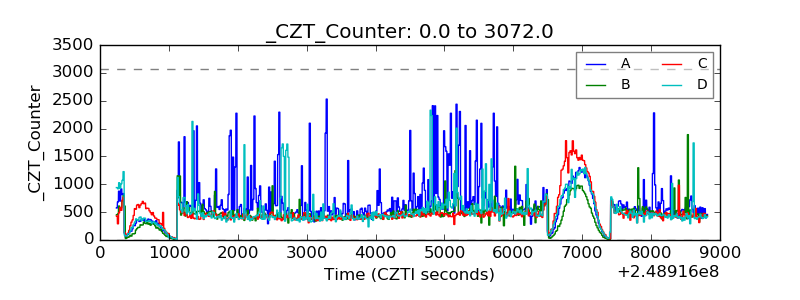 |
| +2.5 Volts monitor |  |
| +5 Volts monitor |  |
| _ROLL_ROT | 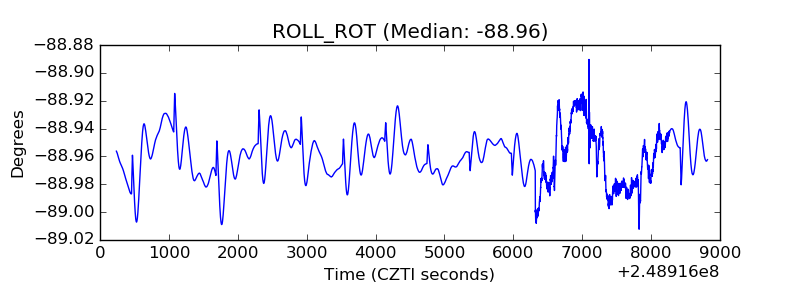 |
| _Roll_DEC | 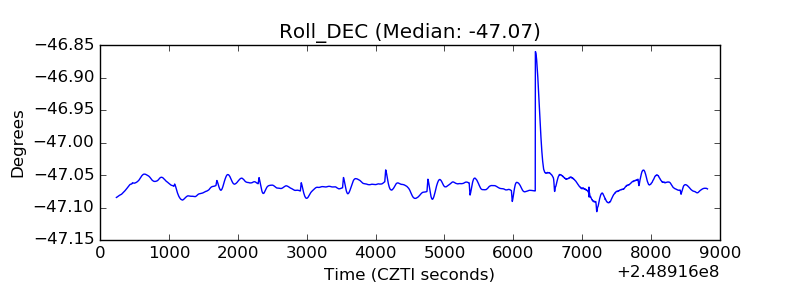 |
| _Roll_RA | 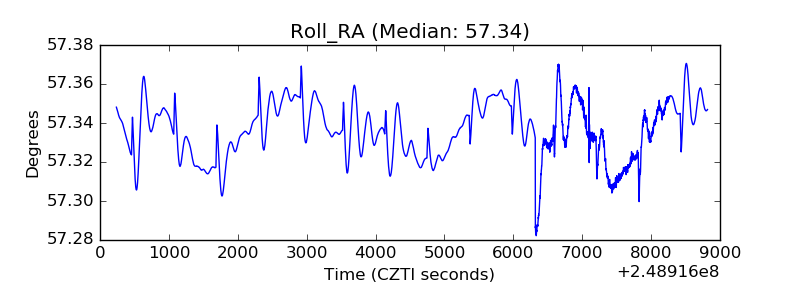 |
| Veto Counter | 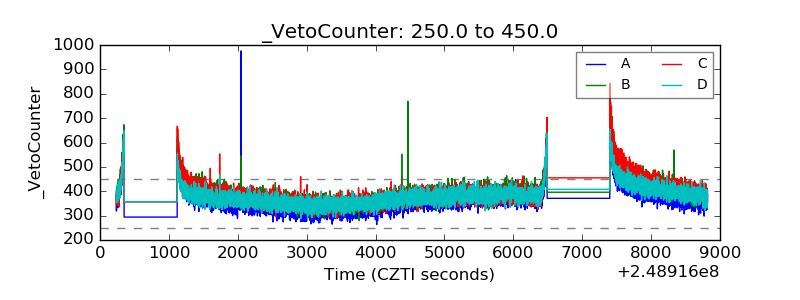 |