| Param | Original file | Final file |
|---|---|---|
| Filename | modeM0/AS1A04_198T01_9000001708_11620cztM0_level2.evt | modeM0/AS1A04_198T01_9000001708_11620cztM0_level2_quad_clean.evt |
| Size (bytes) | 643,219,200 | 92,185,920 |
| Size | 613.4 MB | 87.9 MB |
| Events in quadrant A | 4,144,750 | 600,900 |
| Events in quadrant B | 3,619,812 | 617,594 |
| Events in quadrant C | 3,144,430 | 613,651 |
| Events in quadrant D | 8,136,351 | 510,907 |
| Mode SS | |||
|---|---|---|---|
| Quadrant | BADHDUFLAG | Total packets | Discarded packets |
| A | 0 | 132 | 0 |
| B | 0 | 132 | 0 |
| C | 0 | 132 | 0 |
| D | 0 | 132 | 0 |
| Mode M0 | |||
|---|---|---|---|
| Quadrant | BADHDUFLAG | Total packets | Discarded packets |
| A | 0 | 16523 | 3 |
| B | 0 | 14743 | 2 |
| C | 0 | 13470 | 2 |
| D | 0 | 28621 | 2 |
| Mode M9 | |||
|---|---|---|---|
| Quadrant | BADHDUFLAG | Total packets | Discarded packets |
| A | 0 | 19 | 0 |
| B | 0 | 19 | 0 |
| C | 0 | 19 | 0 |
| D | 0 | 20 | 0 |
| Quadrant | Total seconds | Saturated seconds | Saturation percentage |
|---|---|---|---|
| A | 6416 | 202 | 3.148379% |
| B | 6416 | 203 | 3.163965% |
| C | 6416 | 85 | 1.324813% |
| D | 6416 | 1650 | 25.716958% |
Noise dominated data is calculated using 1-second bins in cleaned event files. If a bin has >2000 counts, and if more than 50% of those come from <1% of pixels, then it is considered to be noise-dominated and hence unusable.
| Quadrant | # 1 sec bins | Bins with >0 counts | Bins with >2000 counts | High rate bins dominated by noise | Noise dominated (total time) | Noise dominated (detector-on time) | Marked lightcurve |
|---|---|---|---|---|---|---|---|
| A | 7537 | 6418 | 45 | 45 | 0.60% | 0.70% | 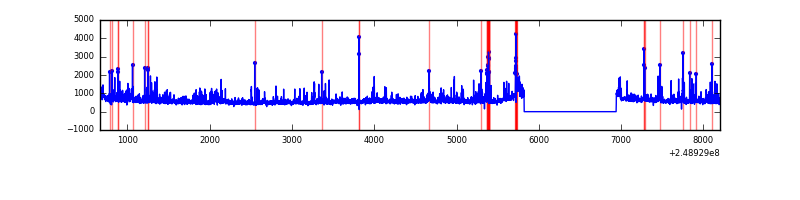 |
| B | 7537 | 6418 | 66 | 66 | 0.88% | 1.03% | 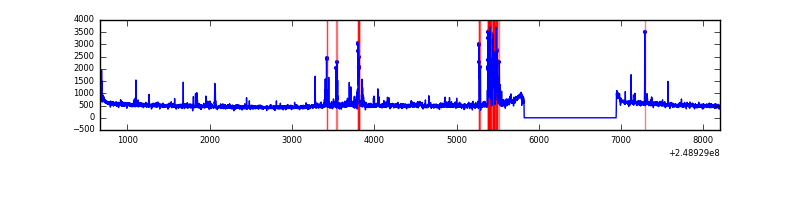 |
| C | 7537 | 6418 | 0 | 0 | 0.00% | 0.00% | 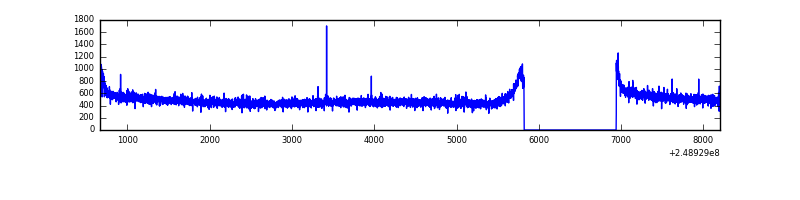 |
| D | 7537 | 6417 | 1401 | 1401 | 18.59% | 21.83% | 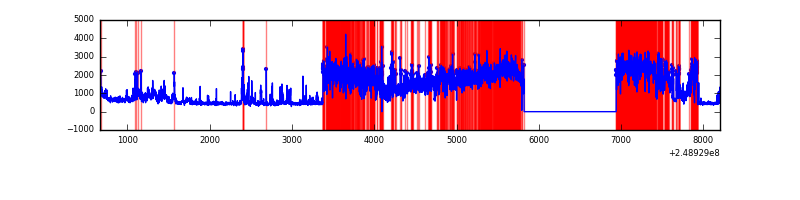 |
Top three noisy pixels from each quadrant. If the there are fewer than three noisy pixels in the level2.evt file, extra rows are filled as -1
| Pixel properties | Quadrant properties | ||||||
|---|---|---|---|---|---|---|---|
| Quadrant | DetID | PixID | Counts | Sigma | Mean | Median | Sigma |
| A | 8 | 5 | 630138 | 3802.03 | 813 | 799 | 165.5 |
| A | 1 | 162 | 133892 | 804.06 | 813 | 799 | 165.5 |
| A | 1 | 178 | 78468 | 469.22 | 813 | 799 | 165.5 |
| B | 4 | 239 | 357002 | 2328.98 | 809 | 793 | 152.9 |
| B | 11 | 51 | 53847 | 346.88 | 809 | 793 | 152.9 |
| B | 0 | 187 | 24581 | 155.53 | 809 | 793 | 152.9 |
| C | 13 | 61 | 6011 | 28.09 | 805 | 812 | 185.1 |
| C | 14 | 234 | 2963 | 11.62 | 805 | 812 | 185.1 |
| C | 9 | 54 | 2294 | 8.01 | 805 | 812 | 185.1 |
| D | 13 | 122 | 5078491 | 29919.69 | 718 | 701 | 169.7 |
| D | 1 | 52 | 74928 | 437.37 | 718 | 701 | 169.7 |
| D | 2 | 152 | 69717 | 406.66 | 718 | 701 | 169.7 |
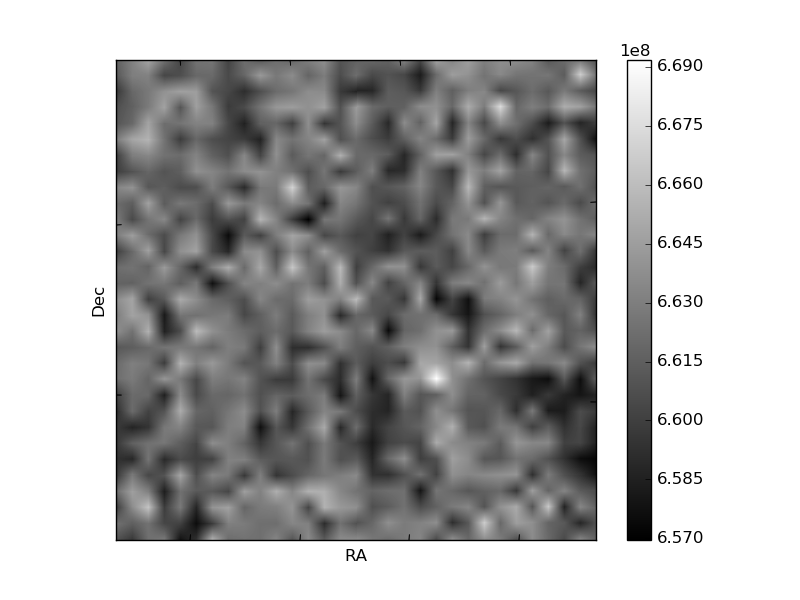
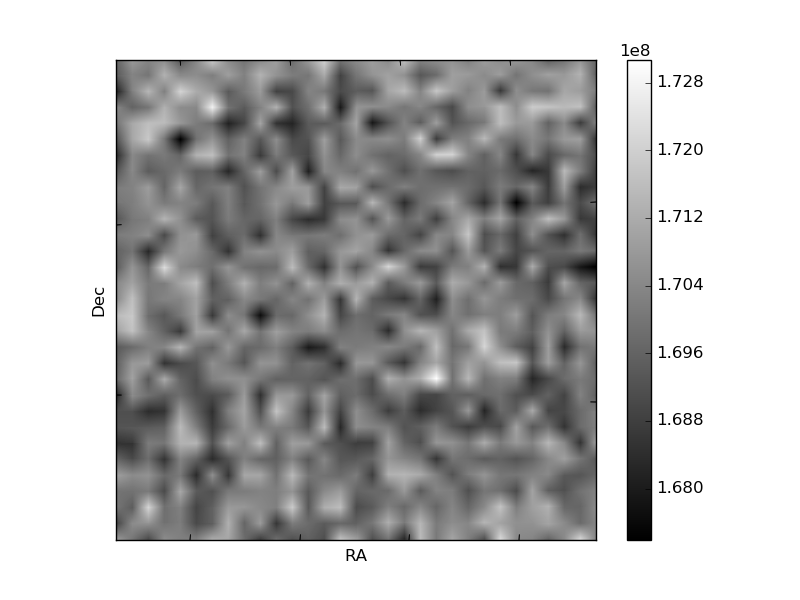
Histogram calculated using DETX and DETY for each event in the final _common_clean file
| Quadrant A | 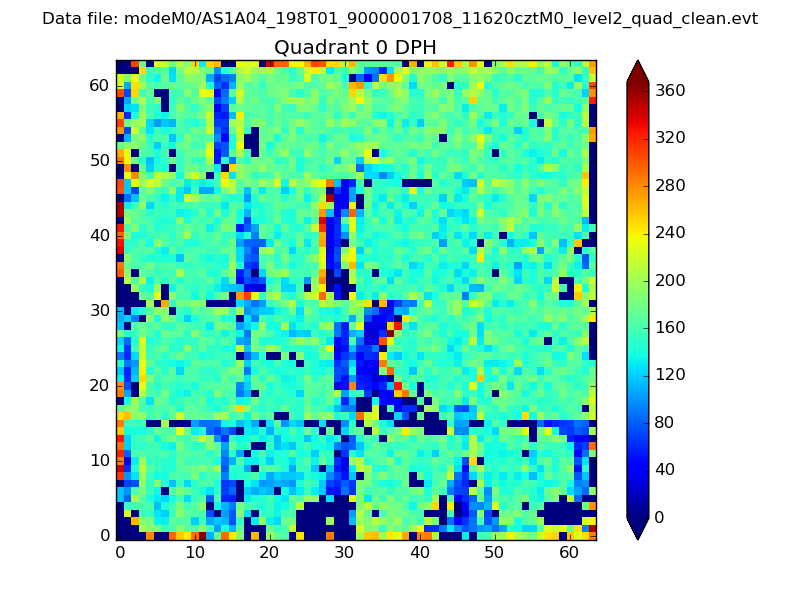 |
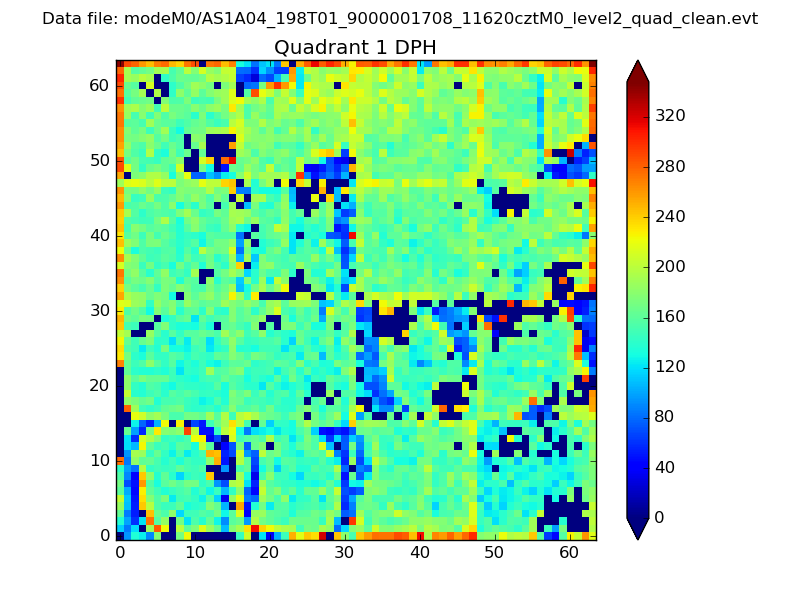 |
Quadrant B |
|---|---|---|---|
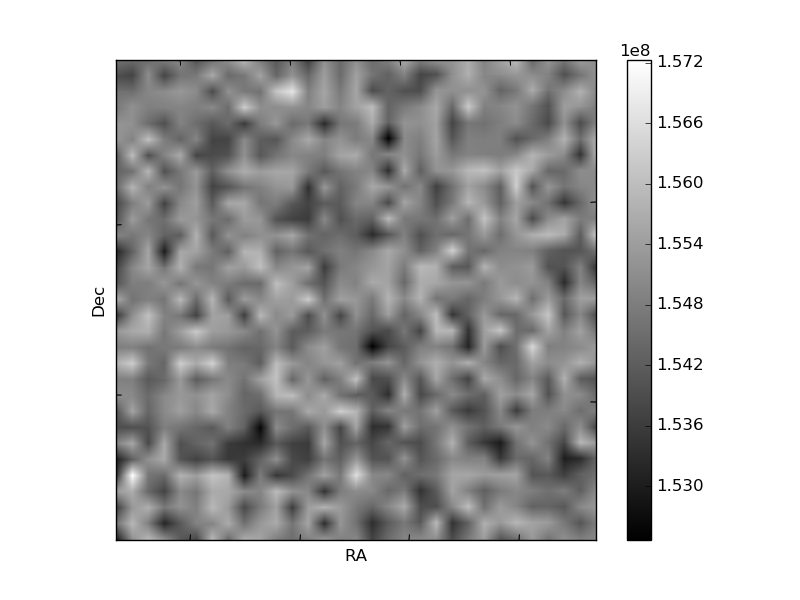
| Quadrant D | 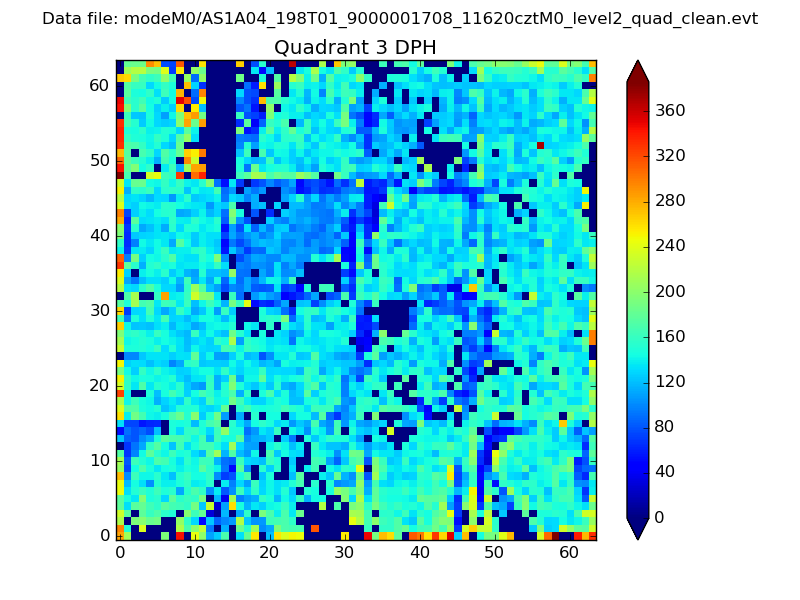 |
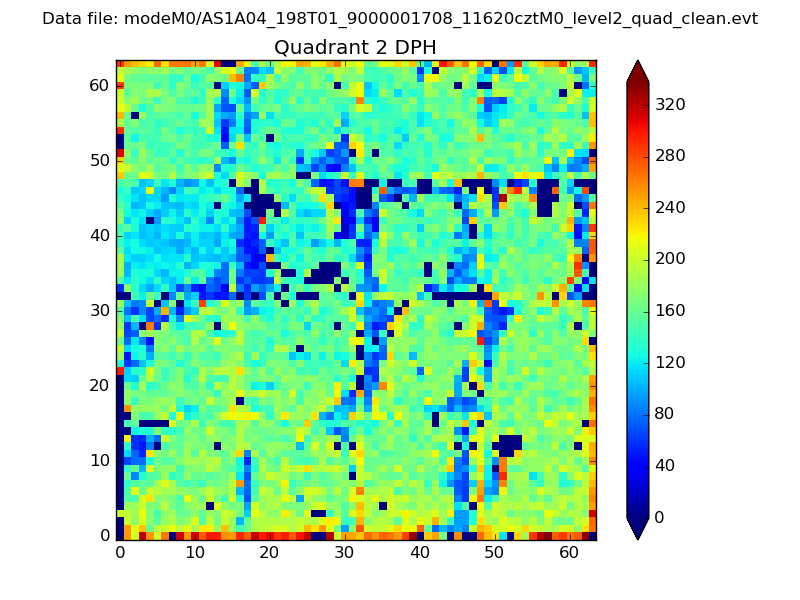 |
Quadrant C |
| Plot type | Count rate plots | Images |
|---|---|---|
| Comparison with Poisson distribution Blue bars denote a histogram of data divided into 1 sec bins. Red curve is a Poisson curve with rate = median count rate of data. |
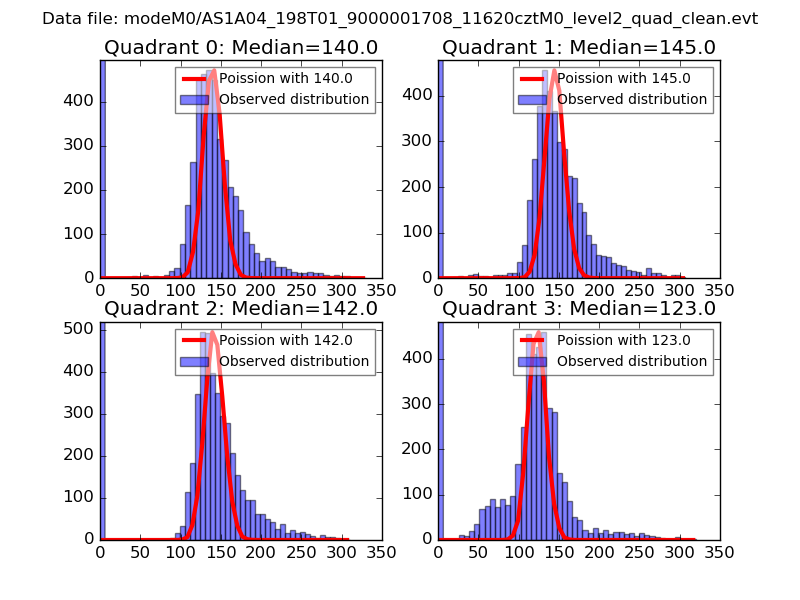 |
 |
| Quadrant-wise count rates Data is divided into 100 sec bins |
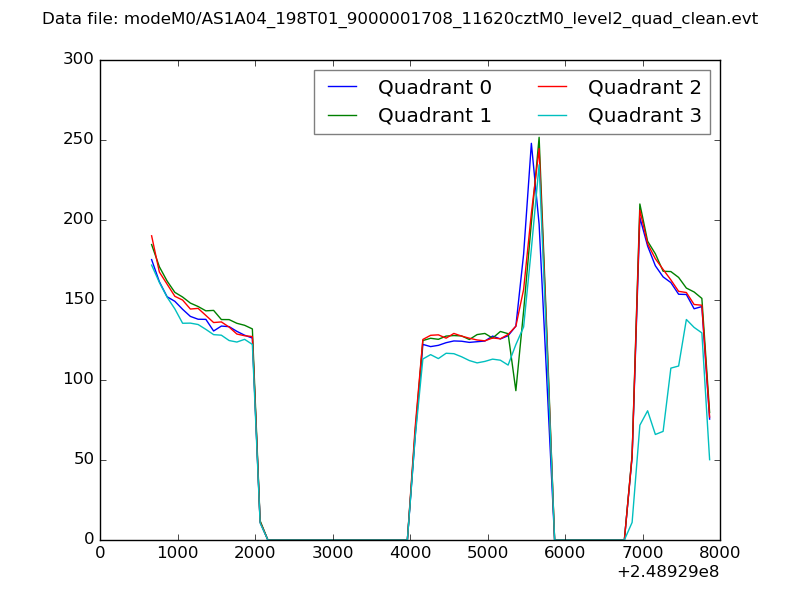 |
|
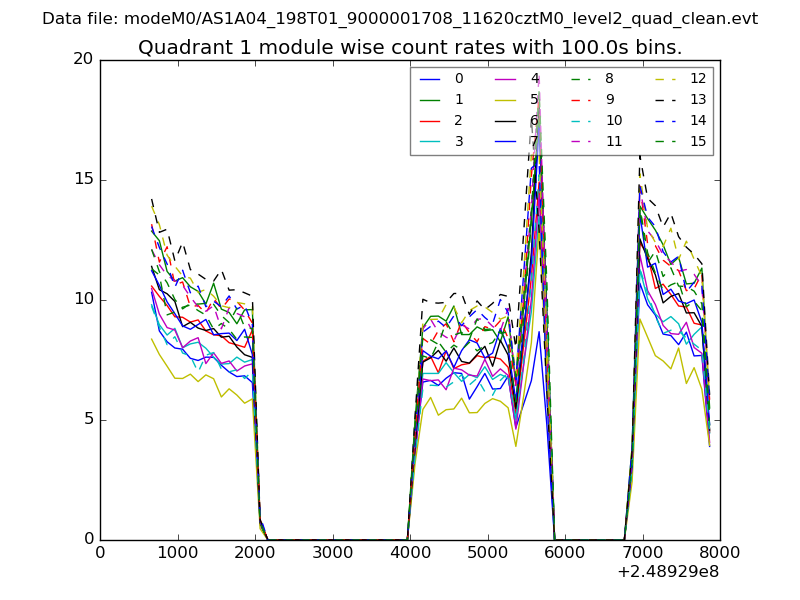
| Module-wise count rates for Quadrant A Data is divided into 100 sec bins |
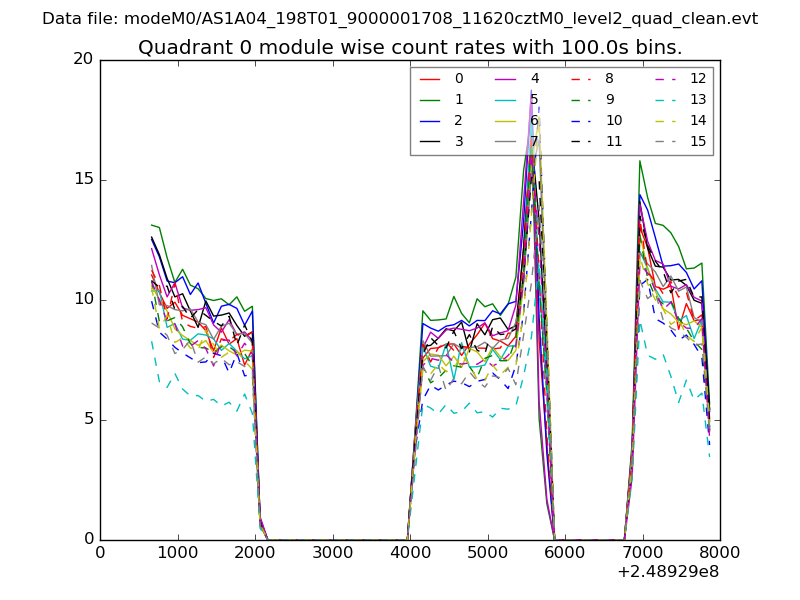 |
 |
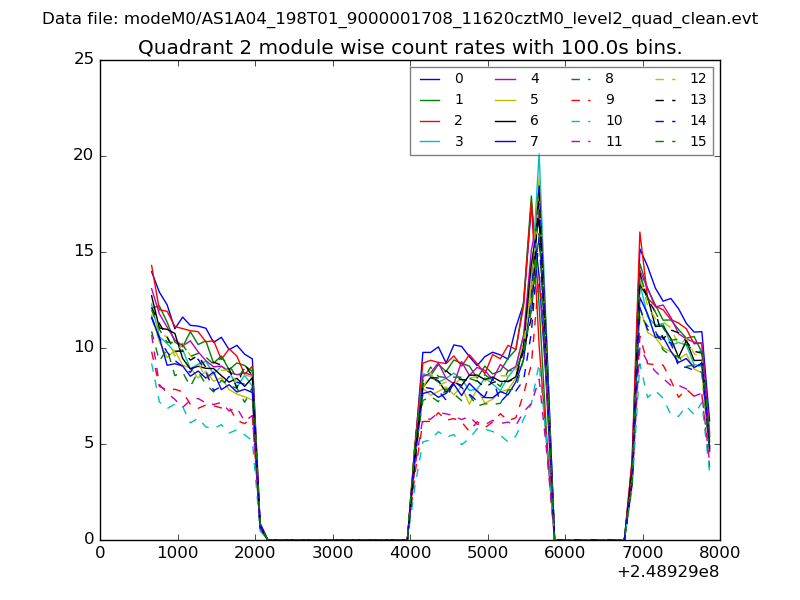
| Module-wise count rates for Quadrant B Data is divided into 100 sec bins |
 |
 |
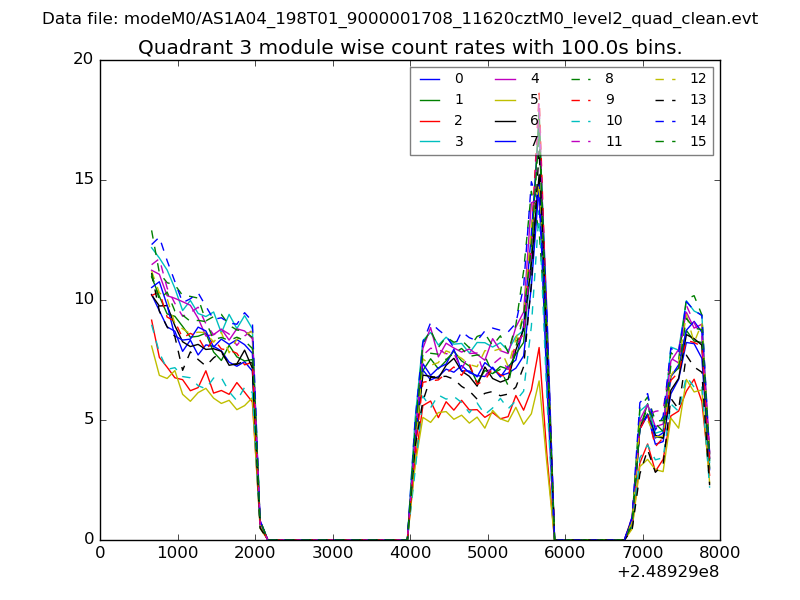
| Module-wise count rates for Quadrant C Data is divided into 100 sec bins |
 |
 |
| Module-wise count rates for Quadrant D Data is divided into 100 sec bins |
 |
 |
| Parameter | Plot |
|---|---|
| CZT HV Monitor | 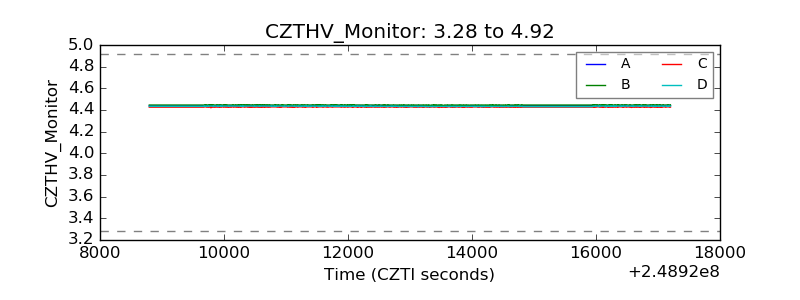 |
| D_VDD | 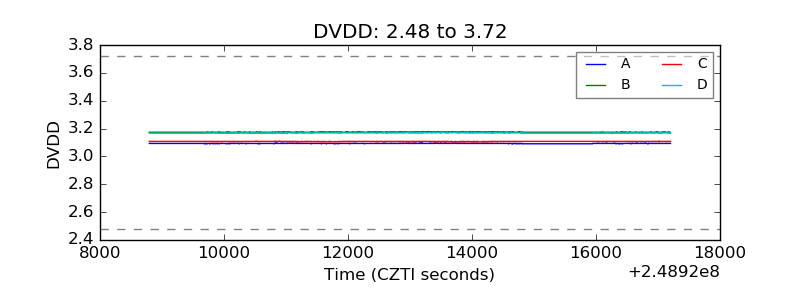 |
| Temperature 1 | 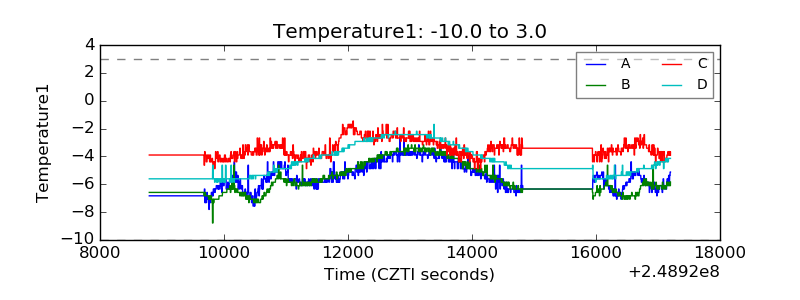 |
| Veto HV Monitor | 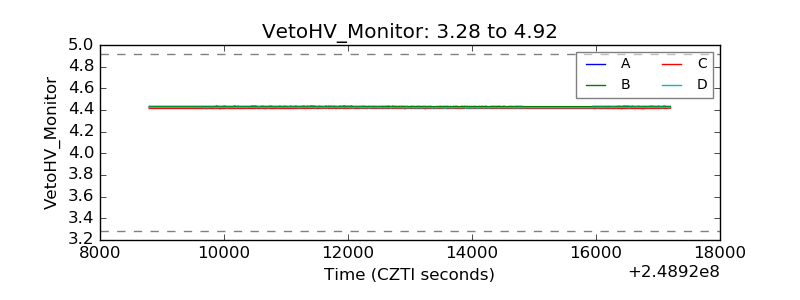 |
| Veto LLD | 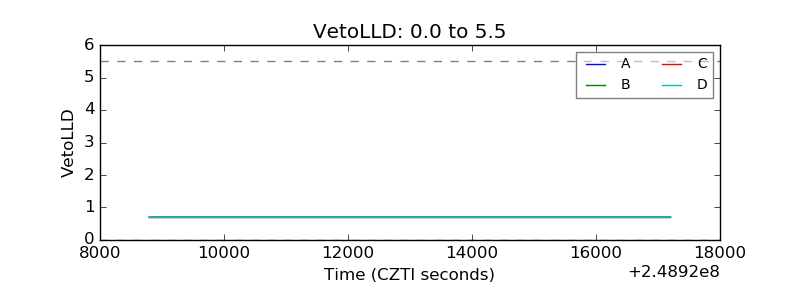 |
| Alpha Counter | 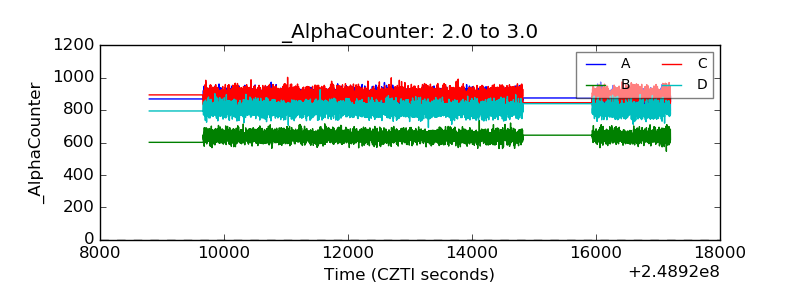 |
| _CPM_Rate | 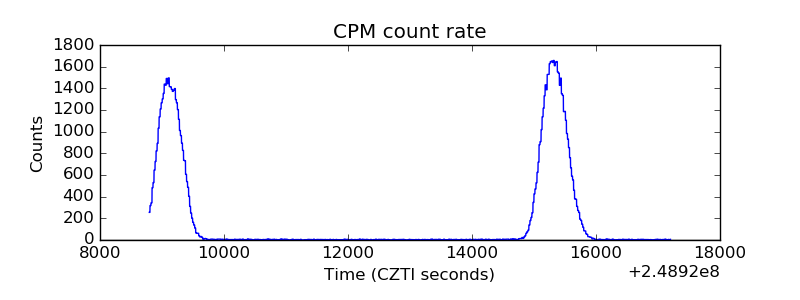 |
| CZT Counter | 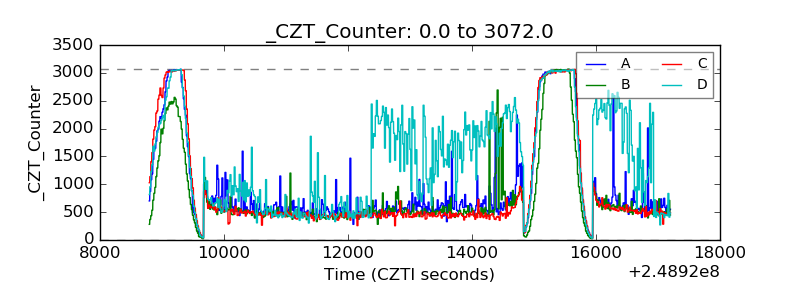 |
| +2.5 Volts monitor |  |
| +5 Volts monitor |  |
| _ROLL_ROT | 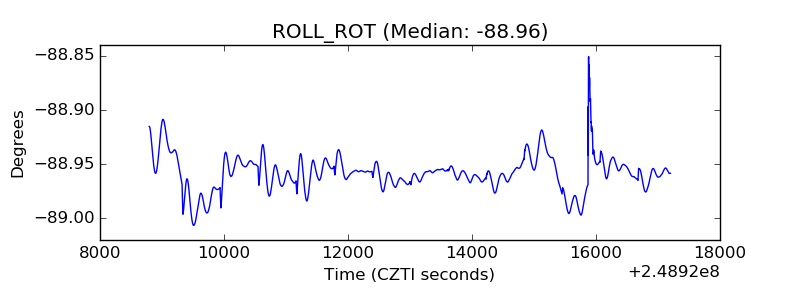 |
| _Roll_DEC | 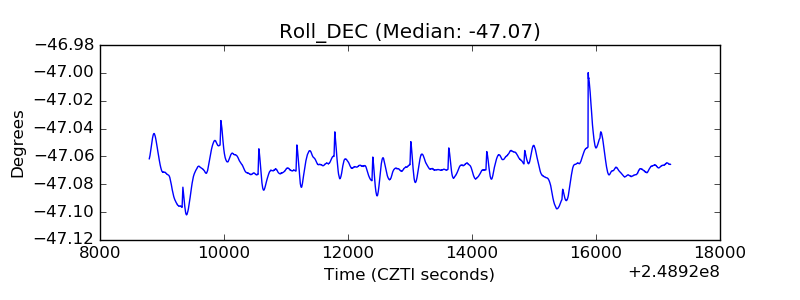 |
| _Roll_RA | 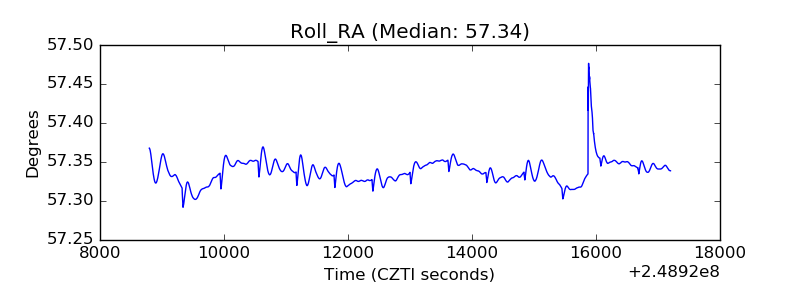 |
| Veto Counter | 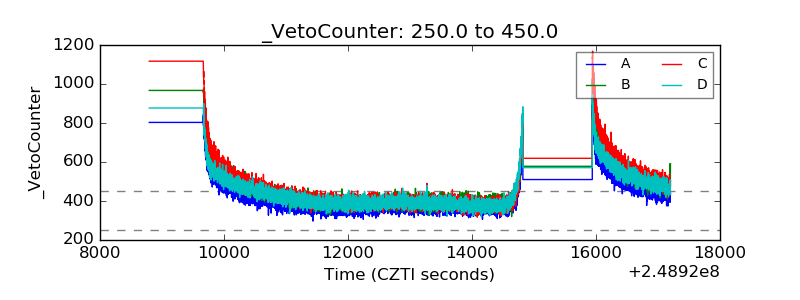 |