| Param | Original file | Final file |
|---|---|---|
| Filename | modeM0/AS1A04_198T01_9000001708_11622cztM0_level2.evt | modeM0/AS1A04_198T01_9000001708_11622cztM0_level2_quad_clean.evt |
| Size (bytes) | 772,182,720 | 67,726,080 |
| Size | 736.4 MB | 64.6 MB |
| Events in quadrant A | 5,827,218 | 399,216 |
| Events in quadrant B | 3,544,610 | 441,841 |
| Events in quadrant C | 3,099,890 | 436,961 |
| Events in quadrant D | 10,497,512 | 341,799 |
| Mode SS | |||
|---|---|---|---|
| Quadrant | BADHDUFLAG | Total packets | Discarded packets |
| A | 0 | 126 | 0 |
| B | 0 | 126 | 0 |
| C | 0 | 126 | 0 |
| D | 0 | 126 | 0 |
| Mode M0 | |||
|---|---|---|---|
| Quadrant | BADHDUFLAG | Total packets | Discarded packets |
| A | 0 | 21628 | 2 |
| B | 0 | 14209 | 1 |
| C | 0 | 13051 | 1 |
| D | 0 | 35255 | 1 |
| Mode M9 | |||
|---|---|---|---|
| Quadrant | BADHDUFLAG | Total packets | Discarded packets |
| A | 0 | 12 | 0 |
| B | 0 | 12 | 0 |
| C | 0 | 12 | 0 |
| D | 0 | 12 | 0 |
| Quadrant | Total seconds | Saturated seconds | Saturation percentage |
|---|---|---|---|
| A | 6157 | 886 | 14.390125% |
| B | 6157 | 166 | 2.696118% |
| C | 6157 | 80 | 1.299334% |
| D | 6157 | 3378 | 54.864382% |
Noise dominated data is calculated using 1-second bins in cleaned event files. If a bin has >2000 counts, and if more than 50% of those come from <1% of pixels, then it is considered to be noise-dominated and hence unusable.
| Quadrant | # 1 sec bins | Bins with >0 counts | Bins with >2000 counts | High rate bins dominated by noise | Noise dominated (total time) | Noise dominated (detector-on time) | Marked lightcurve |
|---|---|---|---|---|---|---|---|
| A | 7393 | 6159 | 530 | 530 | 7.17% | 8.61% | 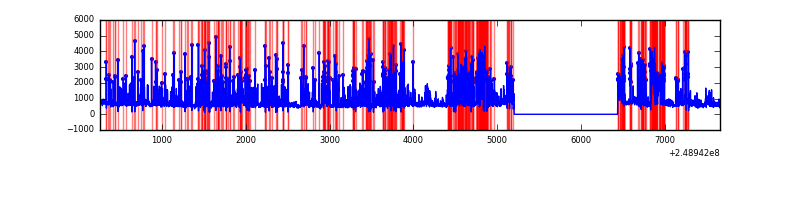 |
| B | 7393 | 6159 | 36 | 36 | 0.49% | 0.58% | 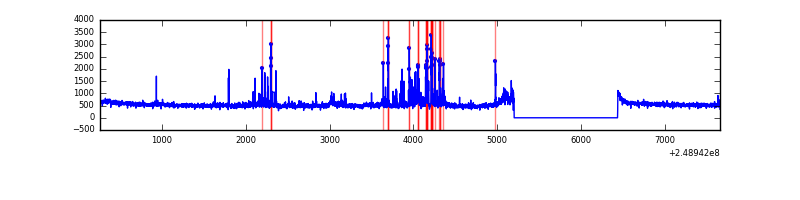 |
| C | 7393 | 6159 | 0 | 0 | 0.00% | 0.00% | 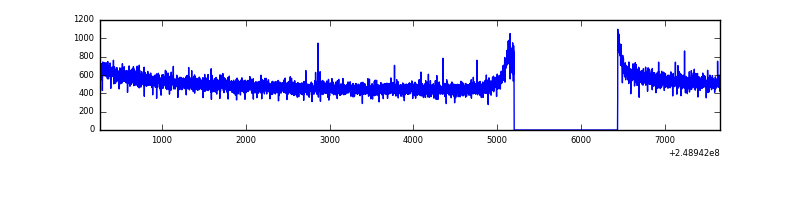 |
| D | 7393 | 6153 | 2936 | 2936 | 39.71% | 47.72% | 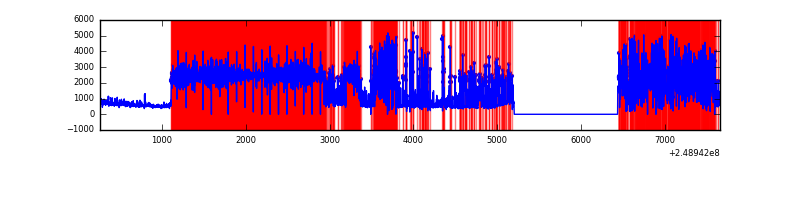 |
Top three noisy pixels from each quadrant. If the there are fewer than three noisy pixels in the level2.evt file, extra rows are filled as -1
| Pixel properties | Quadrant properties | ||||||
|---|---|---|---|---|---|---|---|
| Quadrant | DetID | PixID | Counts | Sigma | Mean | Median | Sigma |
| A | 8 | 5 | 2703033 | 17869.99 | 751 | 738 | 151.2 |
| A | 1 | 162 | 85494 | 560.48 | 751 | 738 | 151.2 |
| A | 1 | 178 | 50090 | 326.36 | 751 | 738 | 151.2 |
| B | 4 | 239 | 218653 | 1473.85 | 798 | 780 | 147.8 |
| B | 3 | 64 | 85444 | 572.73 | 798 | 780 | 147.8 |
| B | 11 | 51 | 64554 | 431.41 | 798 | 780 | 147.8 |
| C | 8 | 128 | 12538 | 65.39 | 788 | 792 | 179.6 |
| C | 13 | 61 | 5778 | 27.76 | 788 | 792 | 179.6 |
| C | 8 | 112 | 5714 | 27.4 | 788 | 792 | 179.6 |
| D | 13 | 122 | 4526104 | 36920.5 | 522 | 508 | 122.6 |
| D | 13 | 152 | 3723105 | 30369.52 | 522 | 508 | 122.6 |
| D | 13 | 104 | 135349 | 1100.05 | 522 | 508 | 122.6 |
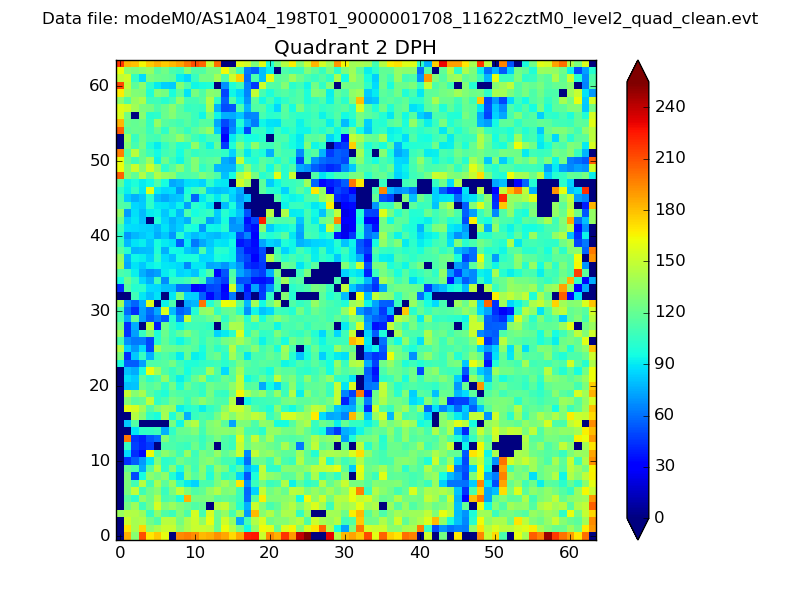
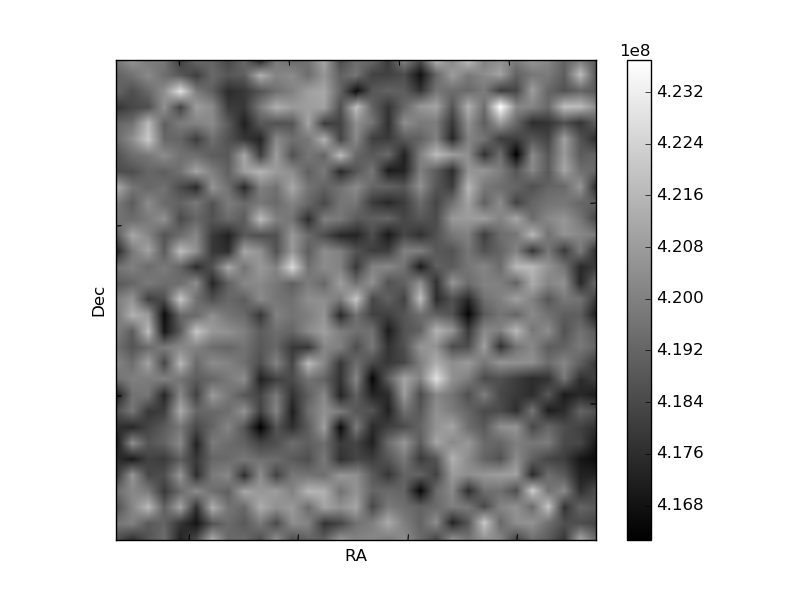
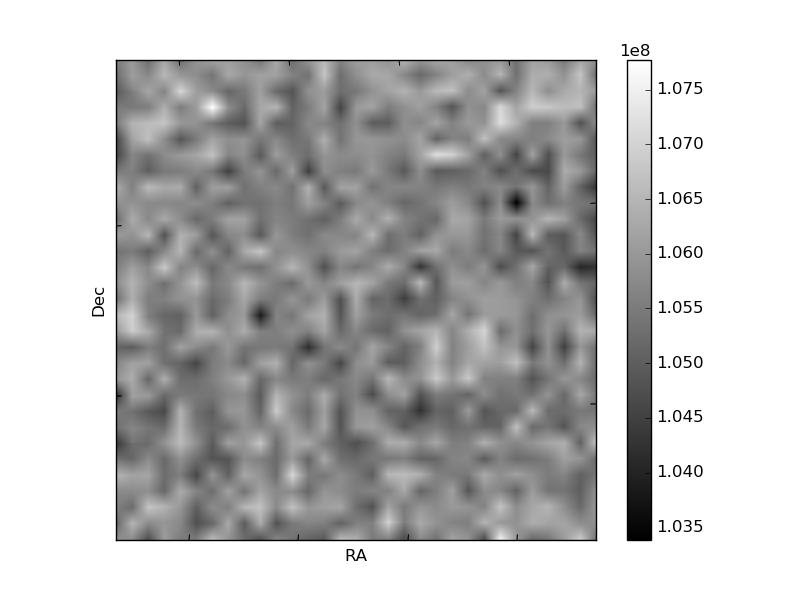
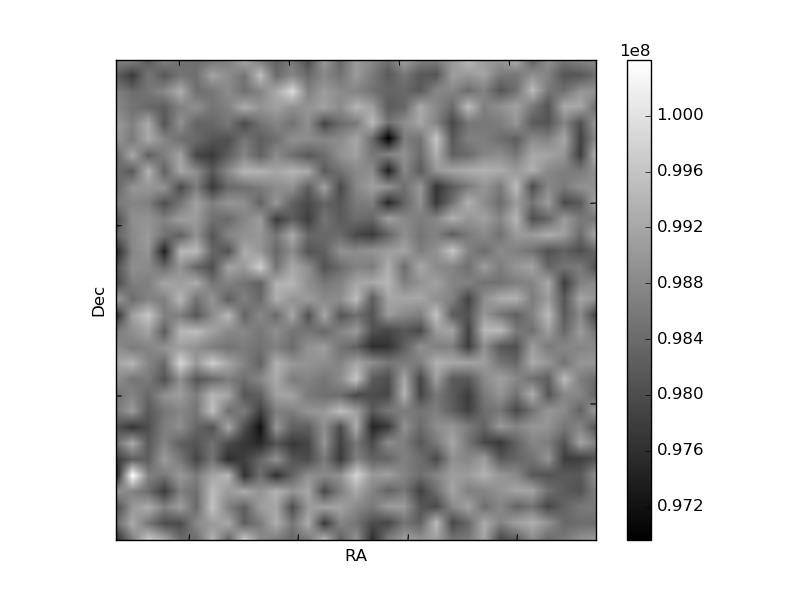
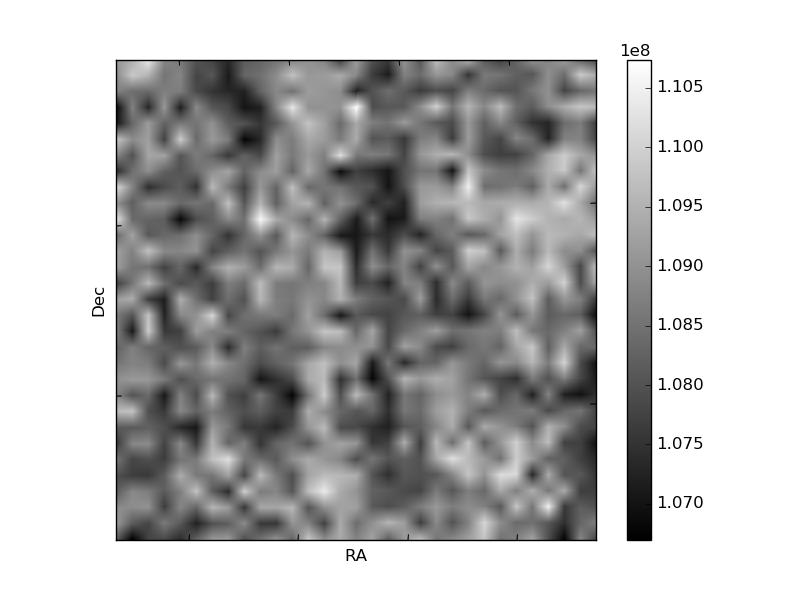
Histogram calculated using DETX and DETY for each event in the final _common_clean file
| Quadrant A | 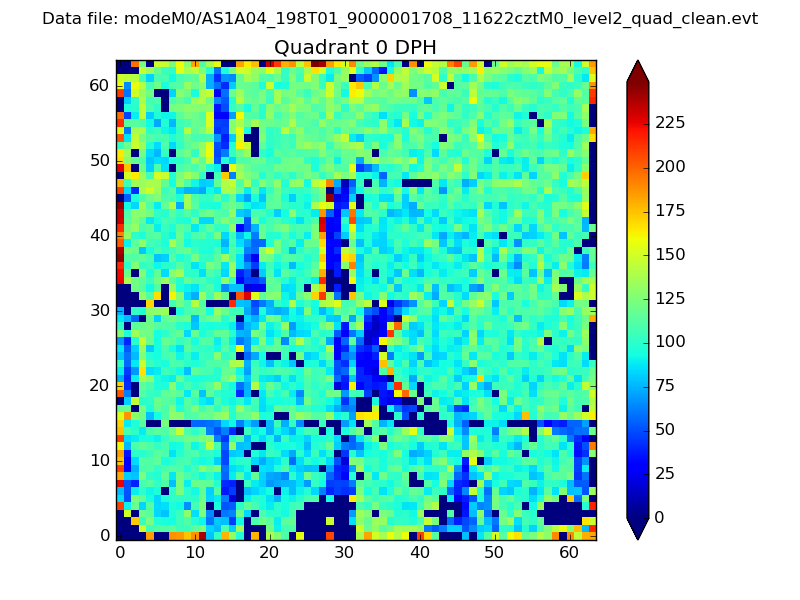 |
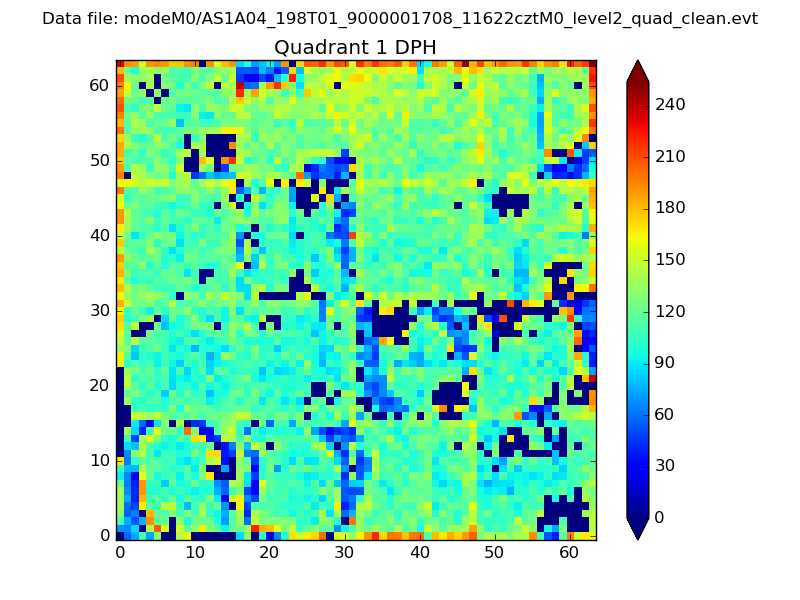 |
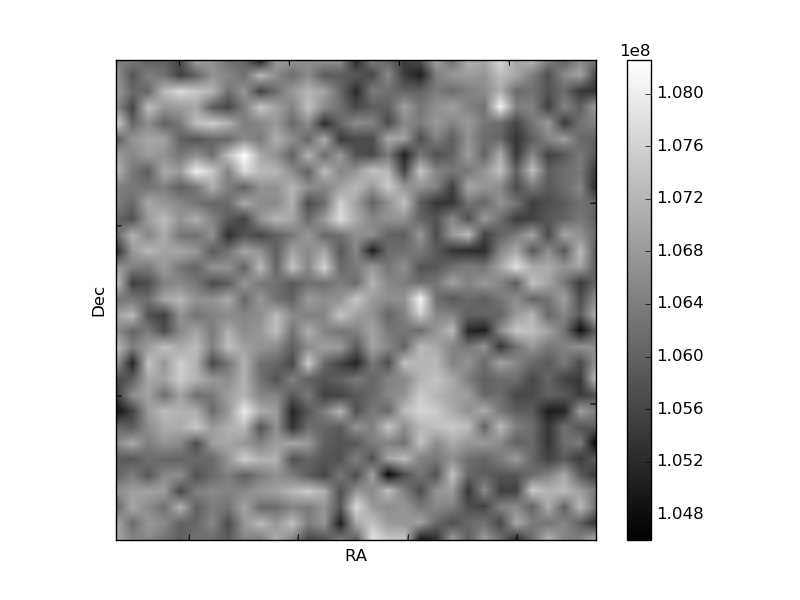
Quadrant B |
|---|---|---|---|
| Quadrant D | 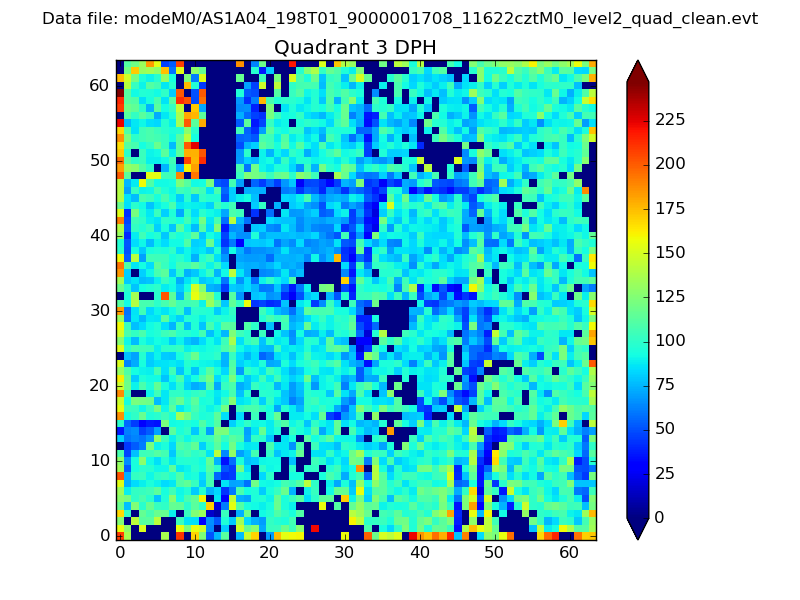 |
 |
Quadrant C |
| Plot type | Count rate plots | Images |
|---|---|---|
| Comparison with Poisson distribution Blue bars denote a histogram of data divided into 1 sec bins. Red curve is a Poisson curve with rate = median count rate of data. |
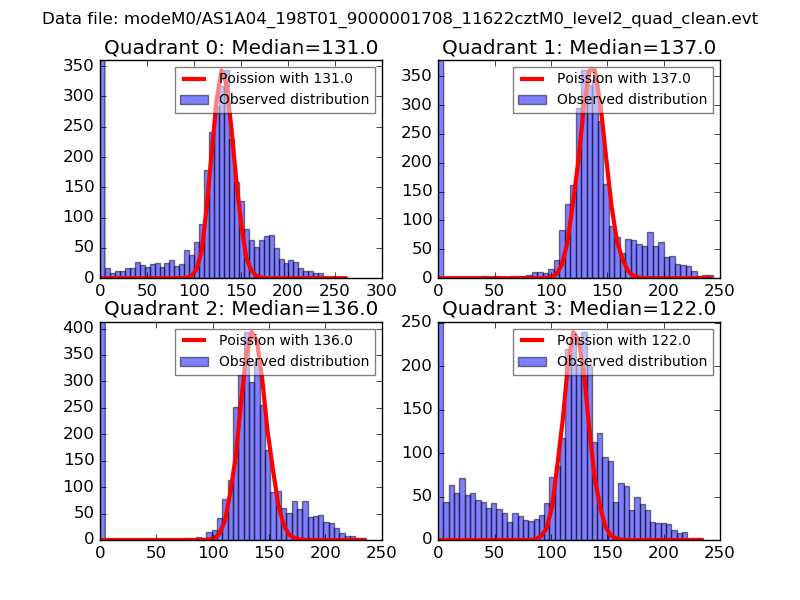 |
 |
| Quadrant-wise count rates Data is divided into 100 sec bins |
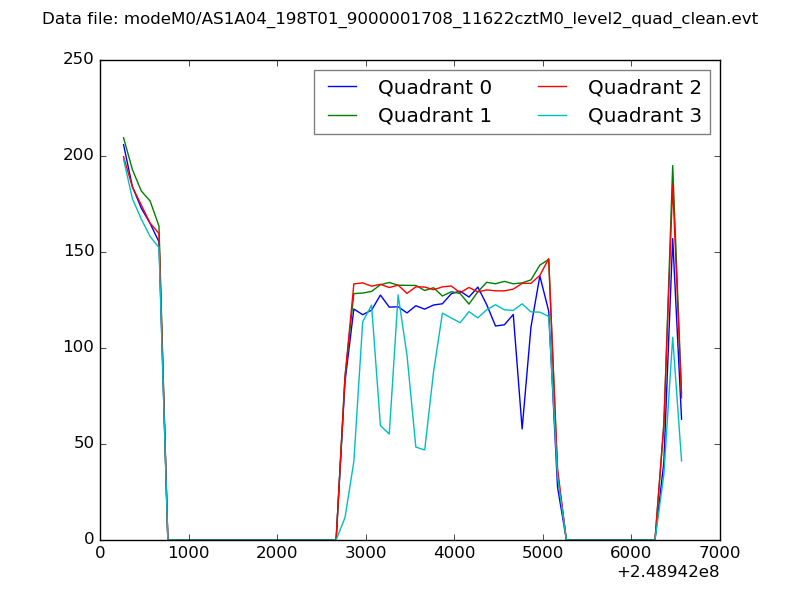 |
|
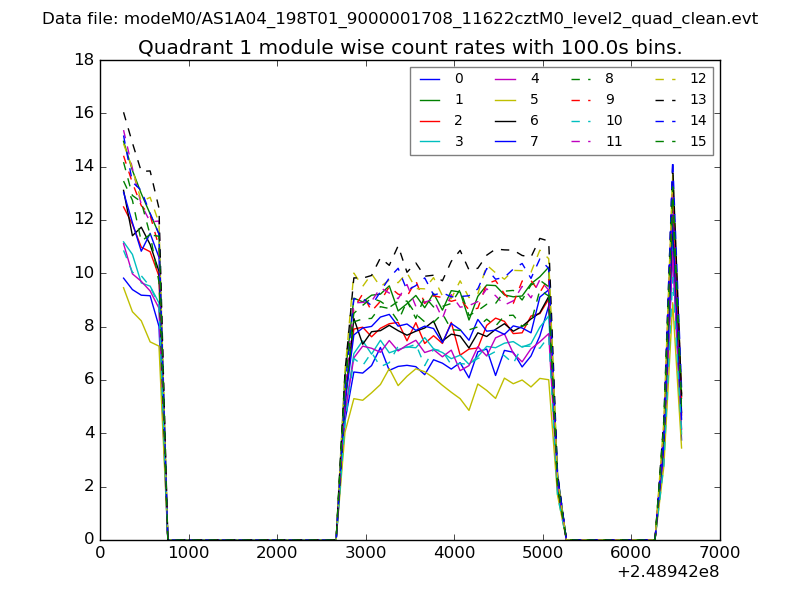
| Module-wise count rates for Quadrant A Data is divided into 100 sec bins |
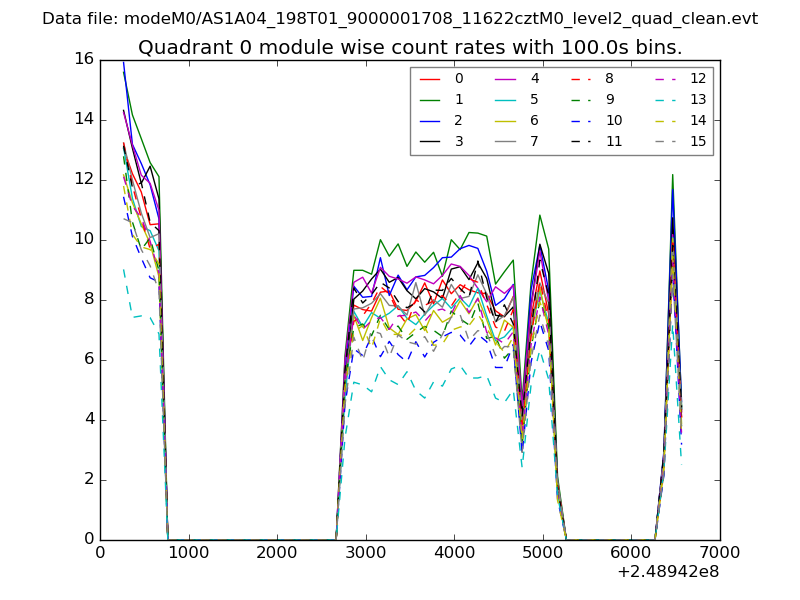 |
 |
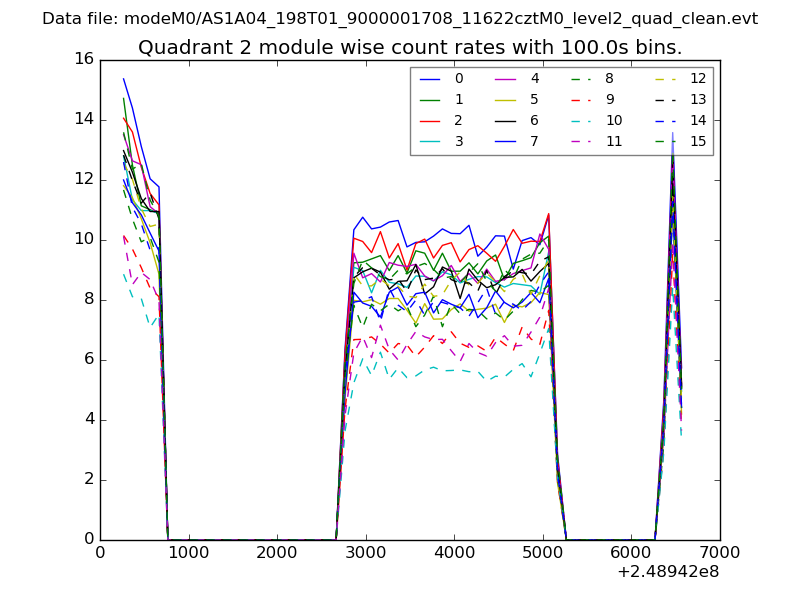
| Module-wise count rates for Quadrant B Data is divided into 100 sec bins |
 |
 |
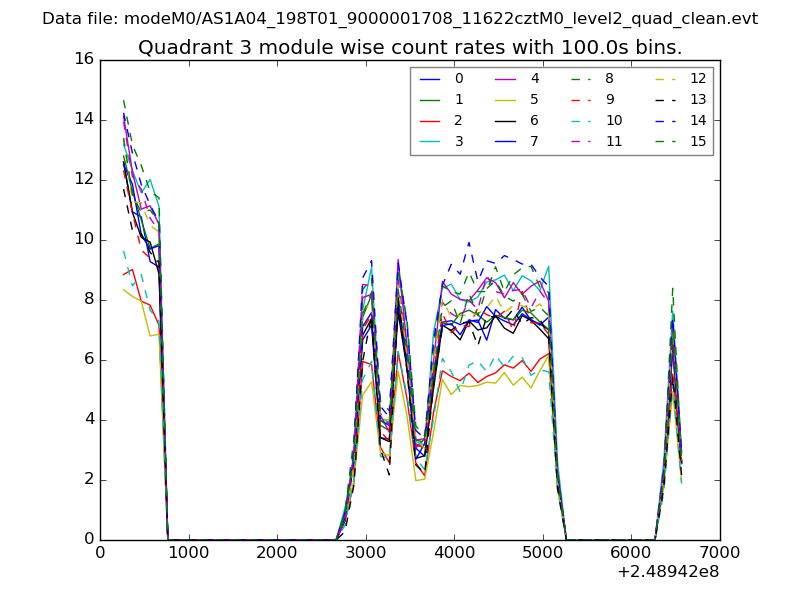
| Module-wise count rates for Quadrant C Data is divided into 100 sec bins |
 |
 |
| Module-wise count rates for Quadrant D Data is divided into 100 sec bins |
 |
 |
| Parameter | Plot |
|---|---|
| CZT HV Monitor | 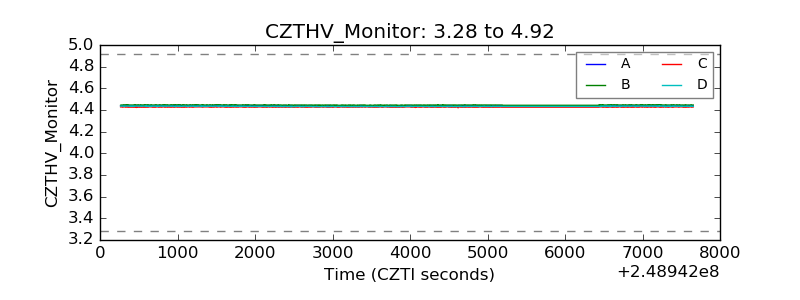 |
| D_VDD | 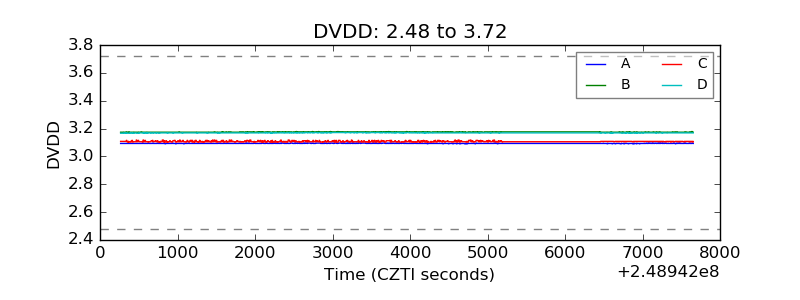 |
| Temperature 1 | 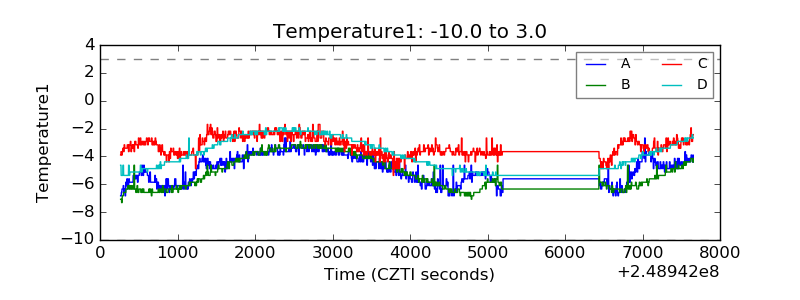 |
| Veto HV Monitor | 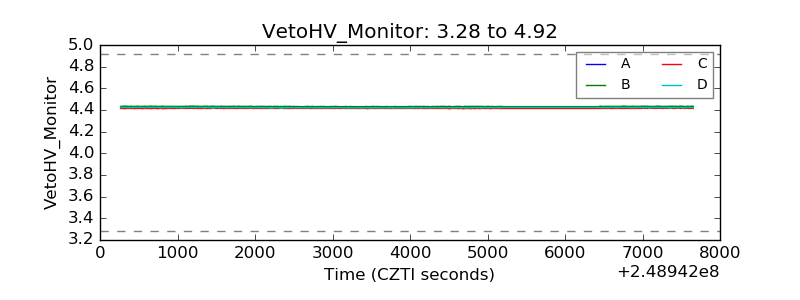 |
| Veto LLD | 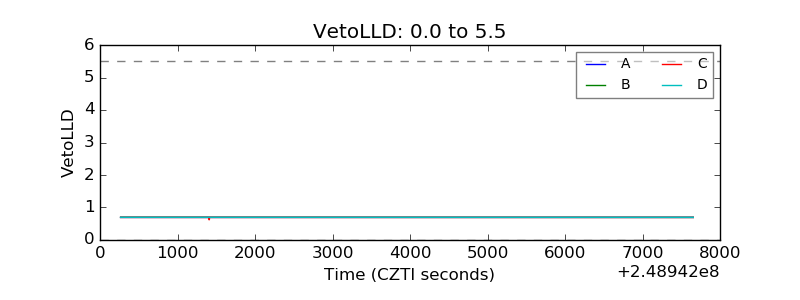 |
| Alpha Counter | 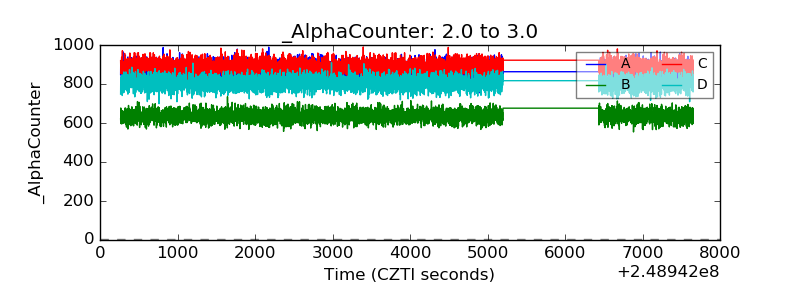 |
| _CPM_Rate | 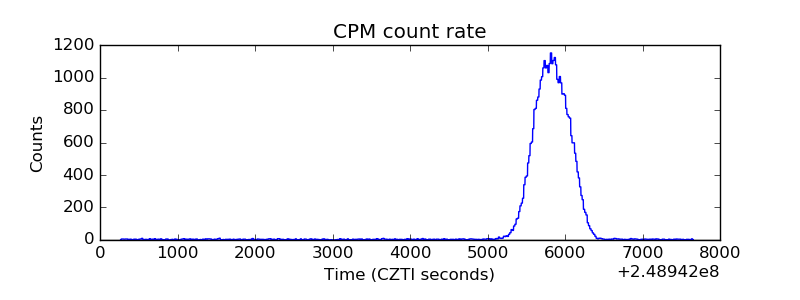 |
| CZT Counter | 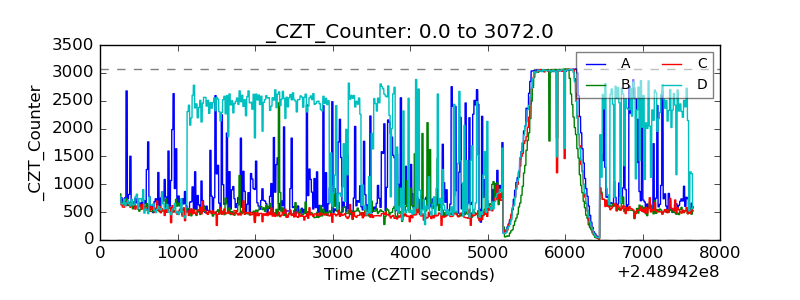 |
| +2.5 Volts monitor | 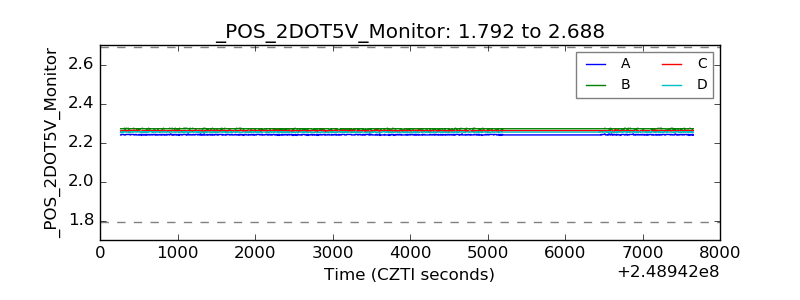 |
| +5 Volts monitor | 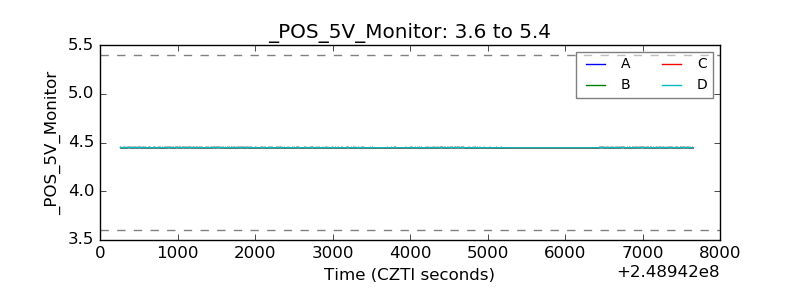 |
| _ROLL_ROT | 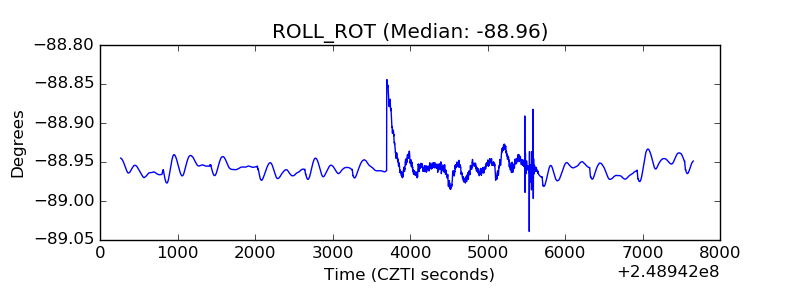 |
| _Roll_DEC | 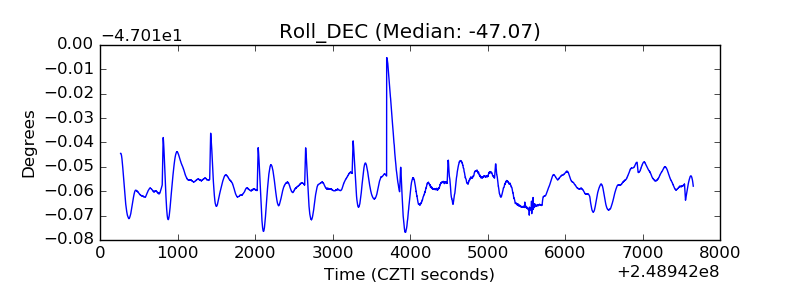 |
| _Roll_RA | 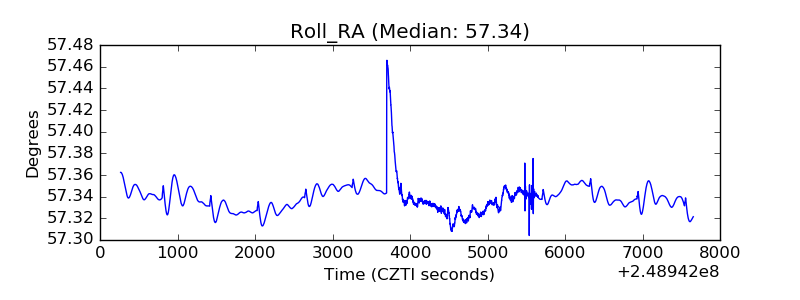 |
| Veto Counter | 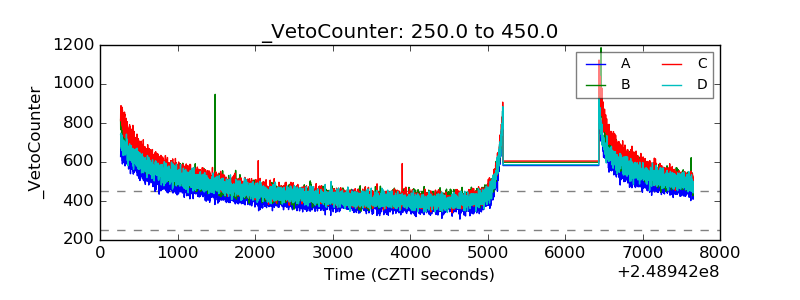 |