| Param | Original file | Final file |
|---|---|---|
| Filename | modeM0/AS1A04_198T01_9000001708_11623cztM0_level2.evt | modeM0/AS1A04_198T01_9000001708_11623cztM0_level2_quad_clean.evt |
| Size (bytes) | 700,044,480 | 64,897,920 |
| Size | 667.6 MB | 61.9 MB |
| Events in quadrant A | 5,348,857 | 385,355 |
| Events in quadrant B | 4,161,873 | 398,261 |
| Events in quadrant C | 3,149,780 | 398,732 |
| Events in quadrant D | 8,109,927 | 337,525 |
| Mode SS | |||
|---|---|---|---|
| Quadrant | BADHDUFLAG | Total packets | Discarded packets |
| A | 0 | 130 | 0 |
| B | 0 | 130 | 0 |
| C | 0 | 130 | 0 |
| D | 0 | 130 | 0 |
| Mode M0 | |||
|---|---|---|---|
| Quadrant | BADHDUFLAG | Total packets | Discarded packets |
| A | 0 | 20344 | 3 |
| B | 0 | 16264 | 2 |
| C | 0 | 13359 | 2 |
| D | 0 | 28300 | 2 |
| Mode M9 | |||
|---|---|---|---|
| Quadrant | BADHDUFLAG | Total packets | Discarded packets |
| A | 0 | 15 | 0 |
| B | 0 | 15 | 0 |
| C | 0 | 15 | 0 |
| D | 0 | 16 | 0 |
| Quadrant | Total seconds | Saturated seconds | Saturation percentage |
|---|---|---|---|
| A | 6368 | 640 | 10.050251% |
| B | 6368 | 259 | 4.067211% |
| C | 6368 | 58 | 0.910804% |
| D | 6368 | 1613 | 25.329774% |
Noise dominated data is calculated using 1-second bins in cleaned event files. If a bin has >2000 counts, and if more than 50% of those come from <1% of pixels, then it is considered to be noise-dominated and hence unusable.
| Quadrant | # 1 sec bins | Bins with >0 counts | Bins with >2000 counts | High rate bins dominated by noise | Noise dominated (total time) | Noise dominated (detector-on time) | Marked lightcurve |
|---|---|---|---|---|---|---|---|
| A | 7609 | 6370 | 330 | 330 | 4.34% | 5.18% | 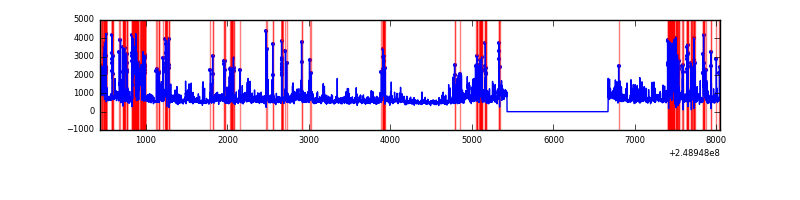 |
| B | 7609 | 6370 | 84 | 84 | 1.10% | 1.32% | 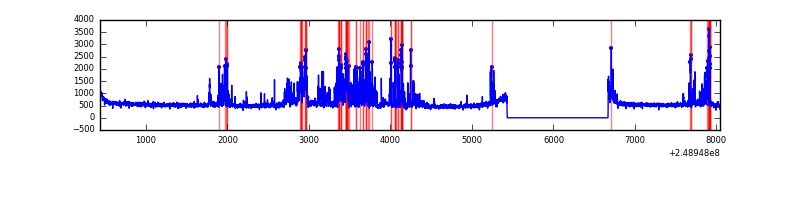 |
| C | 7609 | 6370 | 0 | 0 | 0.00% | 0.00% | 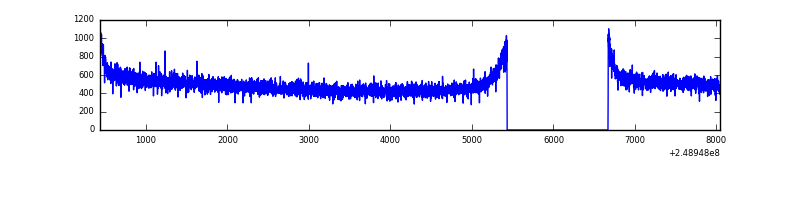 |
| D | 7609 | 6368 | 1352 | 1352 | 17.77% | 21.23% | 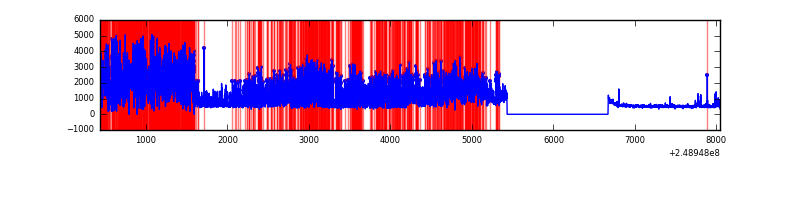 |
Top three noisy pixels from each quadrant. If the there are fewer than three noisy pixels in the level2.evt file, extra rows are filled as -1
| Pixel properties | Quadrant properties | ||||||
|---|---|---|---|---|---|---|---|
| Quadrant | DetID | PixID | Counts | Sigma | Mean | Median | Sigma |
| A | 8 | 5 | 1959670 | 12377.22 | 789 | 772 | 158.3 |
| A | 1 | 162 | 129395 | 812.7 | 789 | 772 | 158.3 |
| A | 1 | 178 | 75576 | 472.64 | 789 | 772 | 158.3 |
| B | 4 | 239 | 621182 | 4020.26 | 818 | 798 | 154.3 |
| B | 3 | 64 | 197348 | 1273.7 | 818 | 798 | 154.3 |
| B | 11 | 51 | 98672 | 634.25 | 818 | 798 | 154.3 |
| C | 13 | 61 | 5878 | 27.51 | 808 | 813 | 184.1 |
| C | 3 | 202 | 1966 | 6.26 | 808 | 813 | 184.1 |
| C | 3 | 203 | 1766 | 5.17 | 808 | 813 | 184.1 |
| D | 13 | 152 | 5010932 | 29524.95 | 713 | 693 | 169.7 |
| D | 7 | 80 | 205094 | 1204.52 | 713 | 693 | 169.7 |
| D | 2 | 136 | 57310 | 333.64 | 713 | 693 | 169.7 |
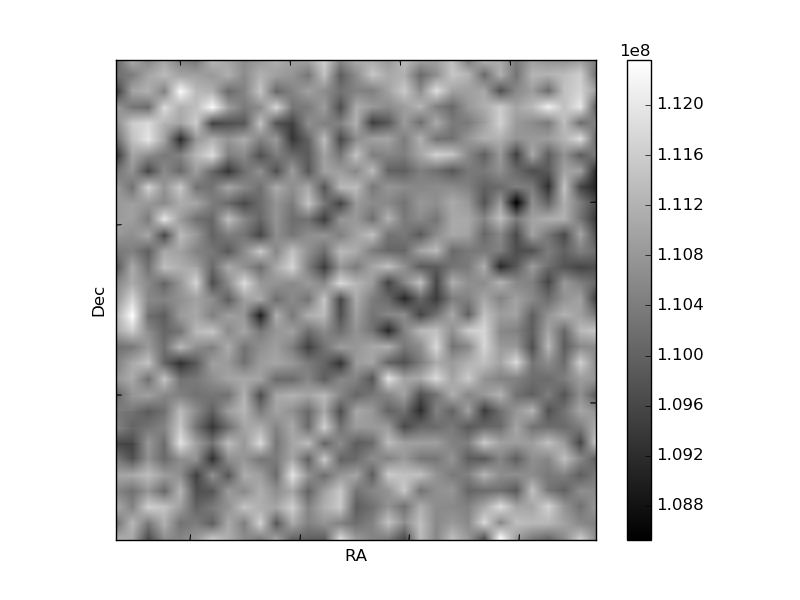
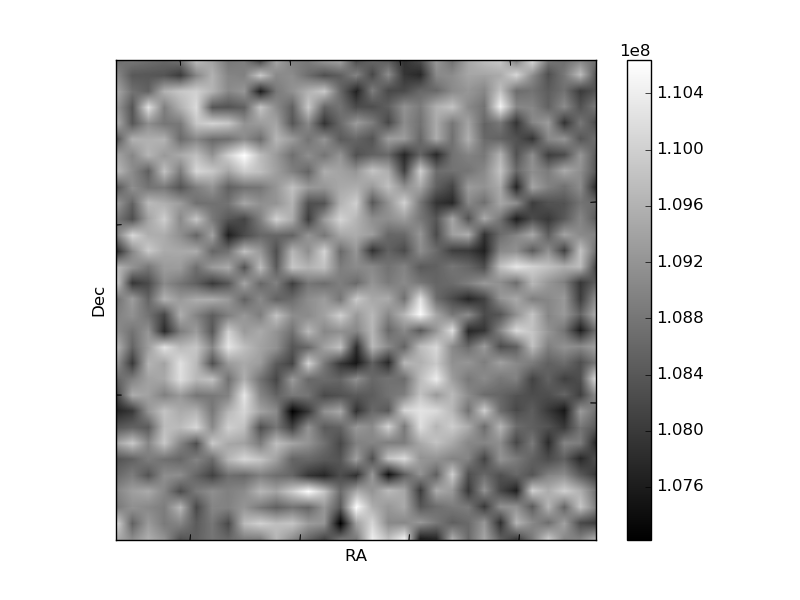
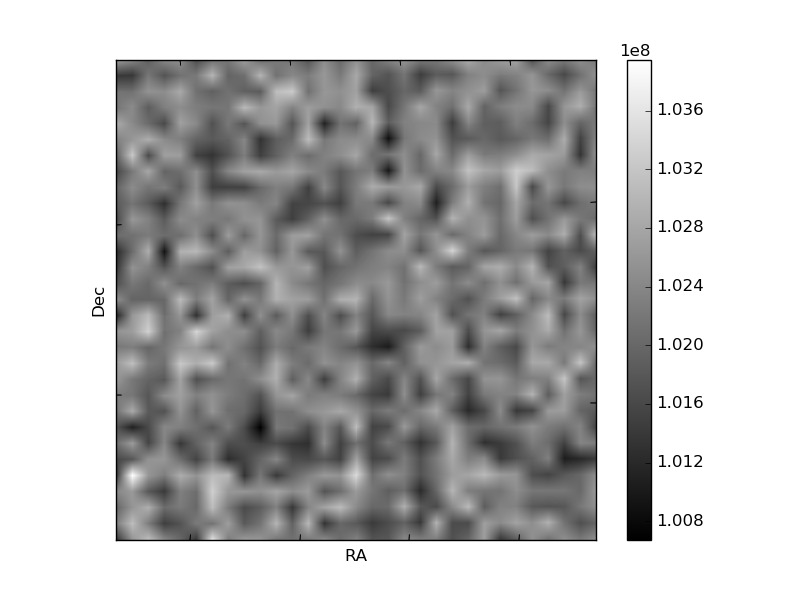
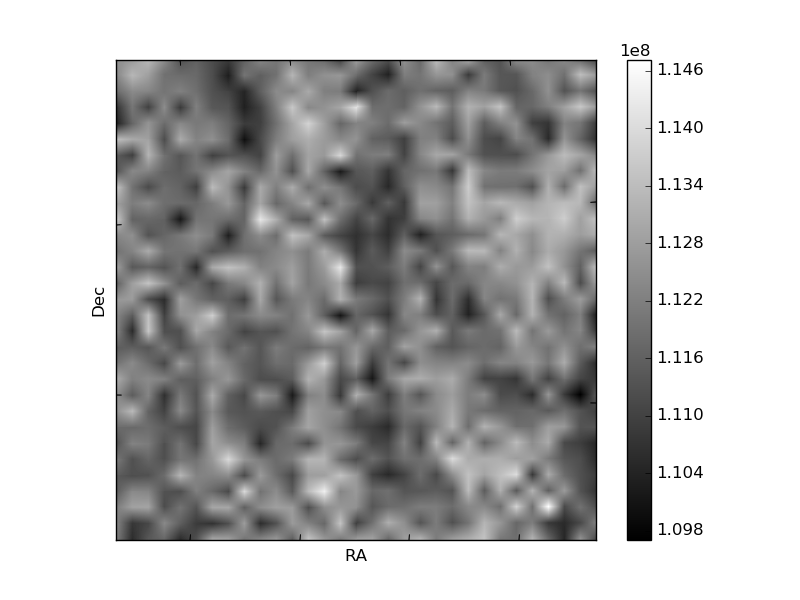
Histogram calculated using DETX and DETY for each event in the final _common_clean file
| Quadrant A | 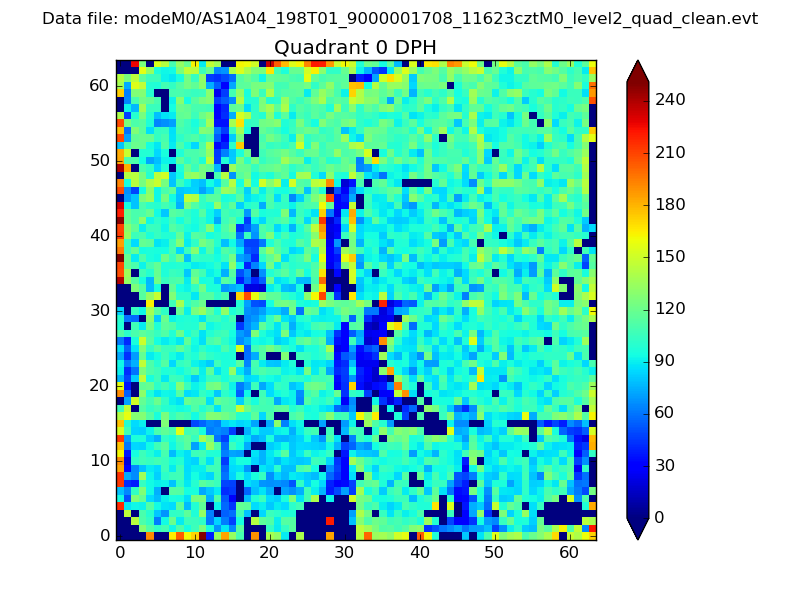 |
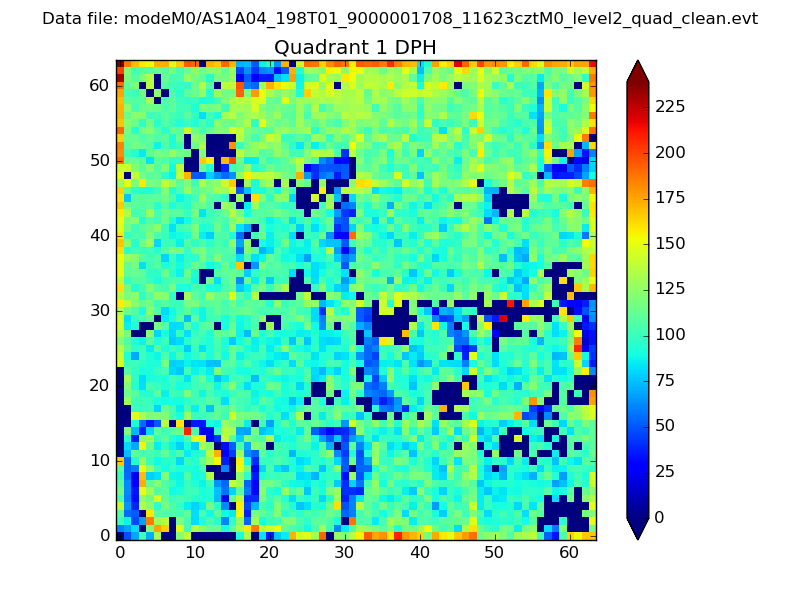 |
Quadrant B |
|---|---|---|---|
| Quadrant D | 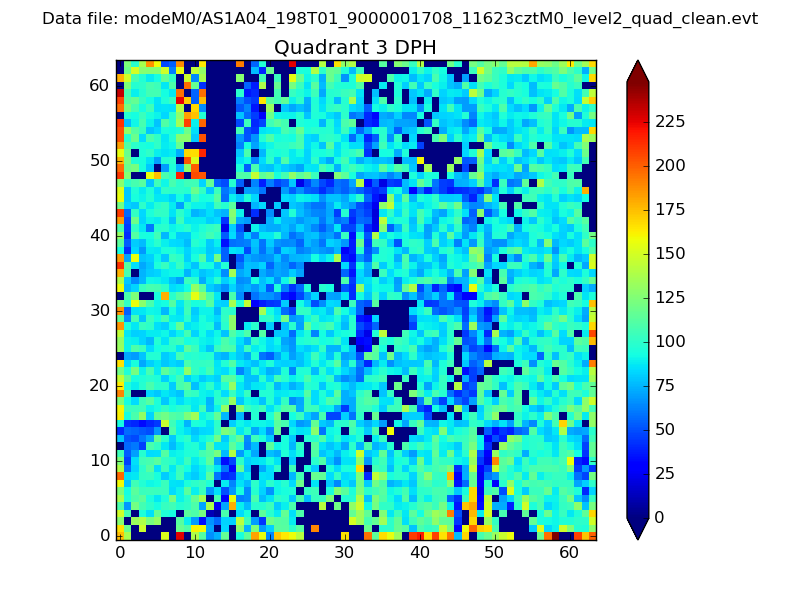 |
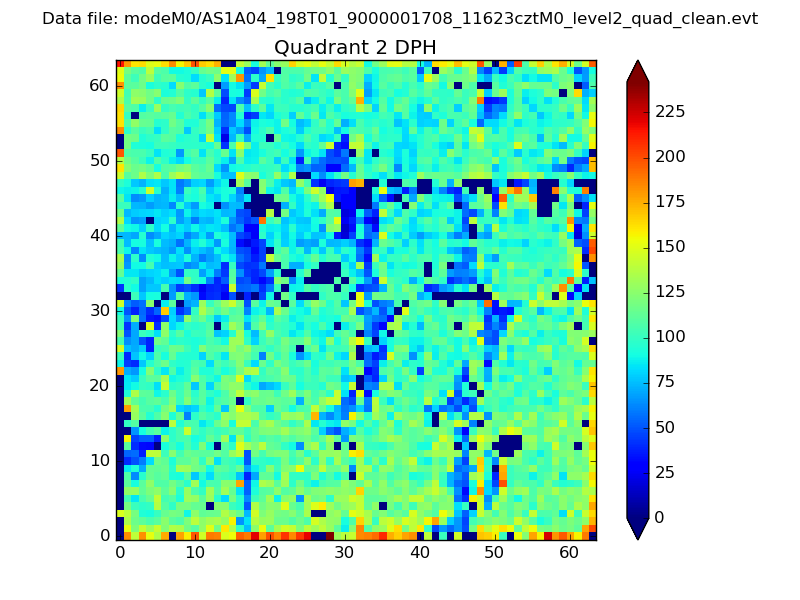 |
Quadrant C |
| Plot type | Count rate plots | Images |
|---|---|---|
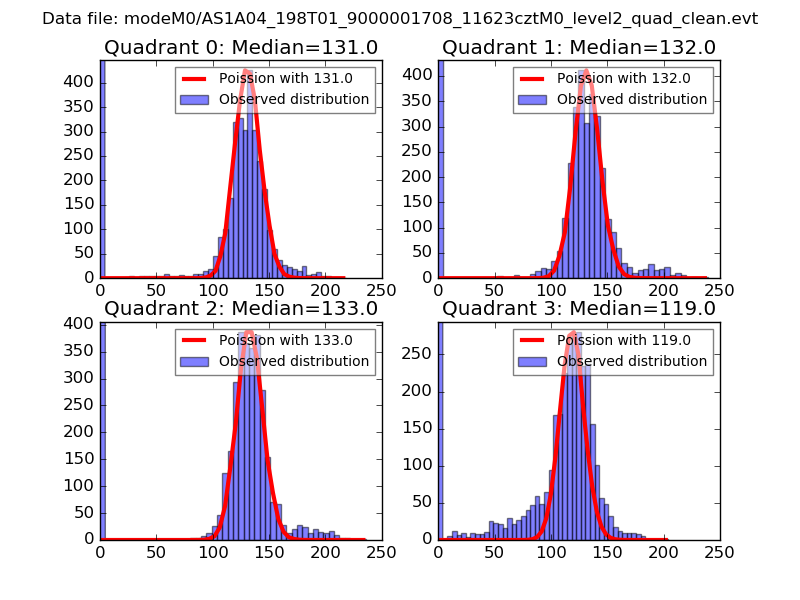
| Comparison with Poisson distribution Blue bars denote a histogram of data divided into 1 sec bins. Red curve is a Poisson curve with rate = median count rate of data. |
 |
 |
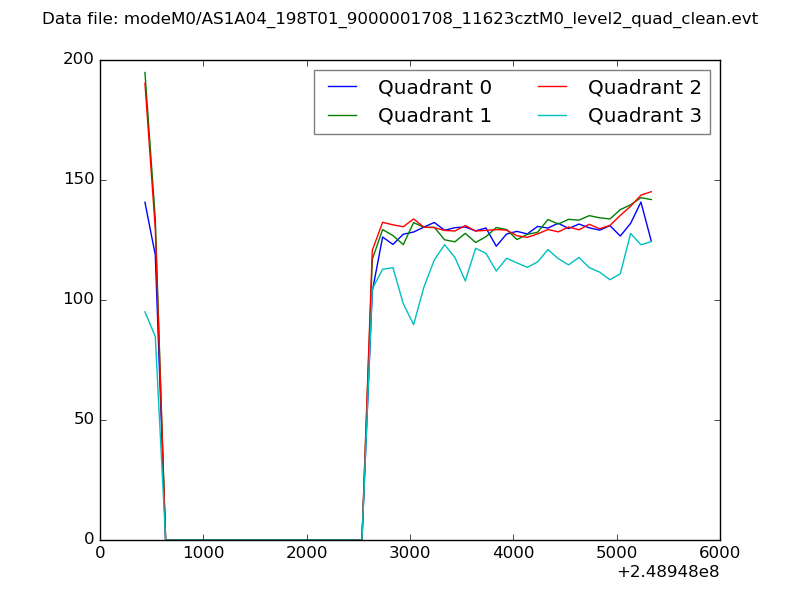
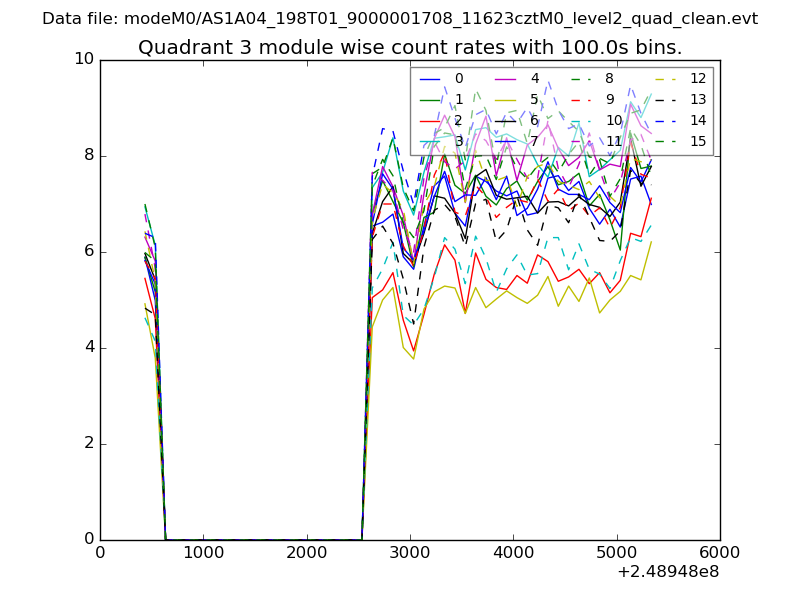
| Quadrant-wise count rates Data is divided into 100 sec bins |
 |
|
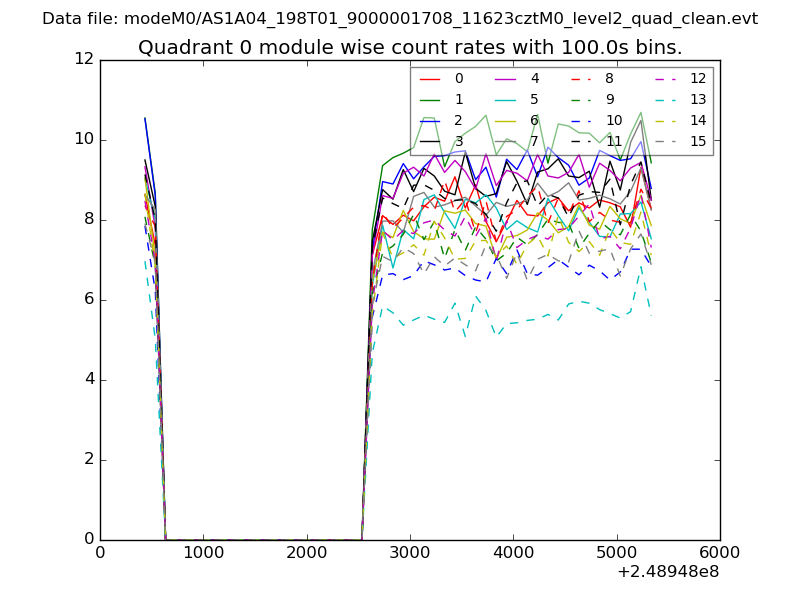
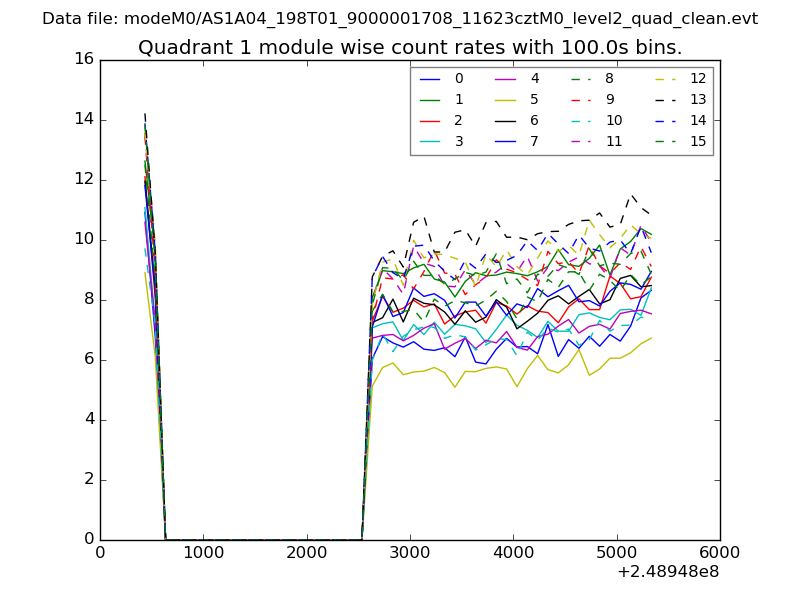
| Module-wise count rates for Quadrant A Data is divided into 100 sec bins |
 |
 |
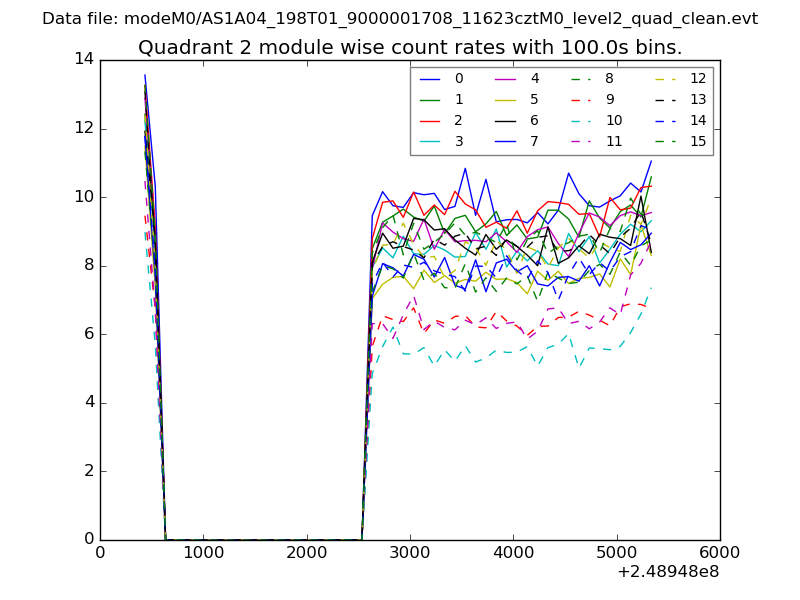
| Module-wise count rates for Quadrant B Data is divided into 100 sec bins |
 |
 |
| Module-wise count rates for Quadrant C Data is divided into 100 sec bins |
 |
 |
| Module-wise count rates for Quadrant D Data is divided into 100 sec bins |
 |
 |
| Parameter | Plot |
|---|---|
| CZT HV Monitor | 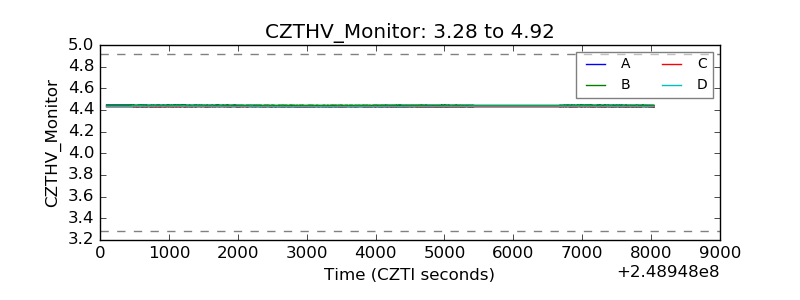 |
| D_VDD | 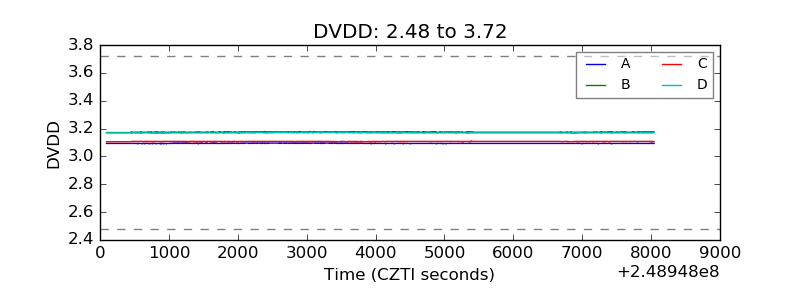 |
| Temperature 1 | 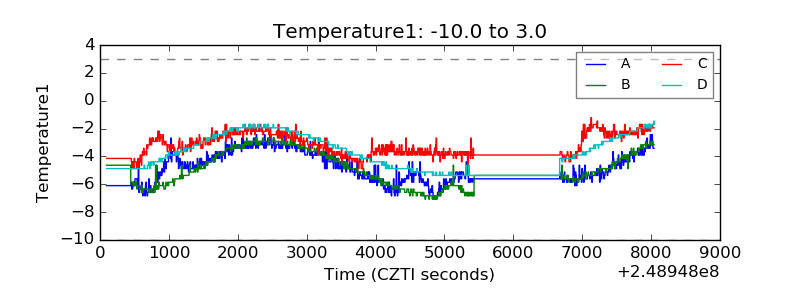 |
| Veto HV Monitor | 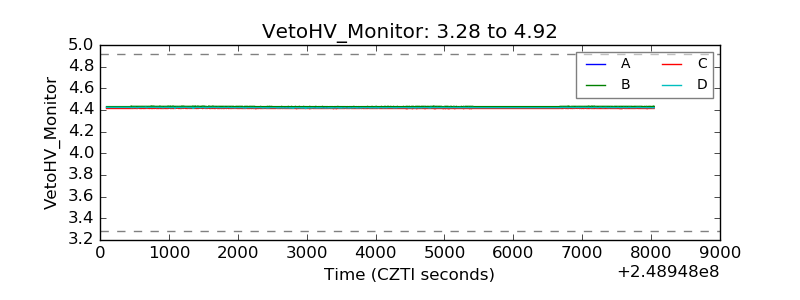 |
| Veto LLD | 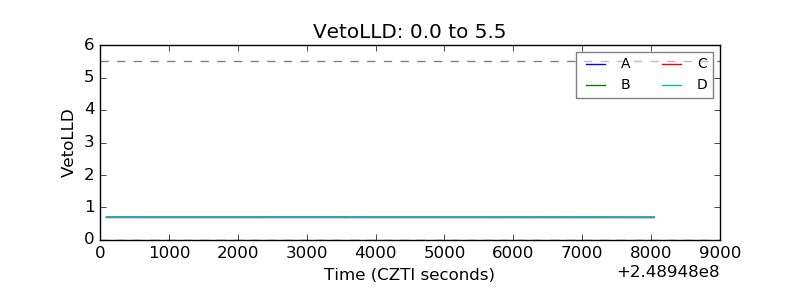 |
| Alpha Counter | 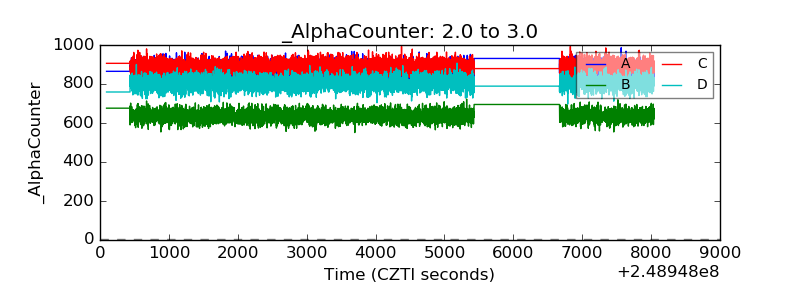 |
| _CPM_Rate | 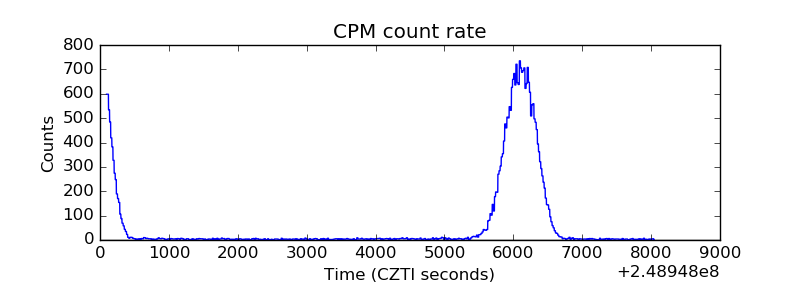 |
| CZT Counter | 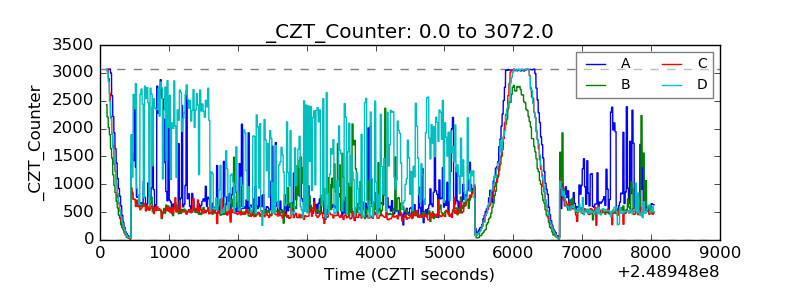 |
| +2.5 Volts monitor |  |
| +5 Volts monitor |  |
| _ROLL_ROT |  |
| _Roll_DEC | 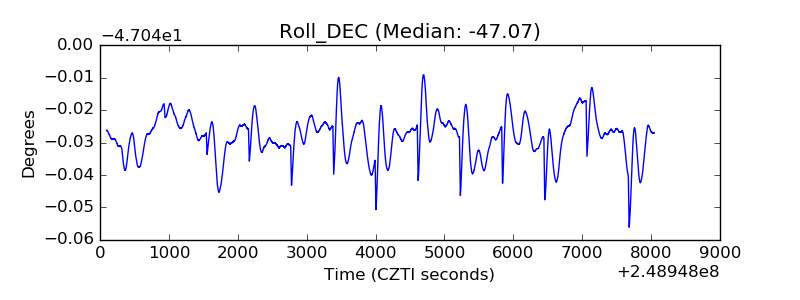 |
| _Roll_RA | 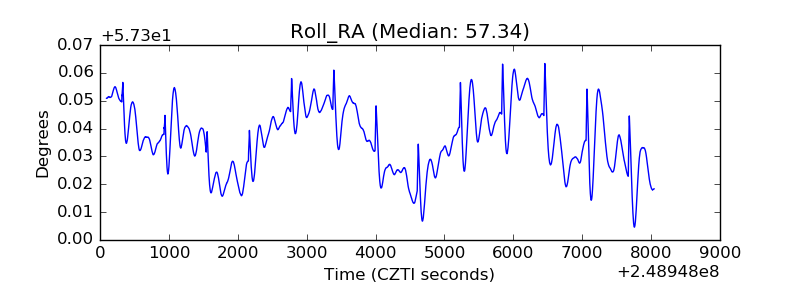 |
| Veto Counter | 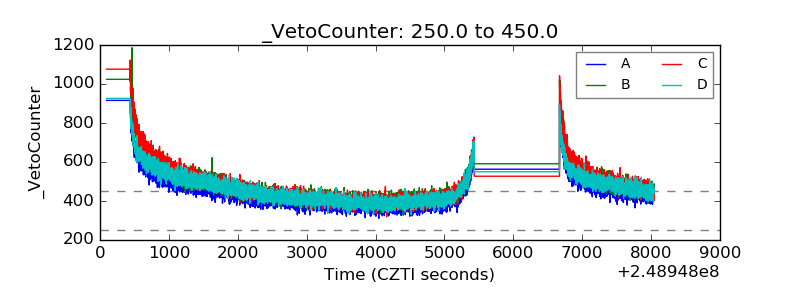 |