| Param | Original file | Final file |
|---|---|---|
| Filename | modeM0/AS1A04_198T01_9000001708_11625cztM0_level2.evt | modeM0/AS1A04_198T01_9000001708_11625cztM0_level2_quad_clean.evt |
| Size (bytes) | 592,781,760 | 88,263,360 |
| Size | 565.3 MB | 84.2 MB |
| Events in quadrant A | 5,672,859 | 533,719 |
| Events in quadrant B | 4,445,322 | 552,367 |
| Events in quadrant C | 3,436,971 | 554,225 |
| Events in quadrant D | 3,911,774 | 533,736 |
| Mode SS | |||
|---|---|---|---|
| Quadrant | BADHDUFLAG | Total packets | Discarded packets |
| A | 0 | 144 | 0 |
| B | 0 | 144 | 0 |
| C | 0 | 144 | 0 |
| D | 0 | 144 | 0 |
| Mode M0 | |||
|---|---|---|---|
| Quadrant | BADHDUFLAG | Total packets | Discarded packets |
| A | 0 | 21659 | 3 |
| B | 0 | 17814 | 2 |
| C | 0 | 15136 | 2 |
| D | 0 | 16515 | 2 |
| Mode M9 | |||
|---|---|---|---|
| Quadrant | BADHDUFLAG | Total packets | Discarded packets |
| A | 0 | 19 | 0 |
| B | 0 | 19 | 0 |
| C | 0 | 19 | 0 |
| D | 0 | 19 | 0 |
| Quadrant | Total seconds | Saturated seconds | Saturation percentage |
|---|---|---|---|
| A | 7170 | 808 | 11.269177% |
| B | 7170 | 558 | 7.782427% |
| C | 7170 | 249 | 3.472803% |
| D | 7170 | 346 | 4.825662% |
Noise dominated data is calculated using 1-second bins in cleaned event files. If a bin has >2000 counts, and if more than 50% of those come from <1% of pixels, then it is considered to be noise-dominated and hence unusable.
| Quadrant | # 1 sec bins | Bins with >0 counts | Bins with >2000 counts | High rate bins dominated by noise | Noise dominated (total time) | Noise dominated (detector-on time) | Marked lightcurve |
|---|---|---|---|---|---|---|---|
| A | 8951 | 7173 | 244 | 244 | 2.73% | 3.40% | 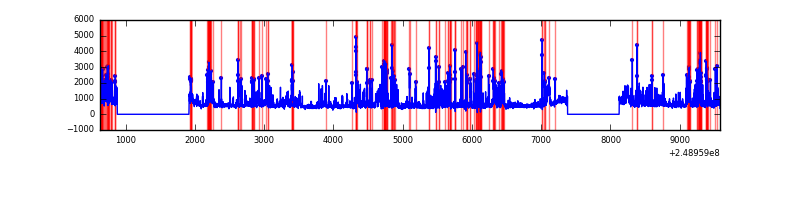 |
| B | 8951 | 7173 | 136 | 136 | 1.52% | 1.90% | 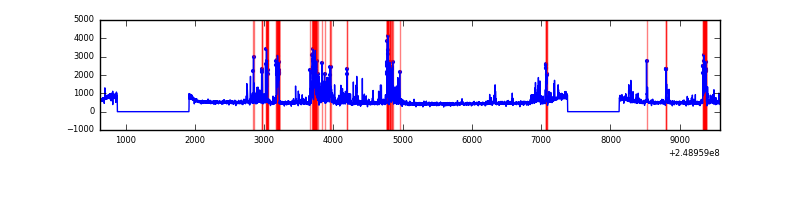 |
| C | 8951 | 7173 | 0 | 0 | 0.00% | 0.00% | 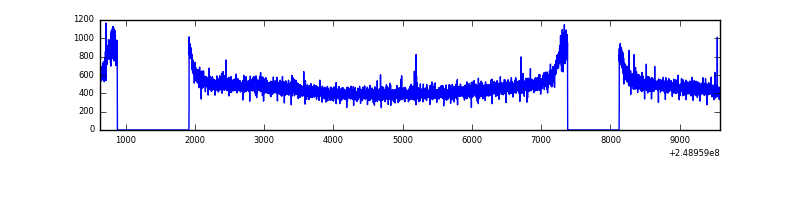 |
| D | 8951 | 7173 | 47 | 47 | 0.53% | 0.66% | 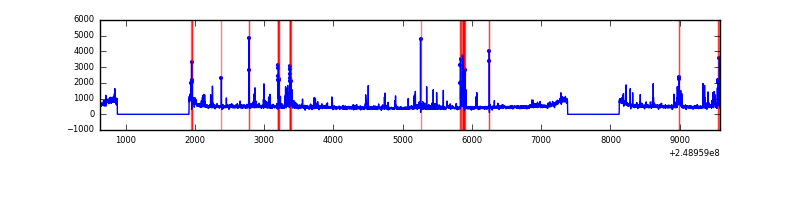 |
Top three noisy pixels from each quadrant. If the there are fewer than three noisy pixels in the level2.evt file, extra rows are filled as -1
| Pixel properties | Quadrant properties | ||||||
|---|---|---|---|---|---|---|---|
| Quadrant | DetID | PixID | Counts | Sigma | Mean | Median | Sigma |
| A | 8 | 5 | 2032466 | 11485.34 | 872 | 853 | 176.9 |
| A | 1 | 162 | 108511 | 608.62 | 872 | 853 | 176.9 |
| A | 1 | 178 | 59064 | 329.08 | 872 | 853 | 176.9 |
| B | 4 | 239 | 855107 | 4996.1 | 889 | 865 | 171.0 |
| B | 11 | 51 | 94491 | 547.58 | 889 | 865 | 171.0 |
| B | 15 | 204 | 26542 | 150.17 | 889 | 865 | 171.0 |
| C | 13 | 61 | 6477 | 27.5 | 880 | 885 | 203.3 |
| C | 14 | 234 | 3464 | 12.68 | 880 | 885 | 203.3 |
| C | 3 | 202 | 2077 | 5.86 | 880 | 885 | 203.3 |
| D | 10 | 199 | 114732 | 541.05 | 878 | 852 | 210.5 |
| D | 13 | 172 | 97710 | 460.17 | 878 | 852 | 210.5 |
| D | 1 | 52 | 74178 | 348.37 | 878 | 852 | 210.5 |
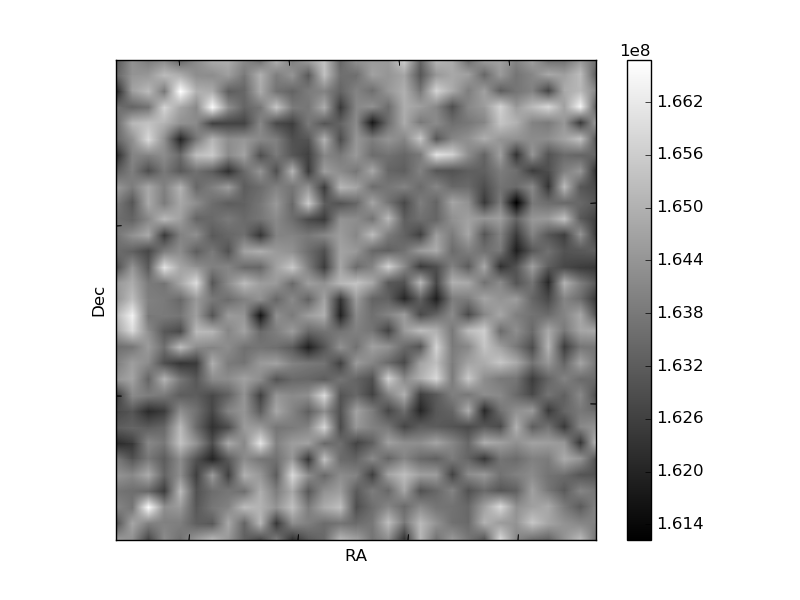
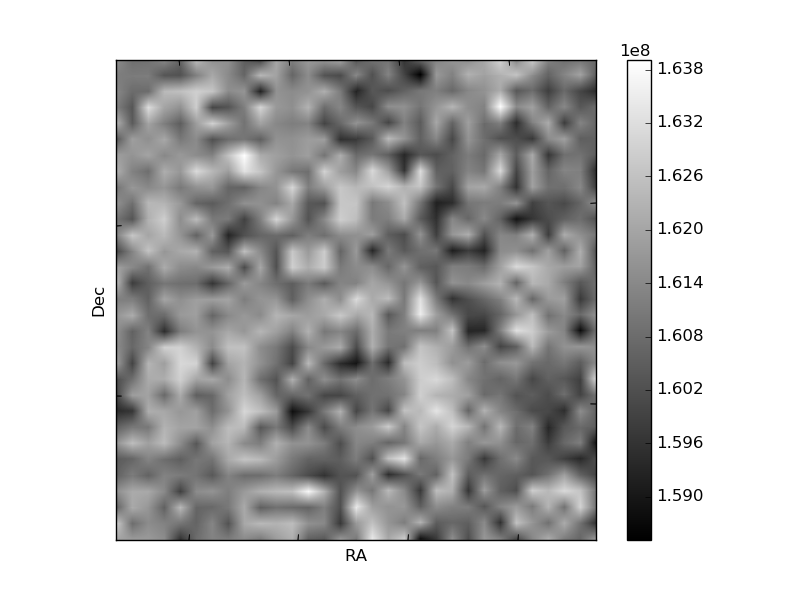
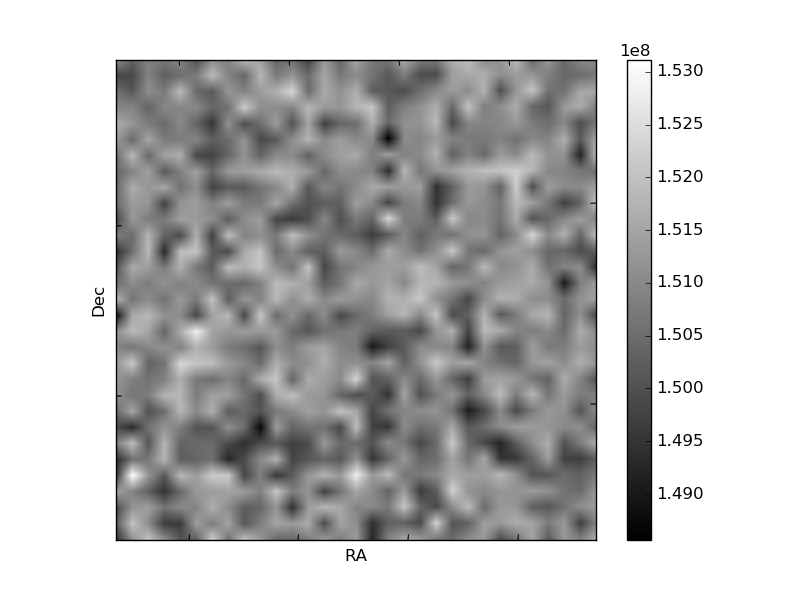
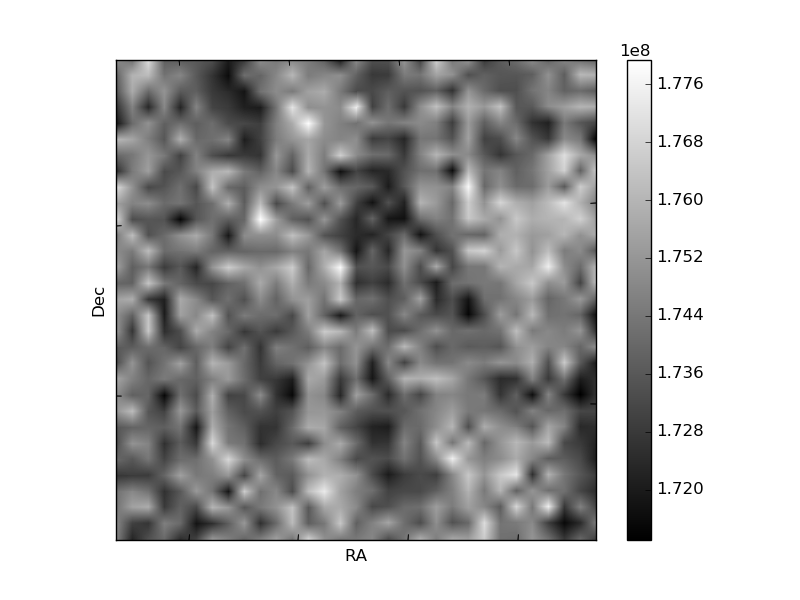
Histogram calculated using DETX and DETY for each event in the final _common_clean file
| Quadrant A | 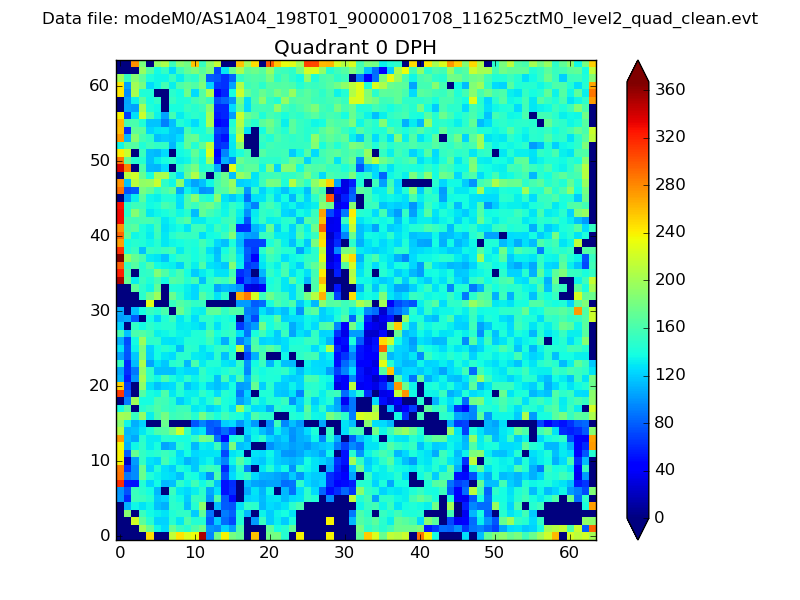 |
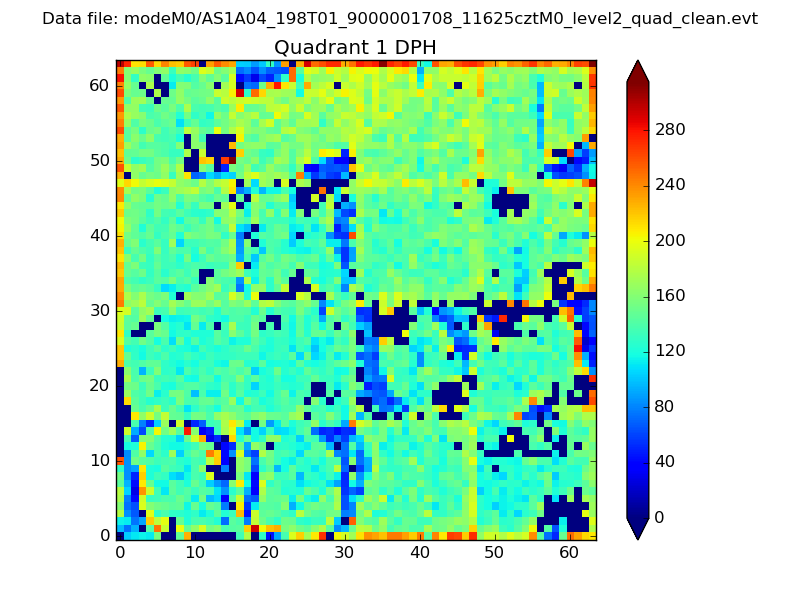 |
Quadrant B |
|---|---|---|---|
| Quadrant D | 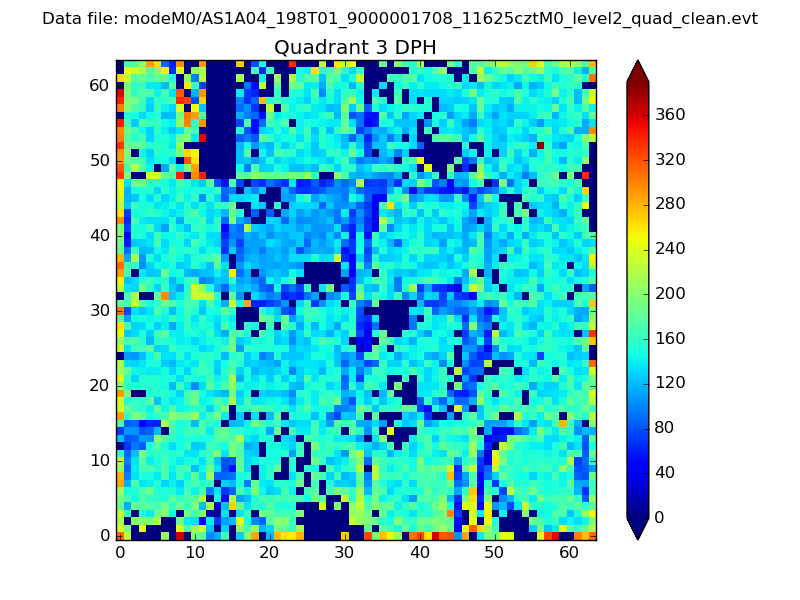 |
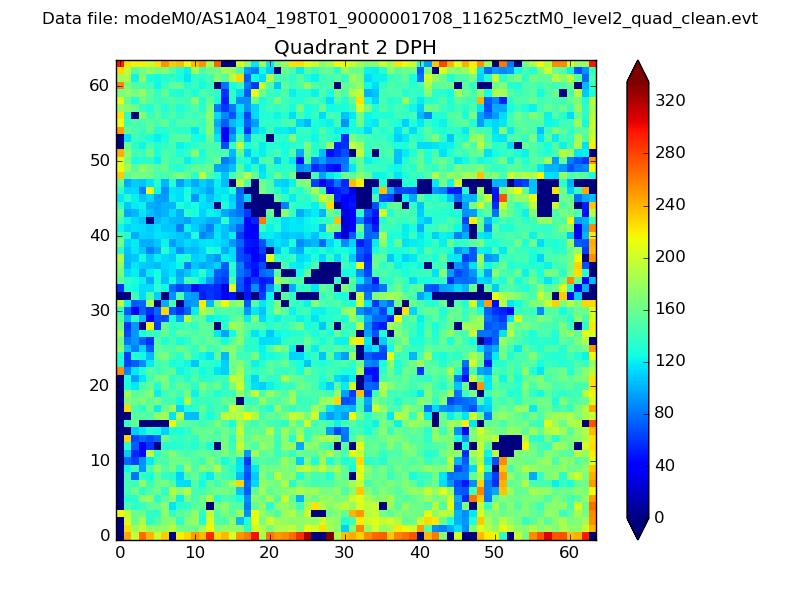 |
Quadrant C |
| Plot type | Count rate plots | Images |
|---|---|---|
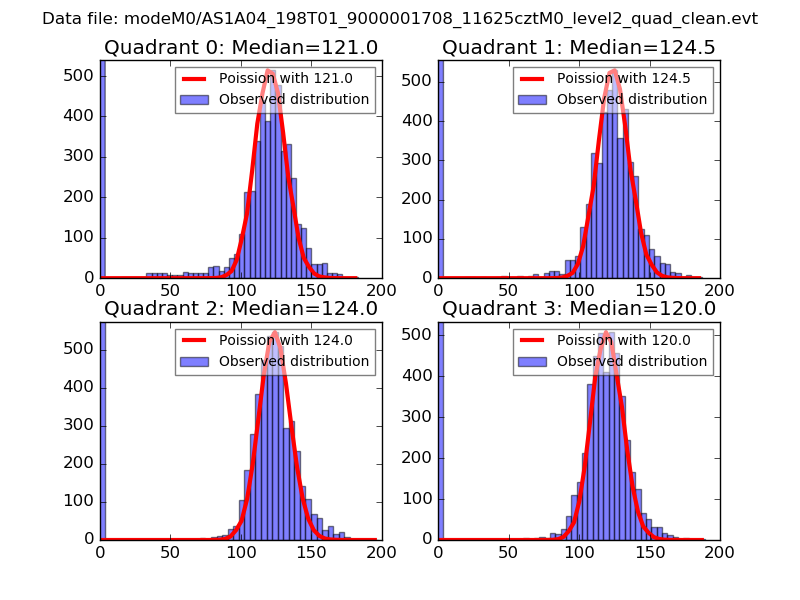
| Comparison with Poisson distribution Blue bars denote a histogram of data divided into 1 sec bins. Red curve is a Poisson curve with rate = median count rate of data. |
 |
 |
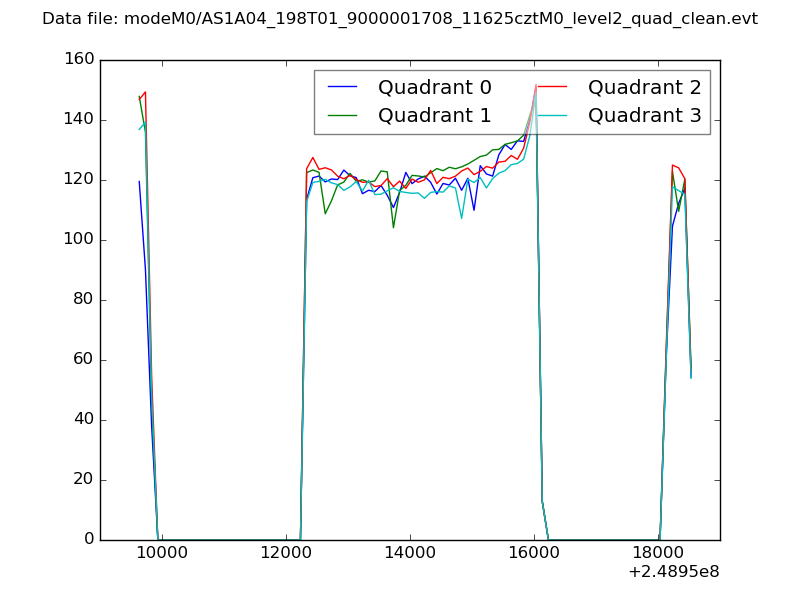
| Quadrant-wise count rates Data is divided into 100 sec bins |
 |
|
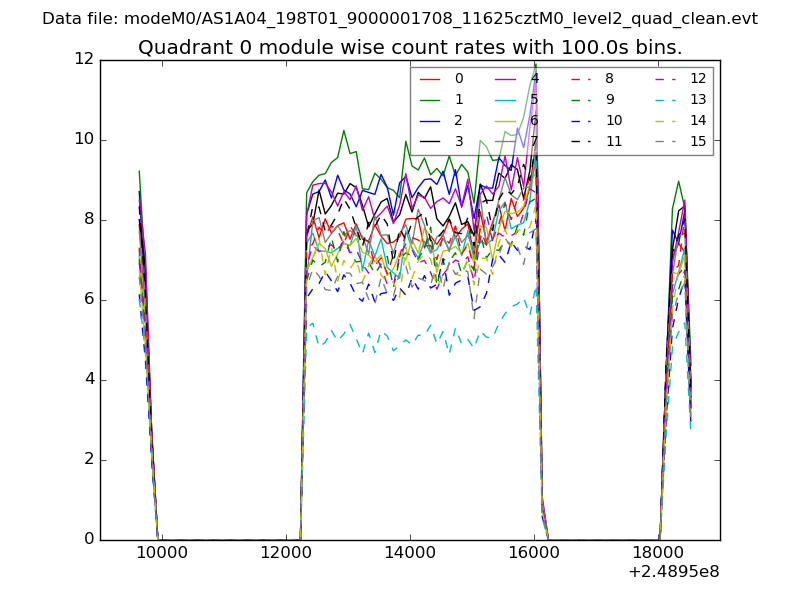
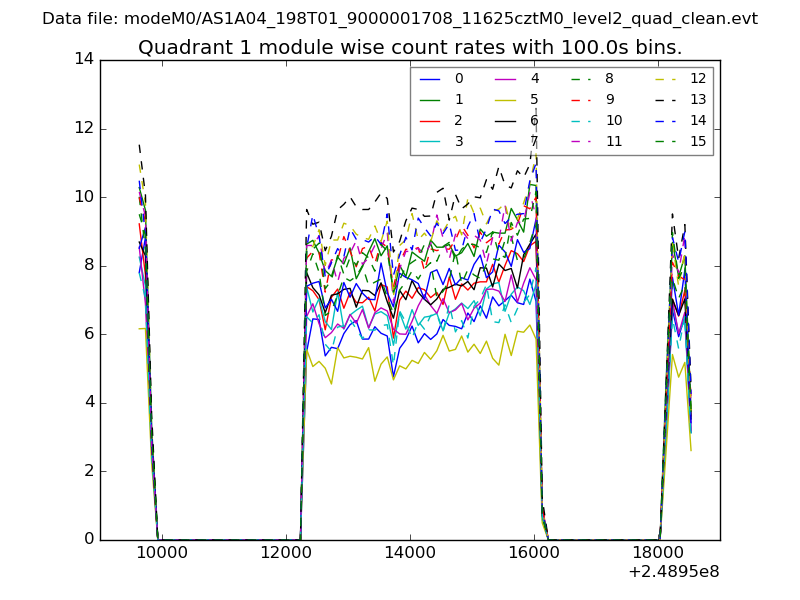
| Module-wise count rates for Quadrant A Data is divided into 100 sec bins |
 |
 |
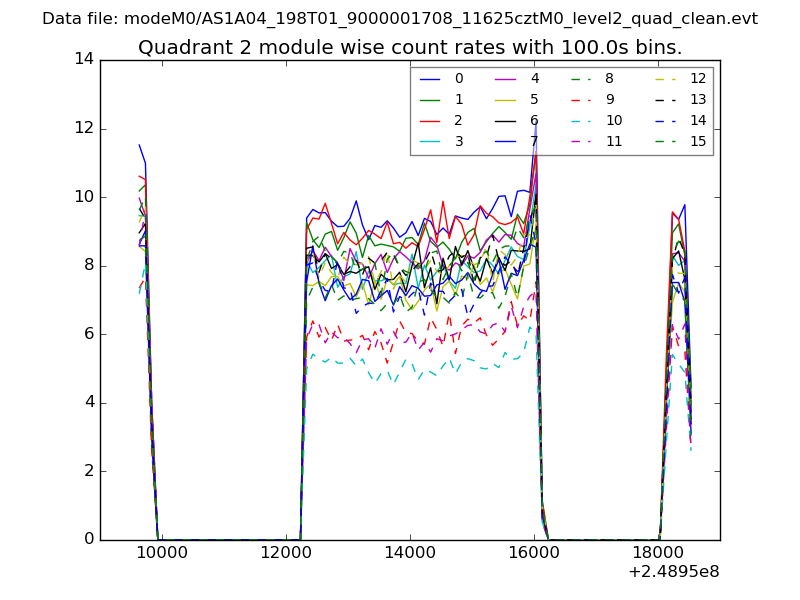
| Module-wise count rates for Quadrant B Data is divided into 100 sec bins |
 |
 |
| Module-wise count rates for Quadrant C Data is divided into 100 sec bins |
 |
 |
| Module-wise count rates for Quadrant D Data is divided into 100 sec bins |
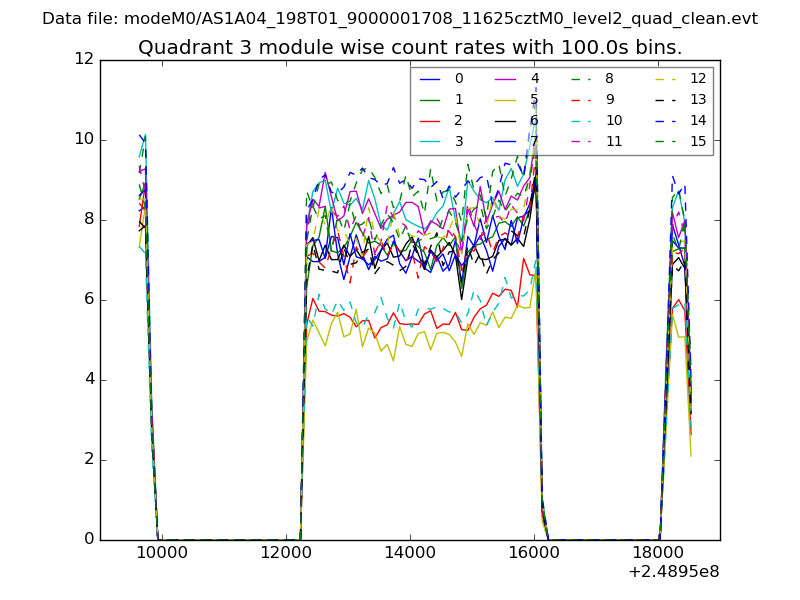 |
 |
| Parameter | Plot |
|---|---|
| CZT HV Monitor | 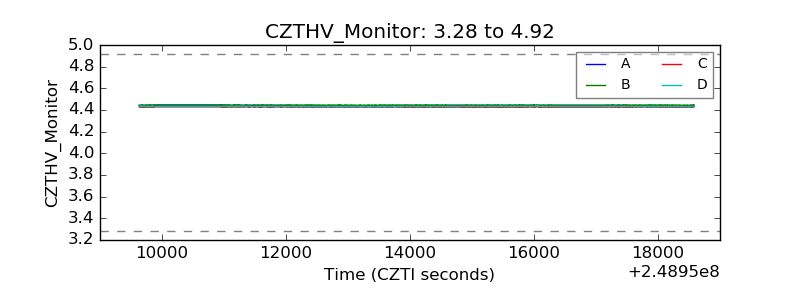 |
| D_VDD | 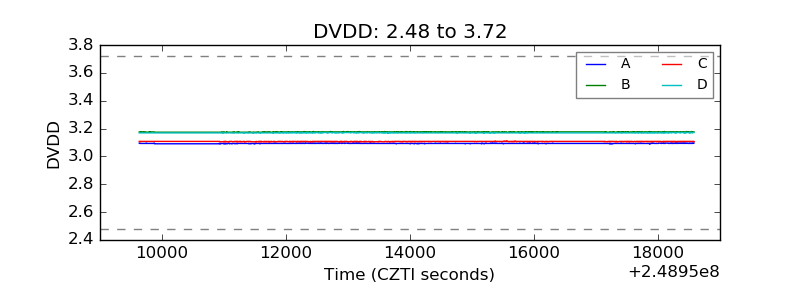 |
| Temperature 1 | 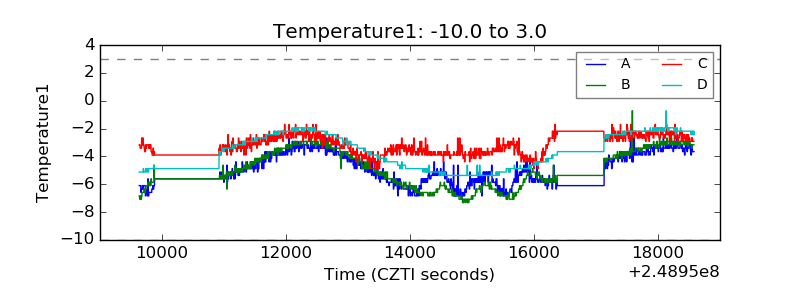 |
| Veto HV Monitor | 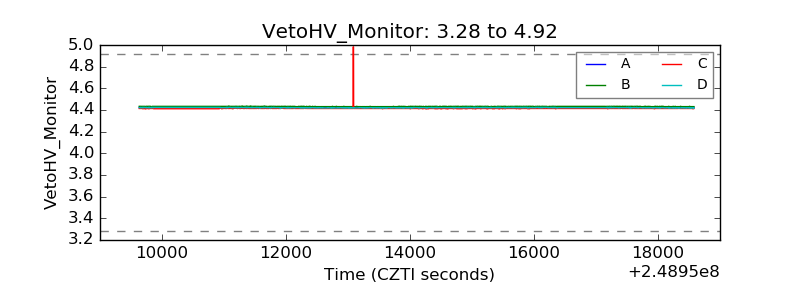 |
| Veto LLD | 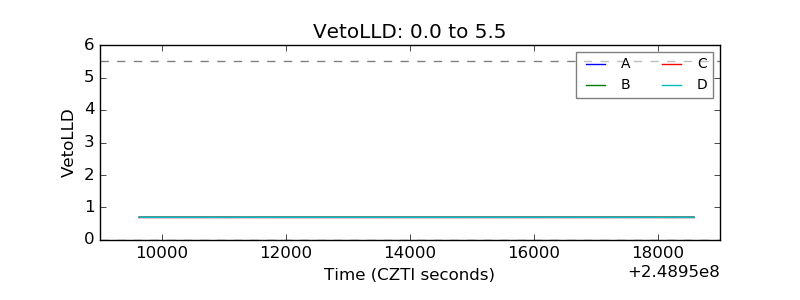 |
| Alpha Counter | 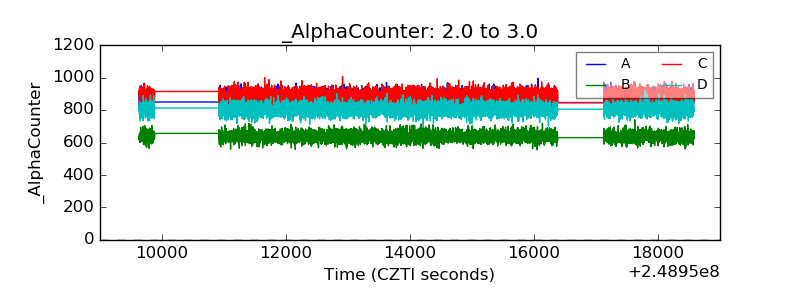 |
| _CPM_Rate | 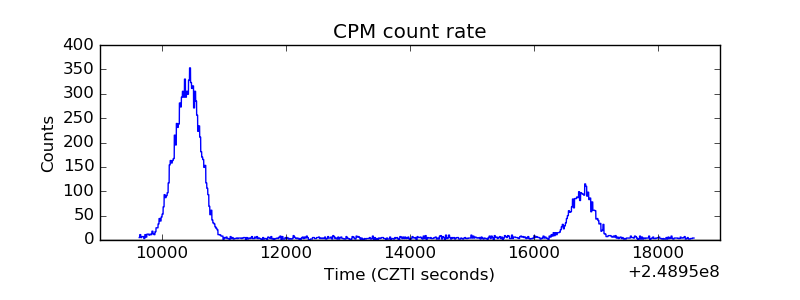 |
| CZT Counter | 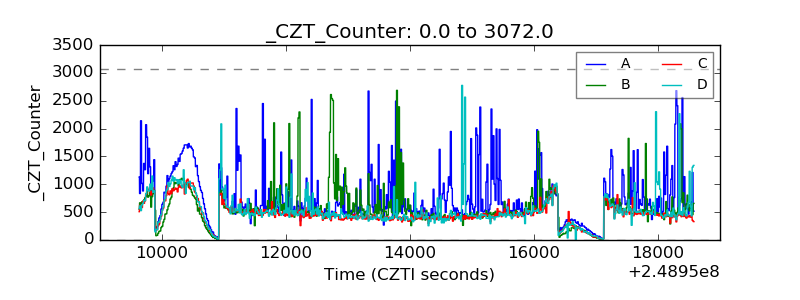 |
| +2.5 Volts monitor |  |
| +5 Volts monitor |  |
| _ROLL_ROT | 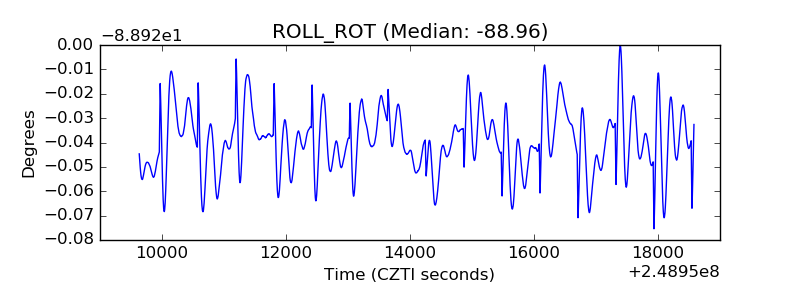 |
| _Roll_DEC | 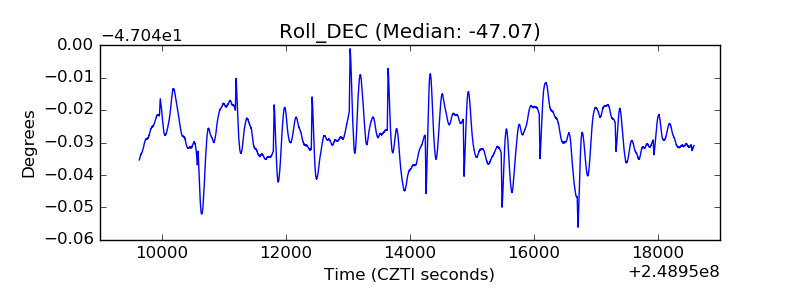 |
| _Roll_RA | 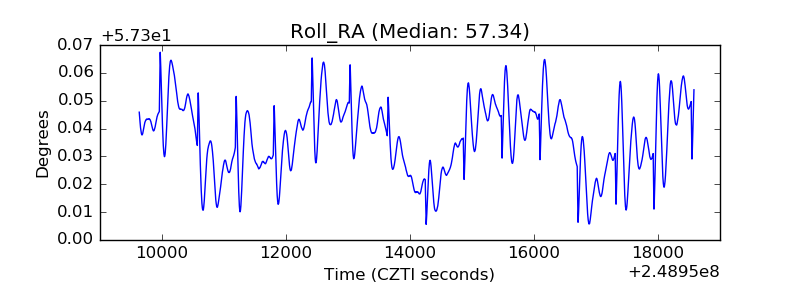 |
| Veto Counter | 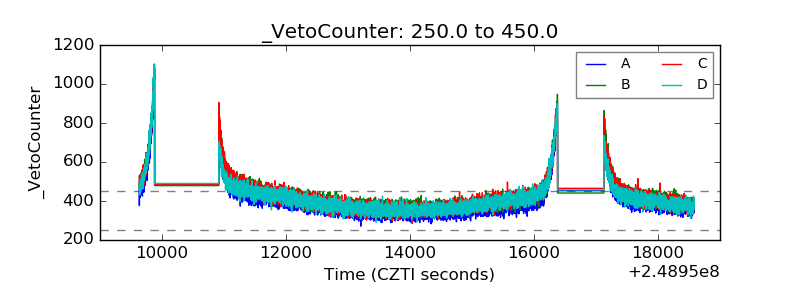 |