| Param | Original file | Final file |
|---|---|---|
| Filename | modeM0/AS1A04_198T01_9000001708_11626cztM0_level2.evt | modeM0/AS1A04_198T01_9000001708_11626cztM0_level2_quad_clean.evt |
| Size (bytes) | 669,588,480 | 93,792,960 |
| Size | 638.6 MB | 89.4 MB |
| Events in quadrant A | 6,760,485 | 568,192 |
| Events in quadrant B | 4,826,748 | 581,712 |
| Events in quadrant C | 3,649,011 | 583,125 |
| Events in quadrant D | 4,511,418 | 562,169 |
| Mode SS | |||
|---|---|---|---|
| Quadrant | BADHDUFLAG | Total packets | Discarded packets |
| A | 0 | 160 | 0 |
| B | 0 | 160 | 0 |
| C | 0 | 160 | 0 |
| D | 0 | 160 | 0 |
| Mode M0 | |||
|---|---|---|---|
| Quadrant | BADHDUFLAG | Total packets | Discarded packets |
| A | 0 | 25537 | 3 |
| B | 0 | 19461 | 2 |
| C | 0 | 16415 | 2 |
| D | 0 | 18764 | 2 |
| Mode M9 | |||
|---|---|---|---|
| Quadrant | BADHDUFLAG | Total packets | Discarded packets |
| A | 0 | 12 | 0 |
| B | 0 | 12 | 0 |
| C | 0 | 12 | 0 |
| D | 0 | 12 | 0 |
| Quadrant | Total seconds | Saturated seconds | Saturation percentage |
|---|---|---|---|
| A | 7840 | 893 | 11.390306% |
| B | 7840 | 490 | 6.250000% |
| C | 7840 | 159 | 2.028061% |
| D | 7840 | 275 | 3.507653% |
Noise dominated data is calculated using 1-second bins in cleaned event files. If a bin has >2000 counts, and if more than 50% of those come from <1% of pixels, then it is considered to be noise-dominated and hence unusable.
| Quadrant | # 1 sec bins | Bins with >0 counts | Bins with >2000 counts | High rate bins dominated by noise | Noise dominated (total time) | Noise dominated (detector-on time) | Marked lightcurve |
|---|---|---|---|---|---|---|---|
| A | 9001 | 7843 | 284 | 284 | 3.16% | 3.62% | 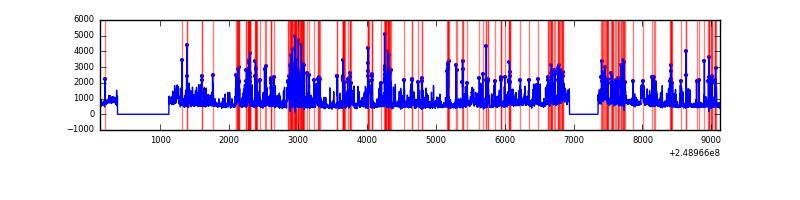 |
| B | 9001 | 7843 | 114 | 114 | 1.27% | 1.45% | 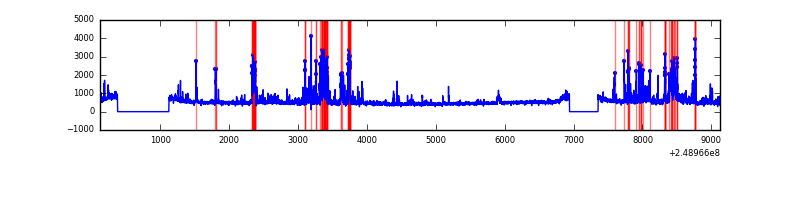 |
| C | 9001 | 7843 | 0 | 0 | 0.00% | 0.00% | 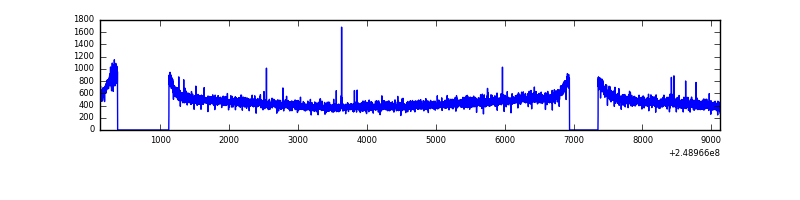 |
| D | 9001 | 7843 | 75 | 75 | 0.83% | 0.96% | 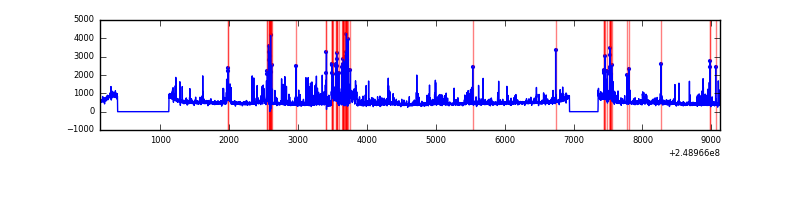 |
Top three noisy pixels from each quadrant. If the there are fewer than three noisy pixels in the level2.evt file, extra rows are filled as -1
| Pixel properties | Quadrant properties | ||||||
|---|---|---|---|---|---|---|---|
| Quadrant | DetID | PixID | Counts | Sigma | Mean | Median | Sigma |
| A | 8 | 5 | 2714861 | 14365.56 | 930 | 907 | 188.9 |
| A | 1 | 162 | 165825 | 872.95 | 930 | 907 | 188.9 |
| A | 1 | 178 | 99583 | 522.31 | 930 | 907 | 188.9 |
| B | 4 | 239 | 850103 | 4662.34 | 949 | 924 | 182.1 |
| B | 11 | 51 | 136162 | 742.51 | 949 | 924 | 182.1 |
| B | 3 | 64 | 69398 | 375.95 | 949 | 924 | 182.1 |
| C | 13 | 61 | 6853 | 27.55 | 933 | 935 | 214.8 |
| C | 14 | 234 | 6415 | 25.51 | 933 | 935 | 214.8 |
| C | 9 | 54 | 3998 | 14.26 | 933 | 935 | 214.8 |
| D | 1 | 52 | 429462 | 1932.11 | 924 | 896 | 221.8 |
| D | 13 | 152 | 134305 | 601.45 | 924 | 896 | 221.8 |
| D | 10 | 253 | 98348 | 439.34 | 924 | 896 | 221.8 |
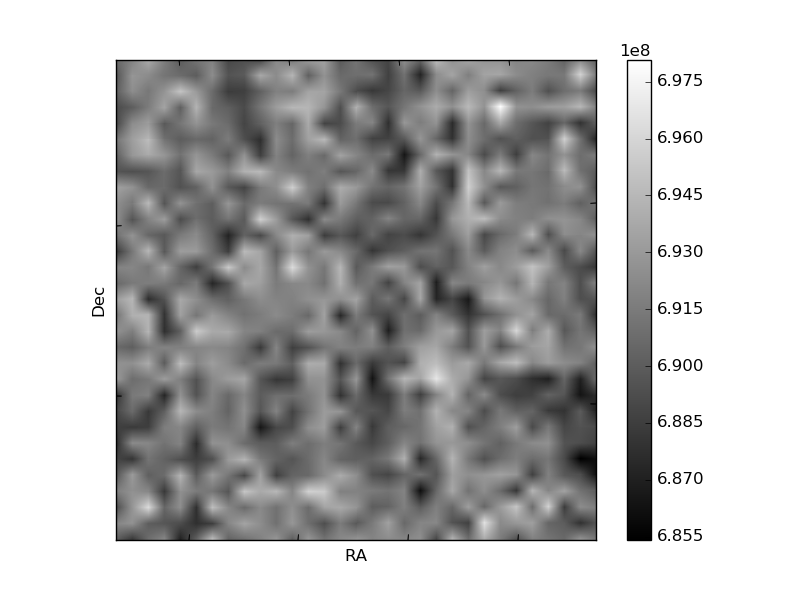
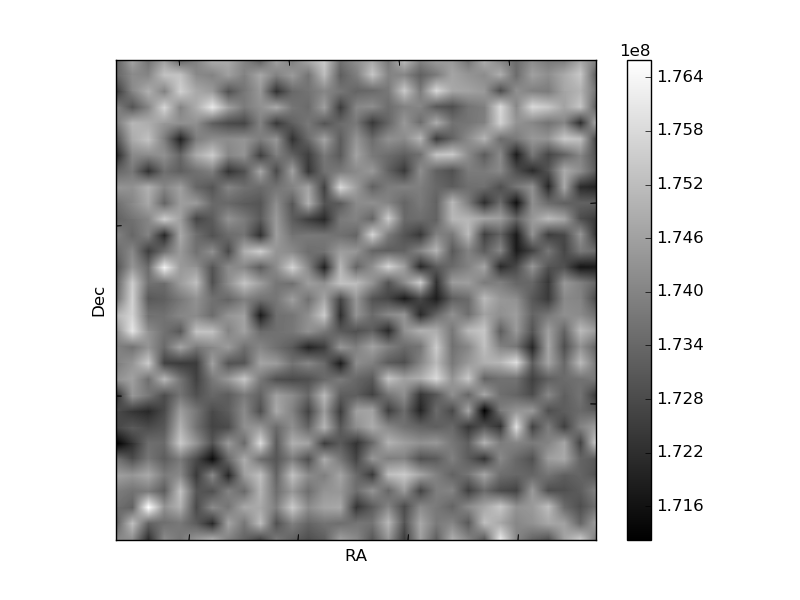
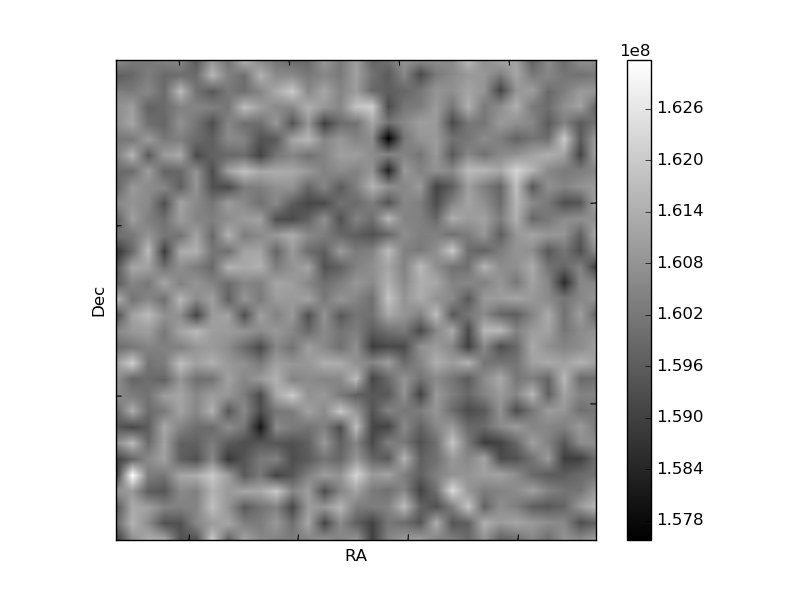
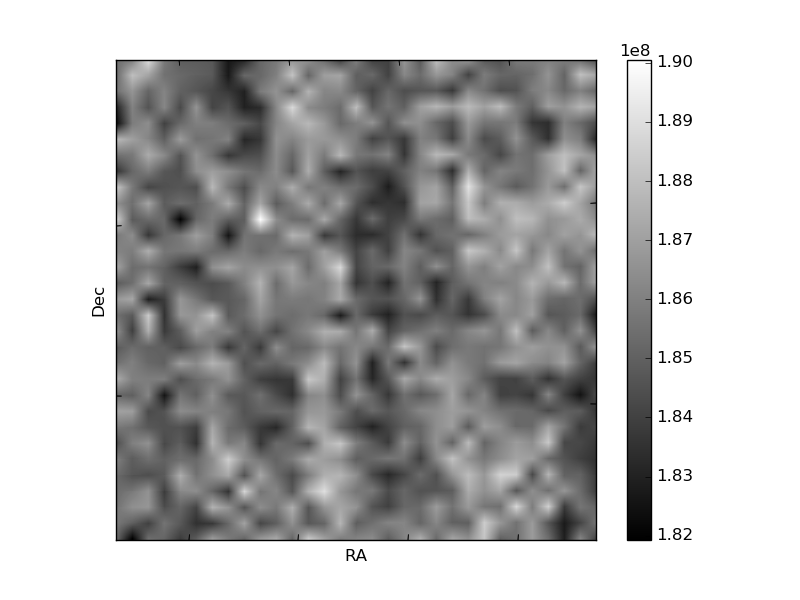
Histogram calculated using DETX and DETY for each event in the final _common_clean file
| Quadrant A | 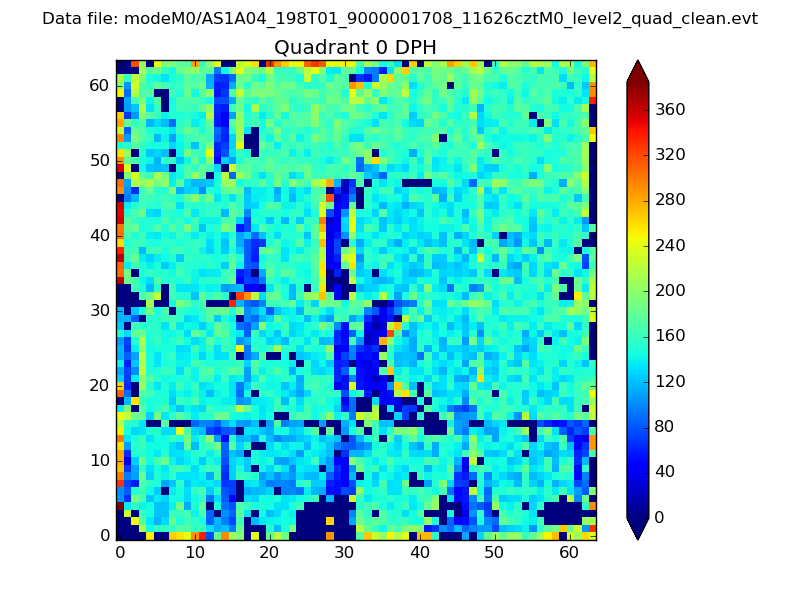 |
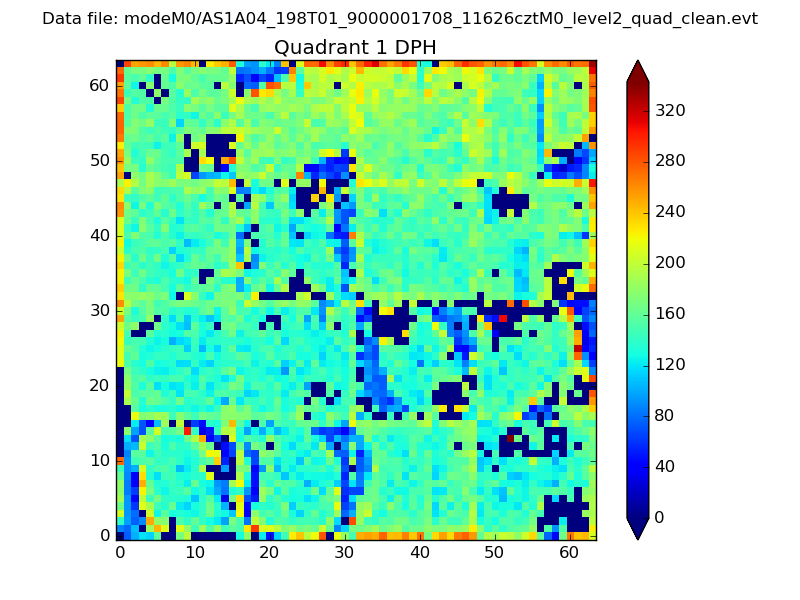 |
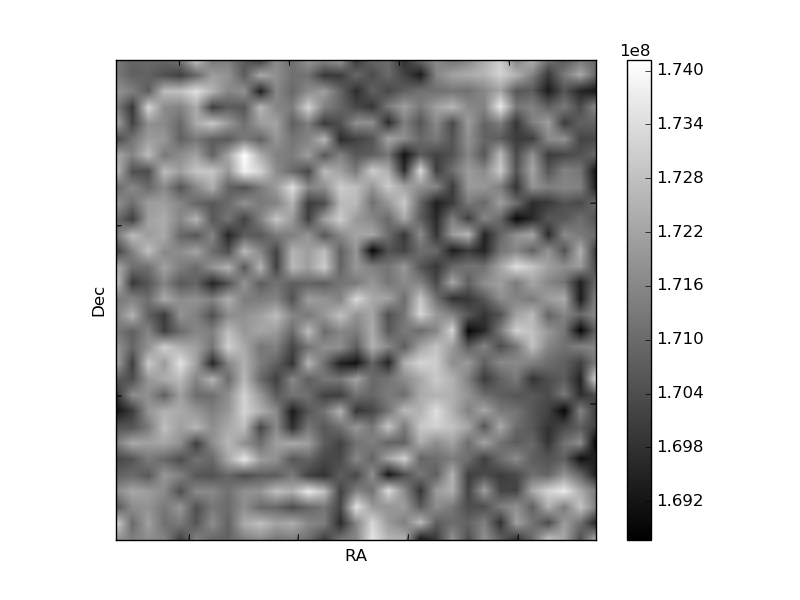
Quadrant B |
|---|---|---|---|
| Quadrant D | 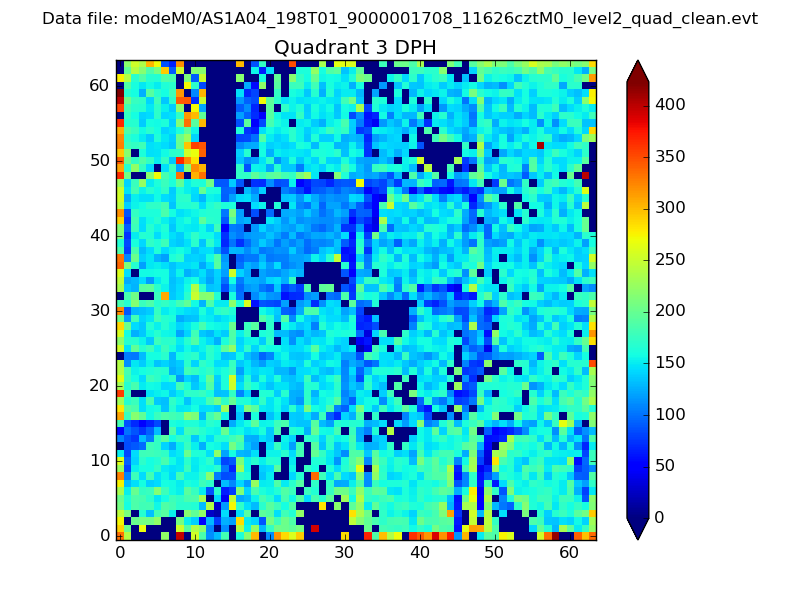 |
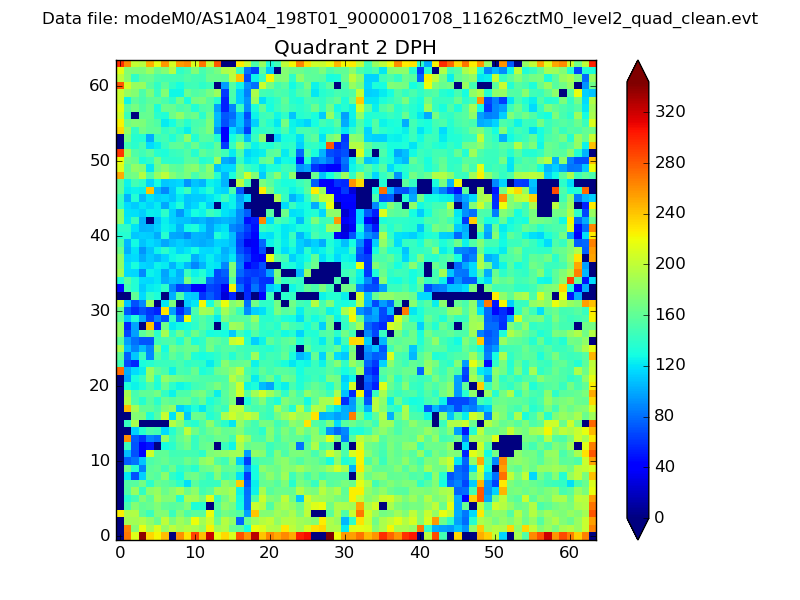 |
Quadrant C |
| Plot type | Count rate plots | Images |
|---|---|---|
| Comparison with Poisson distribution Blue bars denote a histogram of data divided into 1 sec bins. Red curve is a Poisson curve with rate = median count rate of data. |
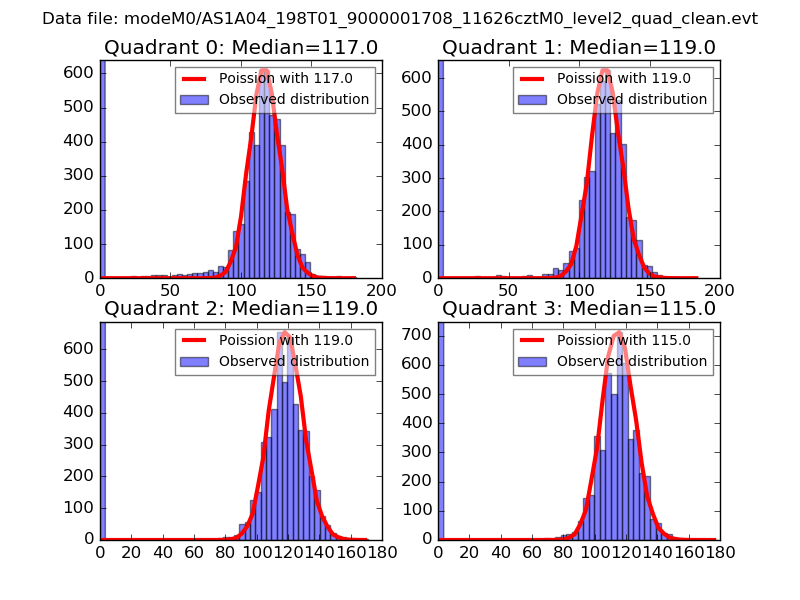 |
 |
| Quadrant-wise count rates Data is divided into 100 sec bins |
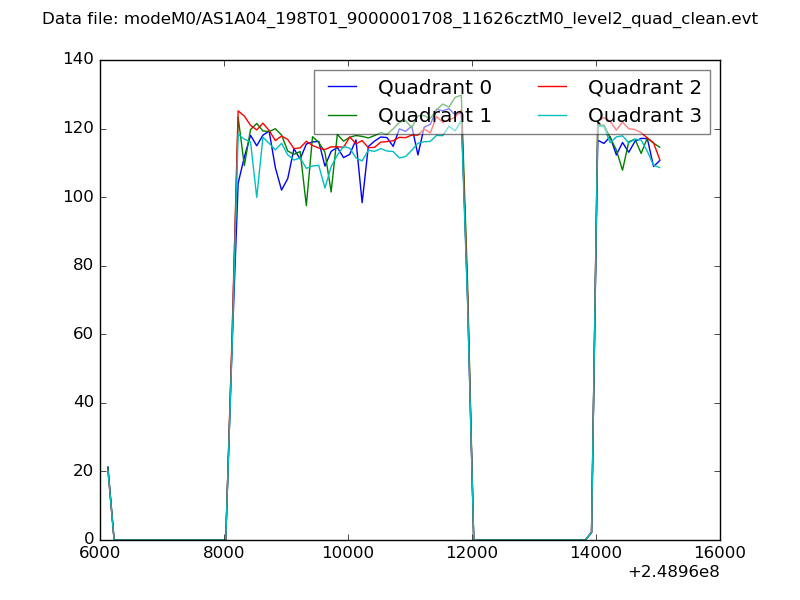 |
|
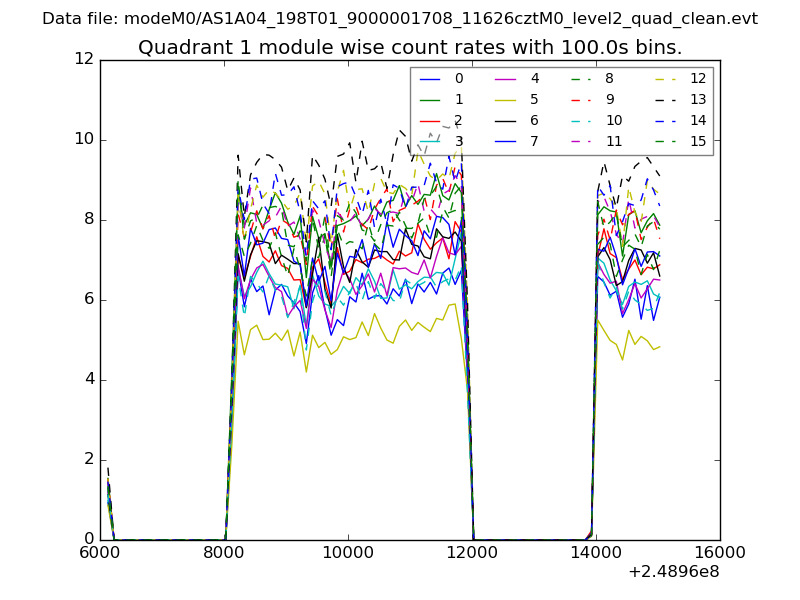
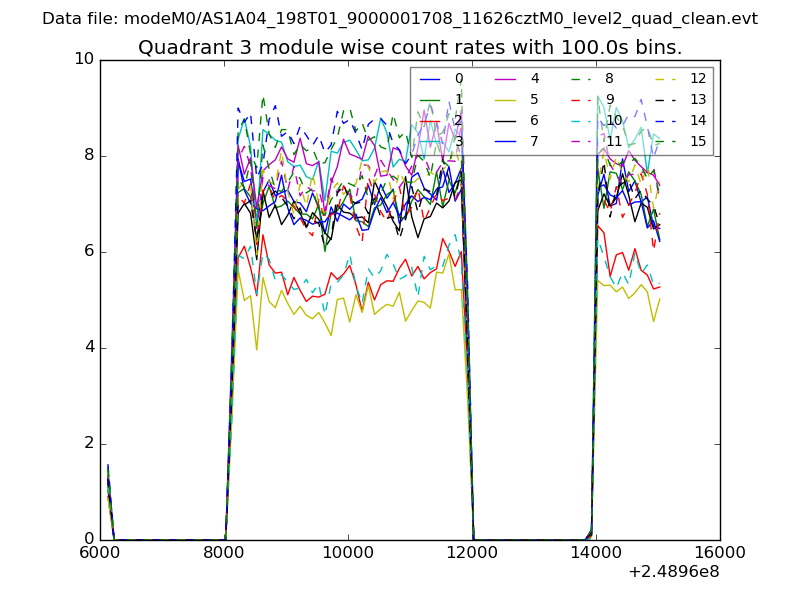
| Module-wise count rates for Quadrant A Data is divided into 100 sec bins |
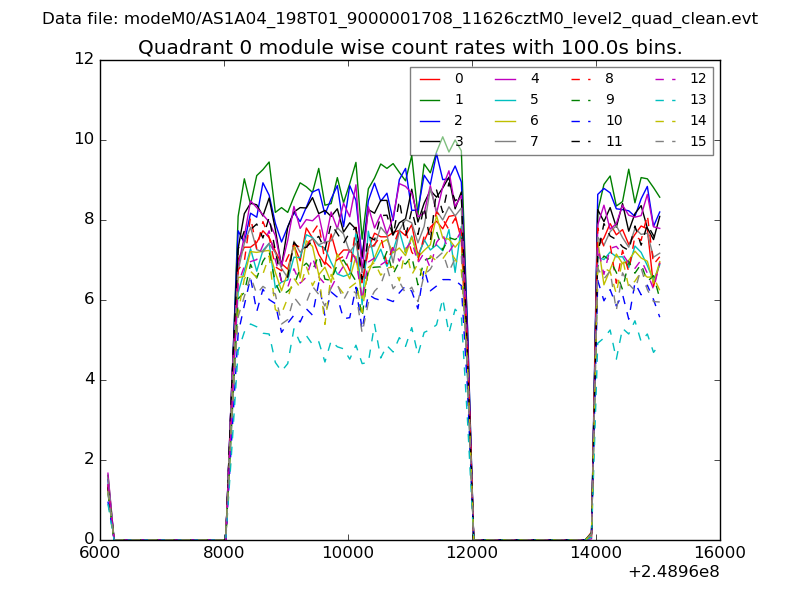 |
 |
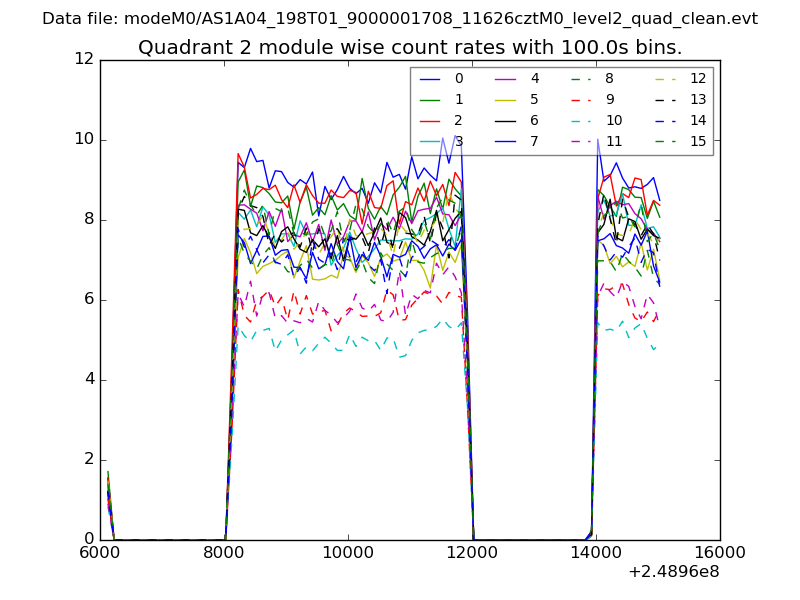
| Module-wise count rates for Quadrant B Data is divided into 100 sec bins |
 |
 |
| Module-wise count rates for Quadrant C Data is divided into 100 sec bins |
 |
 |
| Module-wise count rates for Quadrant D Data is divided into 100 sec bins |
 |
 |
| Parameter | Plot |
|---|---|
| CZT HV Monitor | 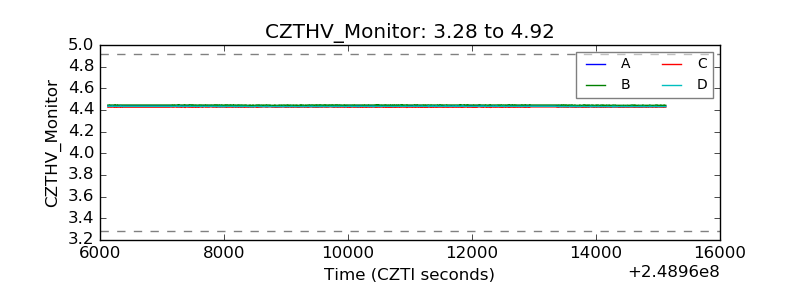 |
| D_VDD | 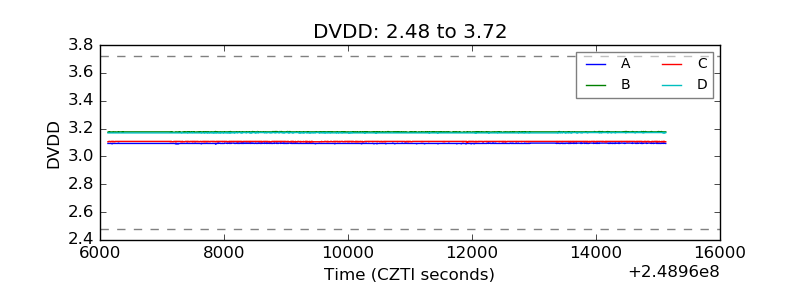 |
| Temperature 1 | 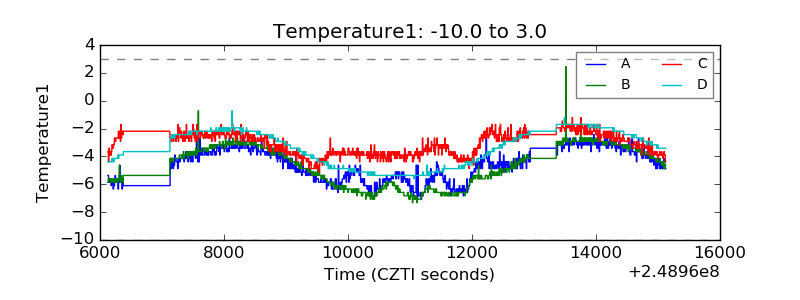 |
| Veto HV Monitor | 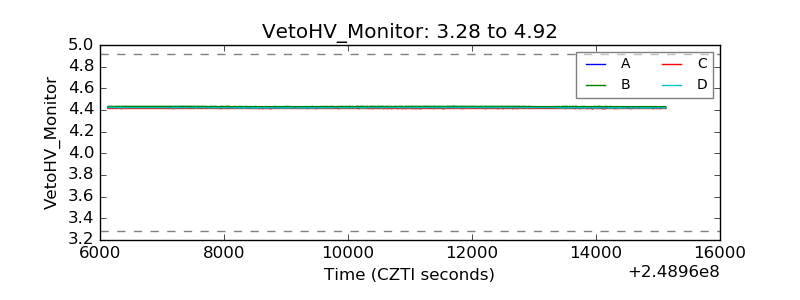 |
| Veto LLD | 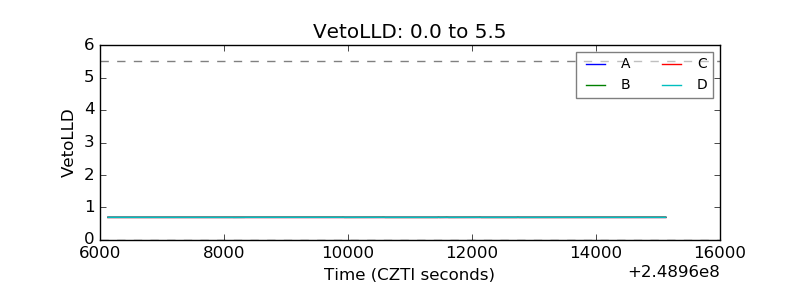 |
| Alpha Counter | 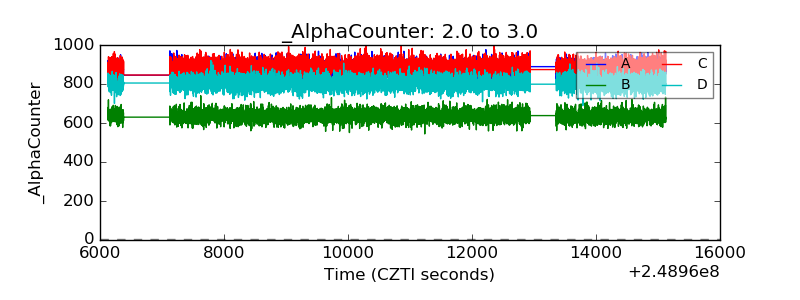 |
| _CPM_Rate | 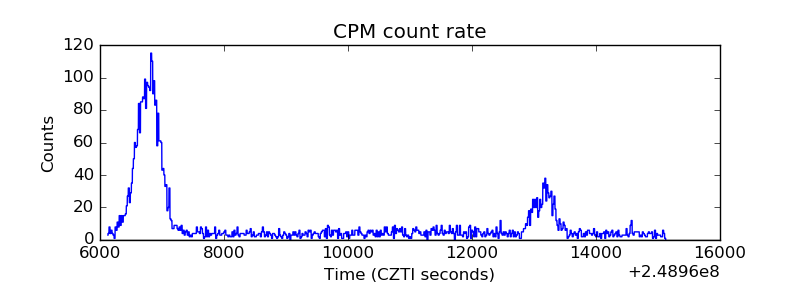 |
| CZT Counter | 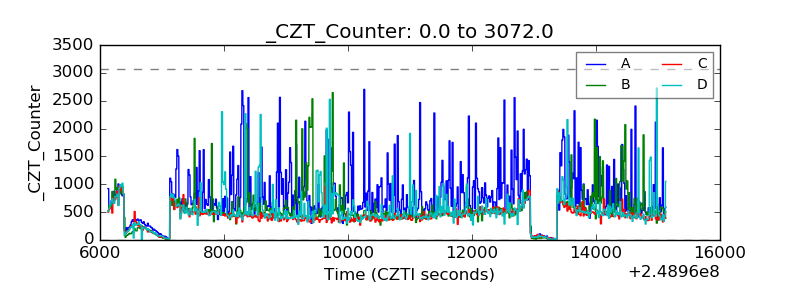 |
| +2.5 Volts monitor | 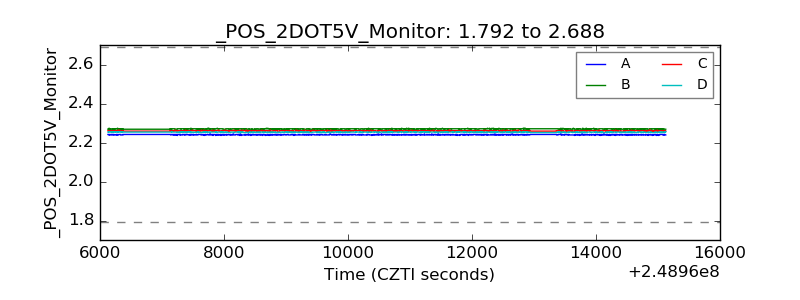 |
| +5 Volts monitor | 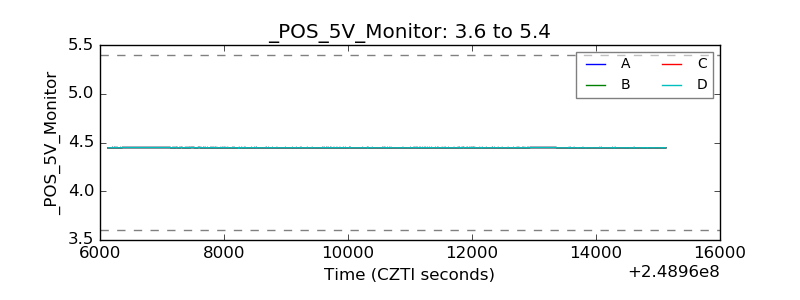 |
| _ROLL_ROT | 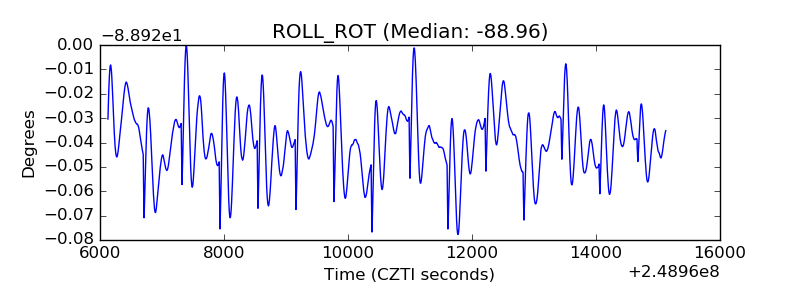 |
| _Roll_DEC | 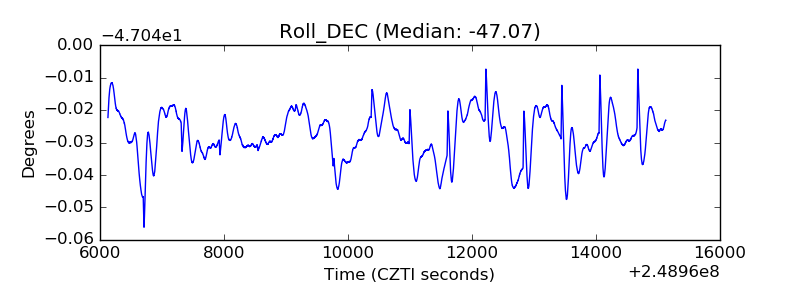 |
| _Roll_RA | 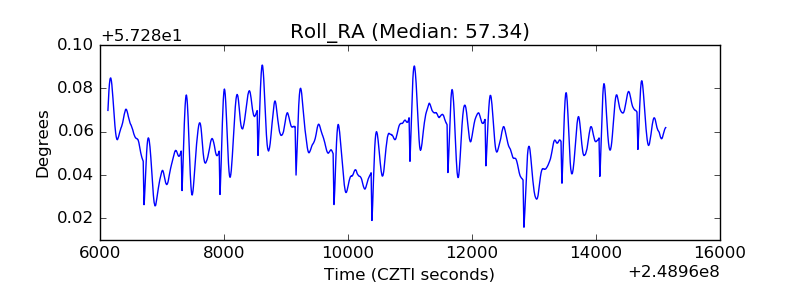 |
| Veto Counter | 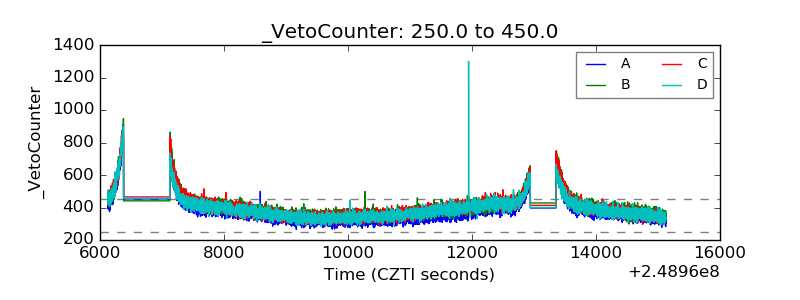 |