| Param | Original file | Final file |
|---|---|---|
| Filename | modeM0/AS1A04_198T01_9000001708_11627cztM0_level2.evt | modeM0/AS1A04_198T01_9000001708_11627cztM0_level2_quad_clean.evt |
| Size (bytes) | 692,677,440 | 98,622,720 |
| Size | 660.6 MB | 94.1 MB |
| Events in quadrant A | 6,891,155 | 605,849 |
| Events in quadrant B | 4,938,304 | 629,845 |
| Events in quadrant C | 3,520,308 | 626,802 |
| Events in quadrant D | 5,097,478 | 578,754 |
| Mode SS | |||
|---|---|---|---|
| Quadrant | BADHDUFLAG | Total packets | Discarded packets |
| A | 0 | 160 | 0 |
| B | 0 | 160 | 0 |
| C | 0 | 160 | 0 |
| D | 0 | 160 | 0 |
| Mode M0 | |||
|---|---|---|---|
| Quadrant | BADHDUFLAG | Total packets | Discarded packets |
| A | 0 | 25841 | 3 |
| B | 0 | 19834 | 2 |
| C | 0 | 16105 | 2 |
| D | 0 | 20716 | 2 |
| Mode M9 | |||
|---|---|---|---|
| Quadrant | BADHDUFLAG | Total packets | Discarded packets |
| A | 0 | 4 | 0 |
| B | 0 | 4 | 0 |
| C | 0 | 4 | 0 |
| D | 0 | 5 | 0 |
| Quadrant | Total seconds | Saturated seconds | Saturation percentage |
|---|---|---|---|
| A | 7833 | 1013 | 12.932465% |
| B | 7833 | 323 | 4.123580% |
| C | 7833 | 30 | 0.382995% |
| D | 7833 | 555 | 7.085408% |
Noise dominated data is calculated using 1-second bins in cleaned event files. If a bin has >2000 counts, and if more than 50% of those come from <1% of pixels, then it is considered to be noise-dominated and hence unusable.
| Quadrant | # 1 sec bins | Bins with >0 counts | Bins with >2000 counts | High rate bins dominated by noise | Noise dominated (total time) | Noise dominated (detector-on time) | Marked lightcurve |
|---|---|---|---|---|---|---|---|
| A | 8093 | 7834 | 467 | 467 | 5.77% | 5.96% | 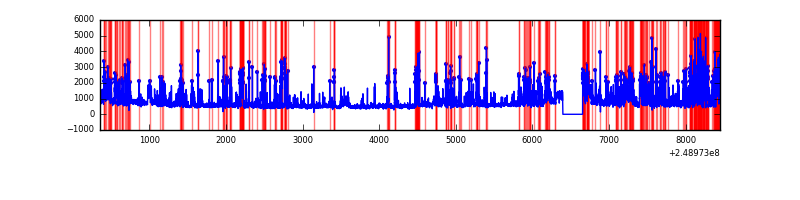 |
| B | 8094 | 7835 | 117 | 117 | 1.45% | 1.49% | 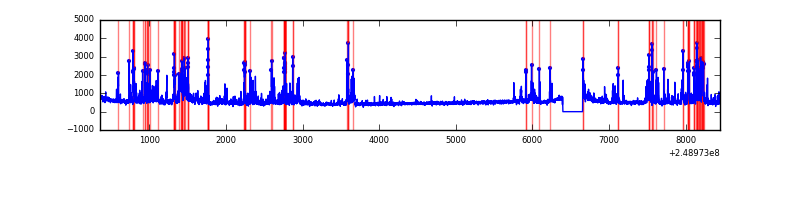 |
| C | 8094 | 7835 | 0 | 0 | 0.00% | 0.00% | 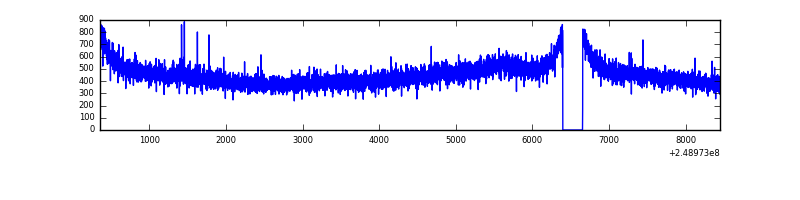 |
| D | 8094 | 7835 | 416 | 416 | 5.14% | 5.31% | 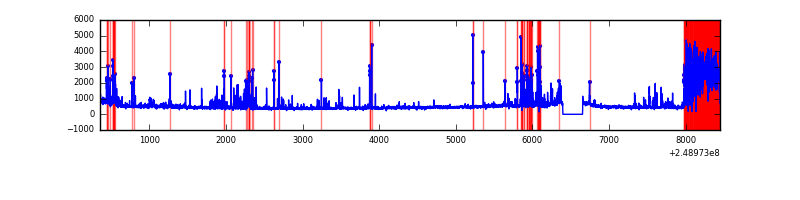 |
Top three noisy pixels from each quadrant. If the there are fewer than three noisy pixels in the level2.evt file, extra rows are filled as -1
| Pixel properties | Quadrant properties | ||||||
|---|---|---|---|---|---|---|---|
| Quadrant | DetID | PixID | Counts | Sigma | Mean | Median | Sigma |
| A | 8 | 5 | 2970813 | 16481.8 | 888 | 867 | 180.2 |
| A | 1 | 162 | 164102 | 905.88 | 888 | 867 | 180.2 |
| A | 1 | 178 | 95743 | 526.52 | 888 | 867 | 180.2 |
| B | 4 | 239 | 1052272 | 5942.48 | 921 | 895 | 176.9 |
| B | 11 | 51 | 170531 | 958.8 | 921 | 895 | 176.9 |
| B | 15 | 204 | 59955 | 333.81 | 921 | 895 | 176.9 |
| C | 13 | 61 | 6506 | 26.87 | 900 | 901 | 208.6 |
| C | 14 | 234 | 6432 | 26.51 | 900 | 901 | 208.6 |
| C | 8 | 128 | 4395 | 16.75 | 900 | 901 | 208.6 |
| D | 7 | 80 | 1078987 | 5187.07 | 865 | 840 | 207.9 |
| D | 10 | 199 | 222013 | 1064.08 | 865 | 840 | 207.9 |
| D | 13 | 152 | 188109 | 900.97 | 865 | 840 | 207.9 |
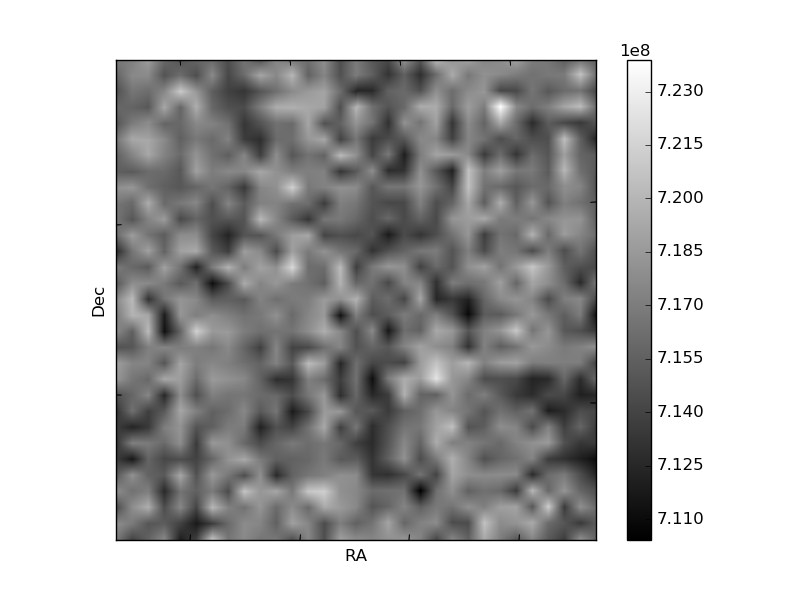
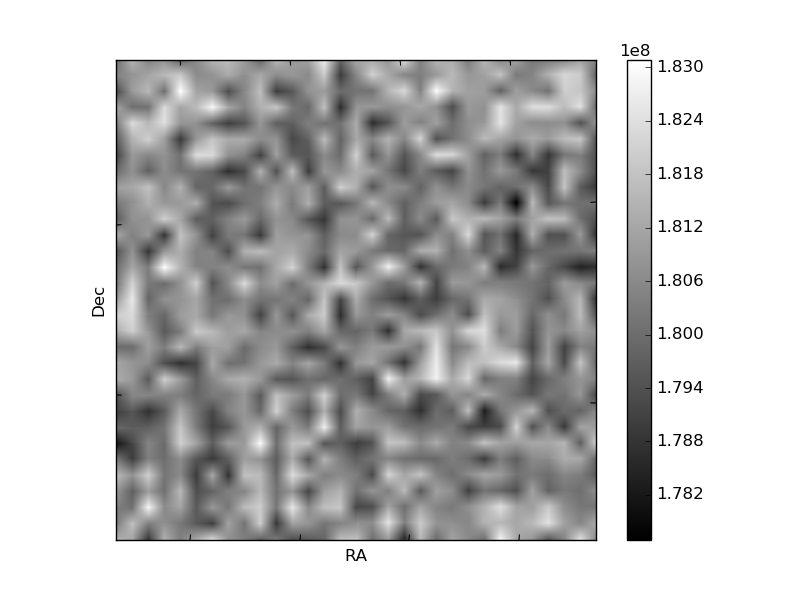
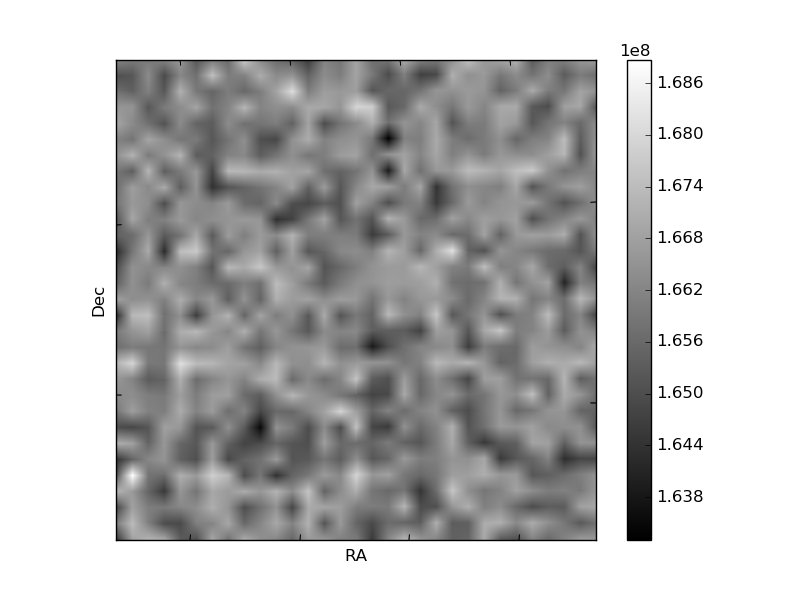
Histogram calculated using DETX and DETY for each event in the final _common_clean file
| Quadrant A | 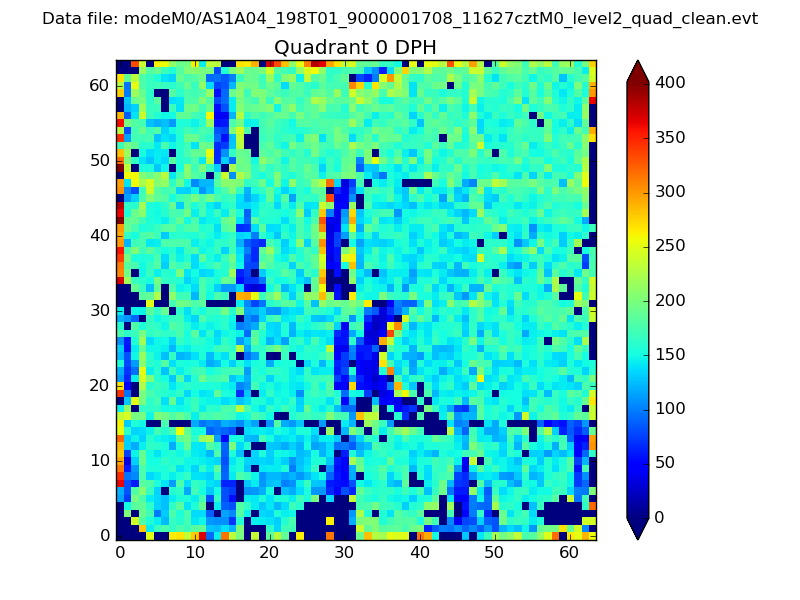 |
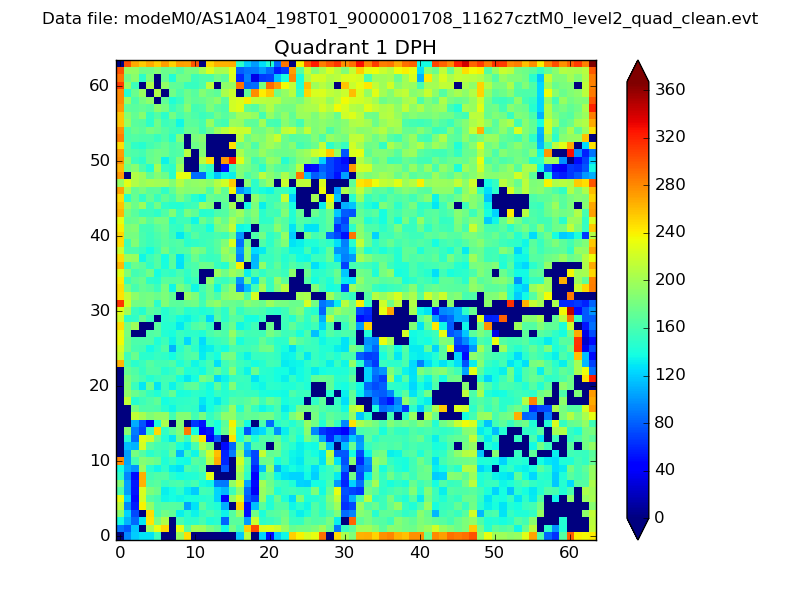 |
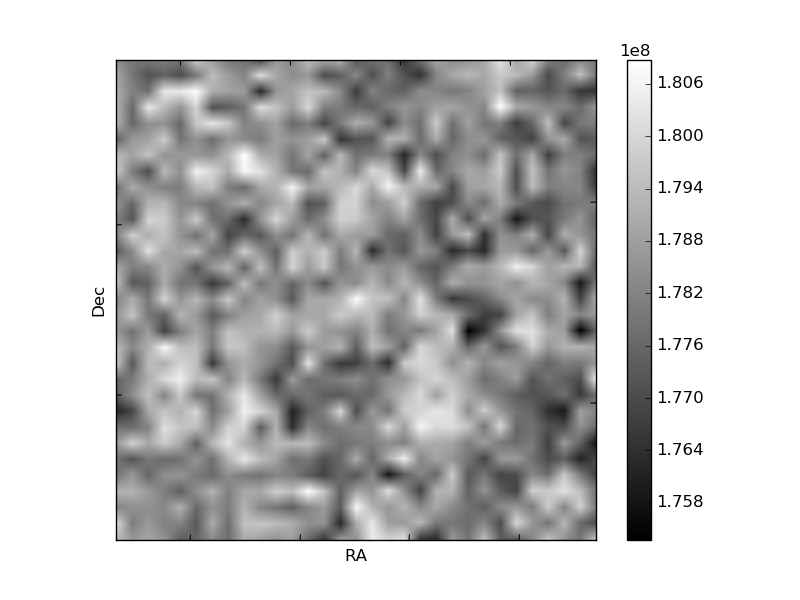
Quadrant B |
|---|---|---|---|
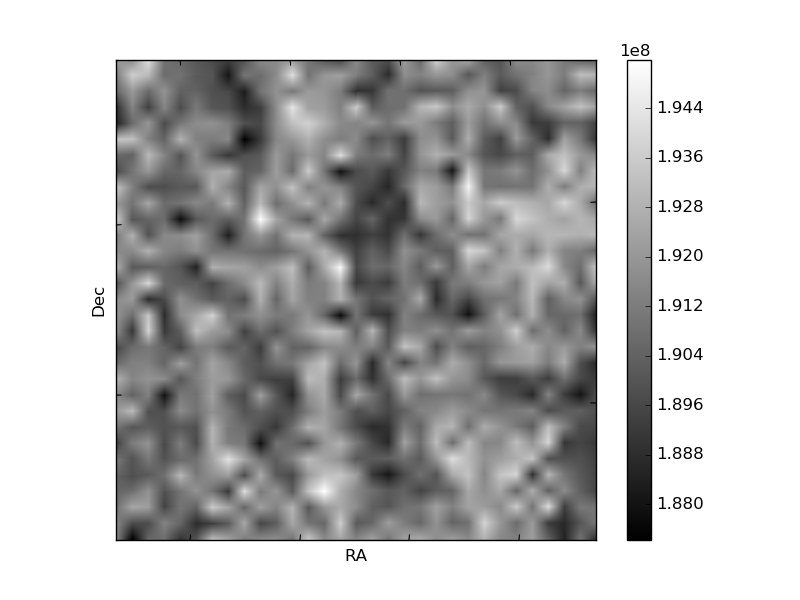
| Quadrant D | 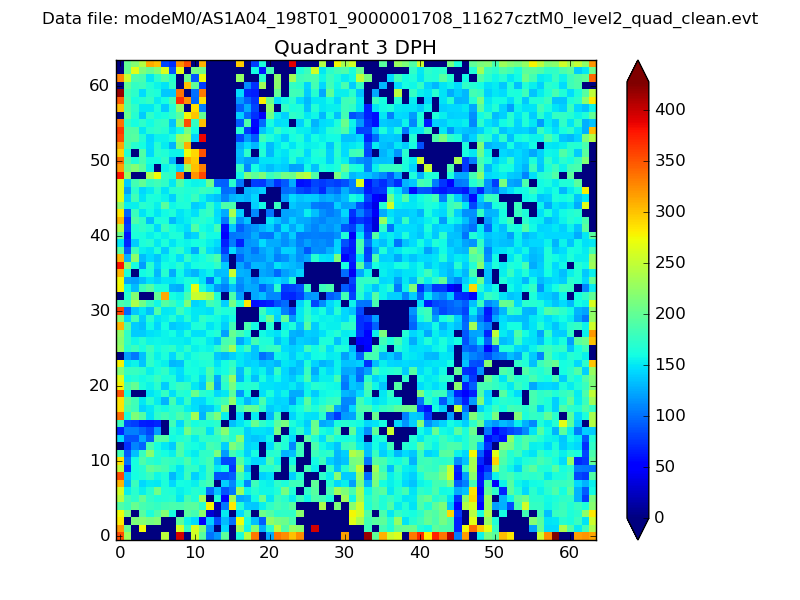 |
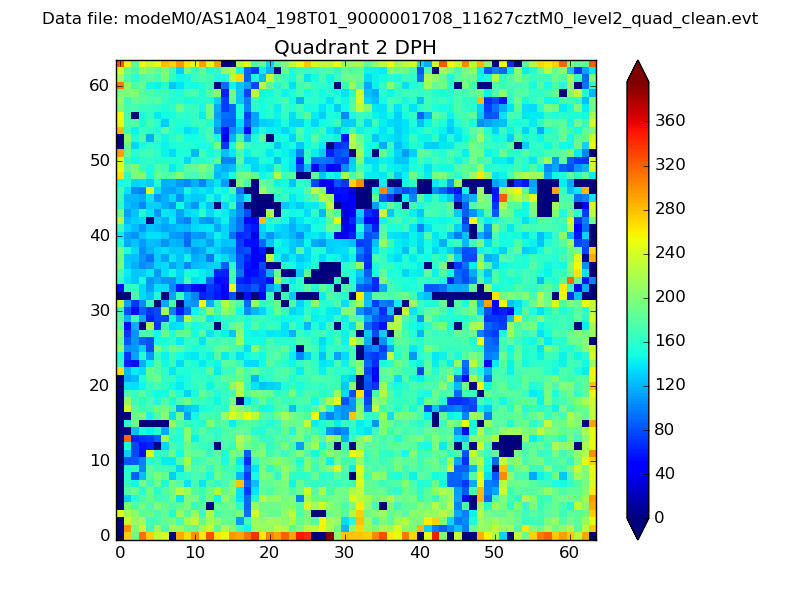 |
Quadrant C |
| Plot type | Count rate plots | Images |
|---|---|---|
| Comparison with Poisson distribution Blue bars denote a histogram of data divided into 1 sec bins. Red curve is a Poisson curve with rate = median count rate of data. |
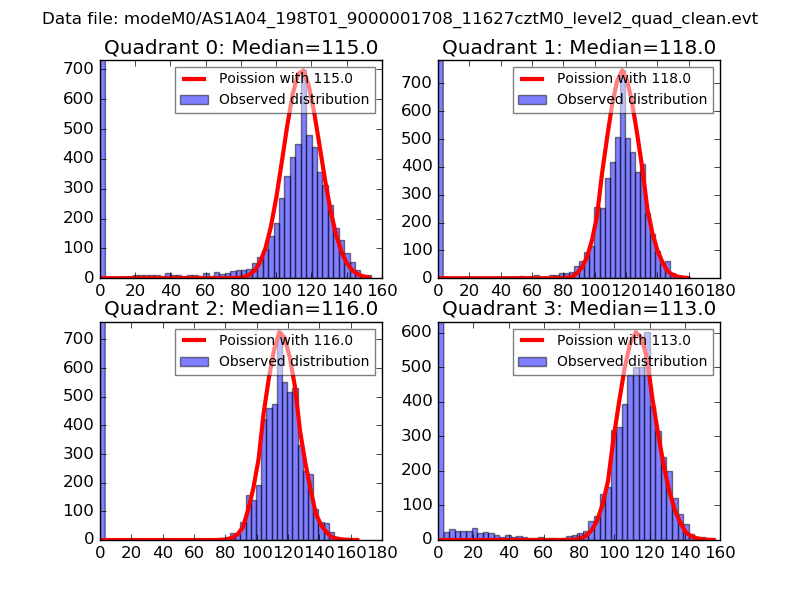 |
 |
| Quadrant-wise count rates Data is divided into 100 sec bins |
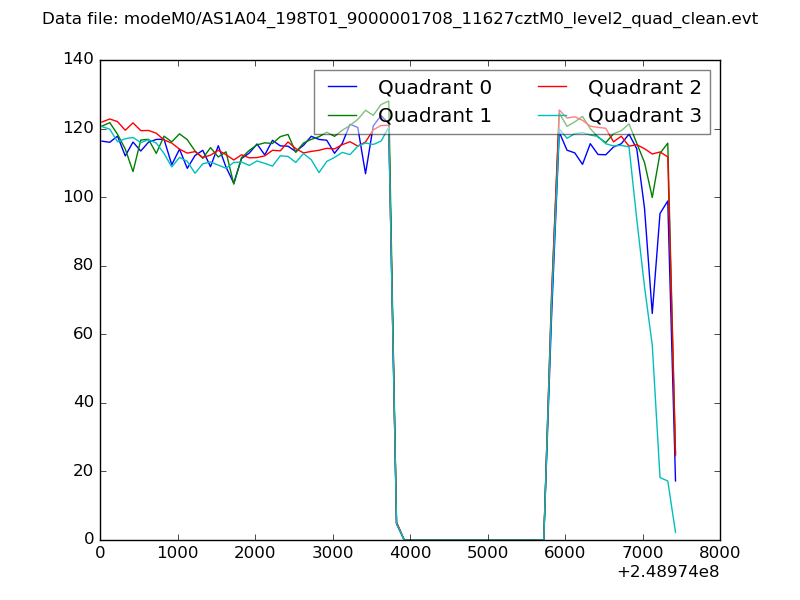 |
|
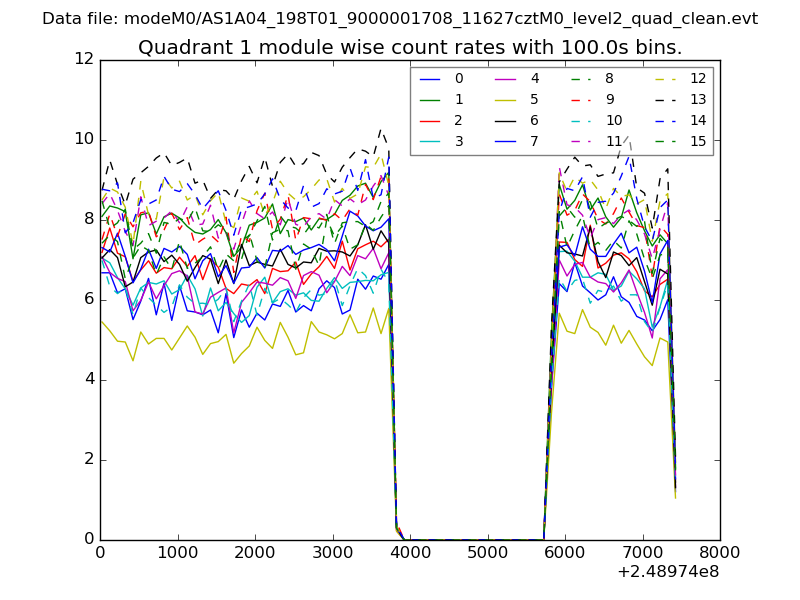
| Module-wise count rates for Quadrant A Data is divided into 100 sec bins |
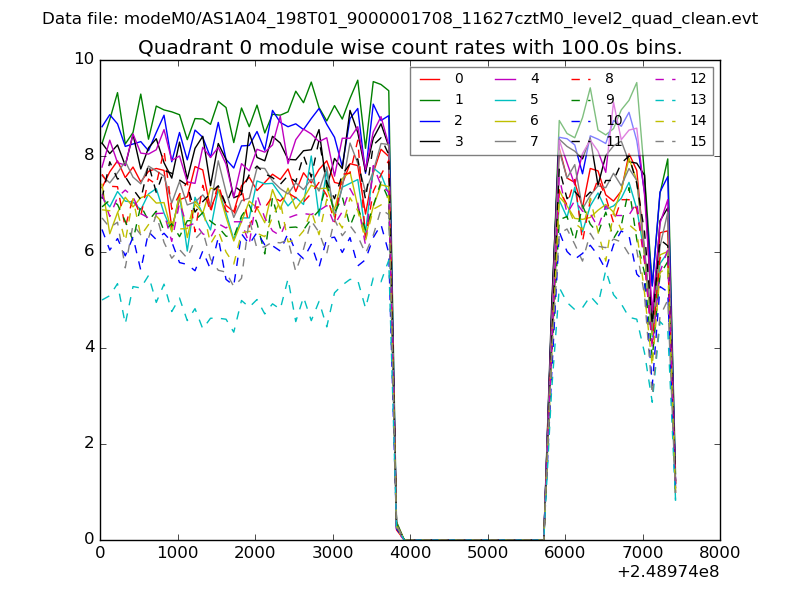 |
 |
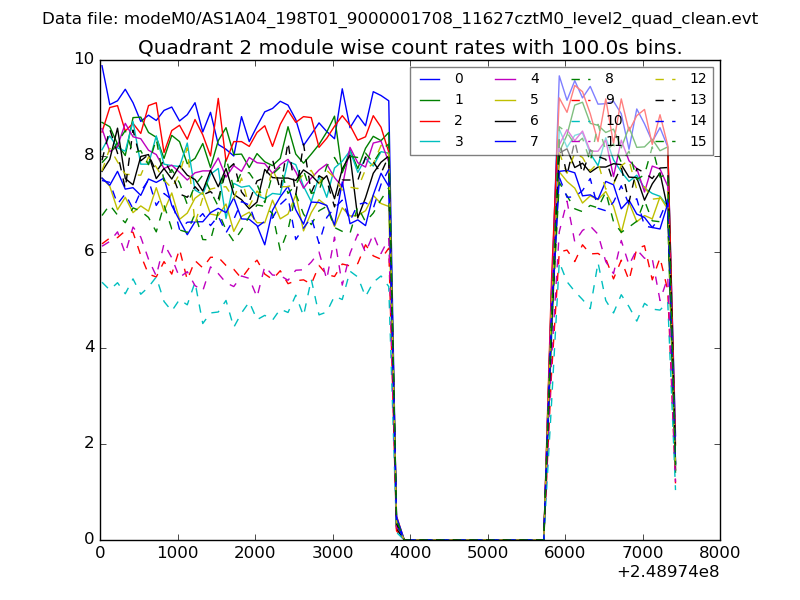
| Module-wise count rates for Quadrant B Data is divided into 100 sec bins |
 |
 |
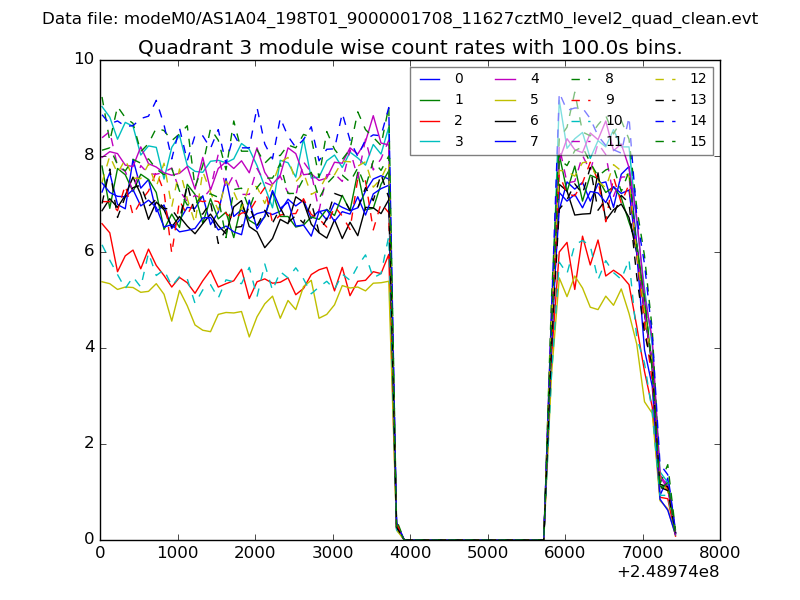
| Module-wise count rates for Quadrant C Data is divided into 100 sec bins |
 |
 |
| Module-wise count rates for Quadrant D Data is divided into 100 sec bins |
 |
 |
| Parameter | Plot |
|---|---|
| CZT HV Monitor | 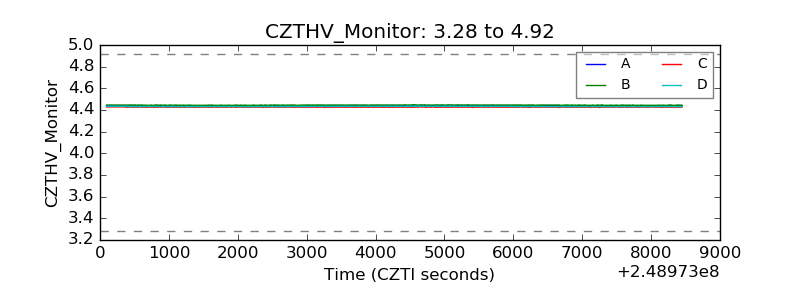 |
| D_VDD | 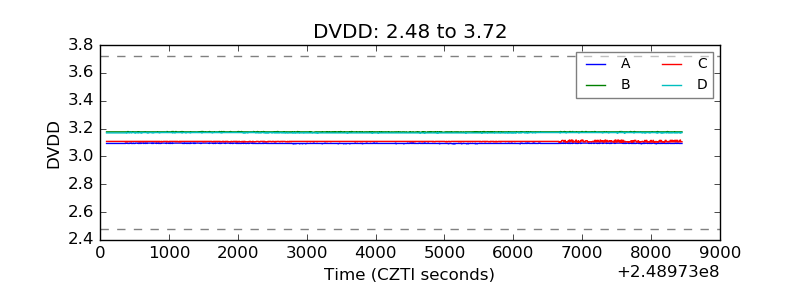 |
| Temperature 1 | 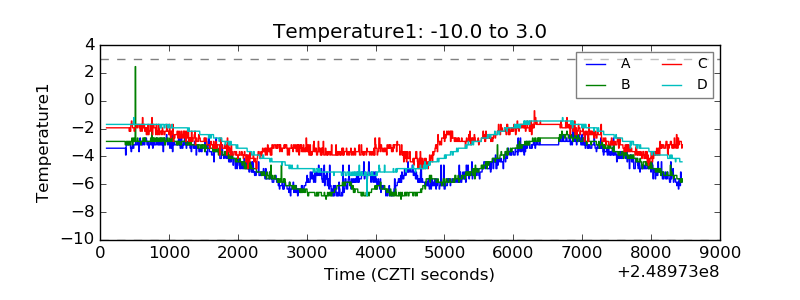 |
| Veto HV Monitor | 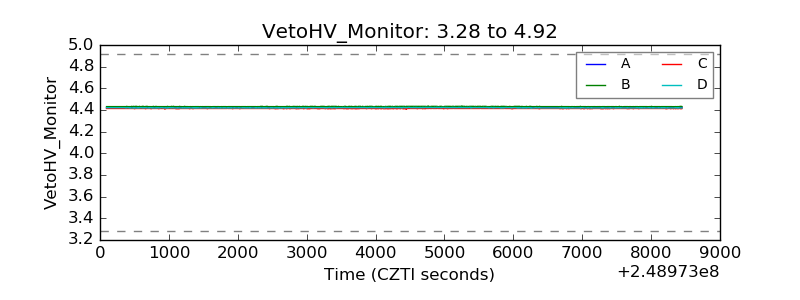 |
| Veto LLD | 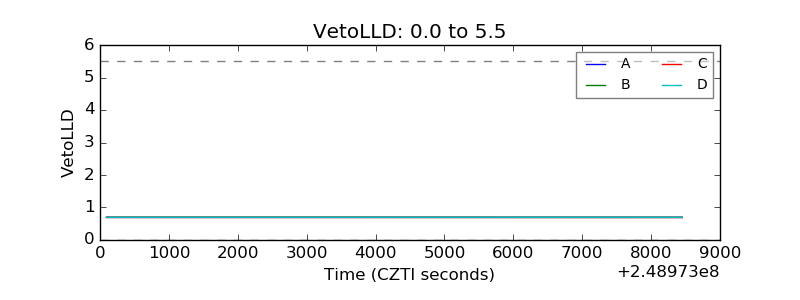 |
| Alpha Counter | 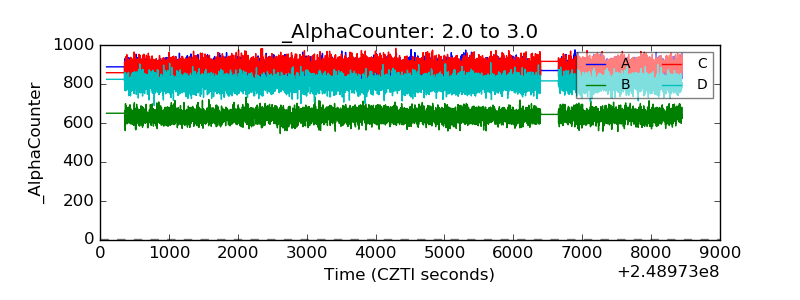 |
| _CPM_Rate | 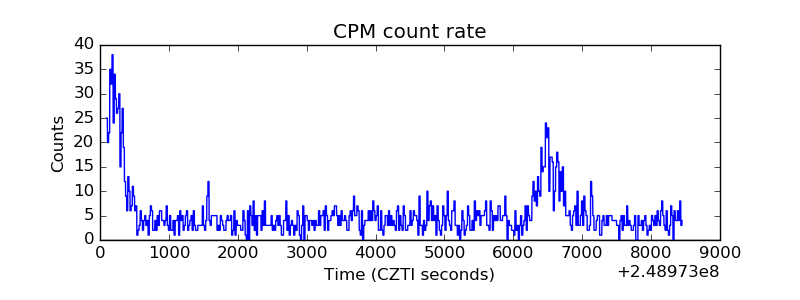 |
| CZT Counter | 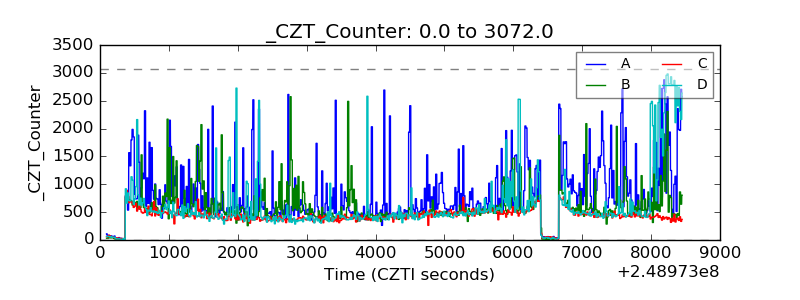 |
| +2.5 Volts monitor | 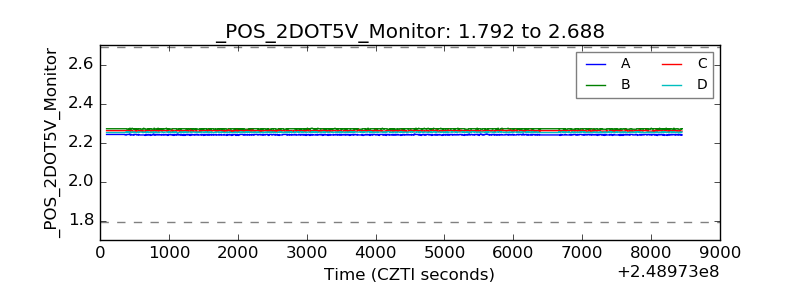 |
| +5 Volts monitor | 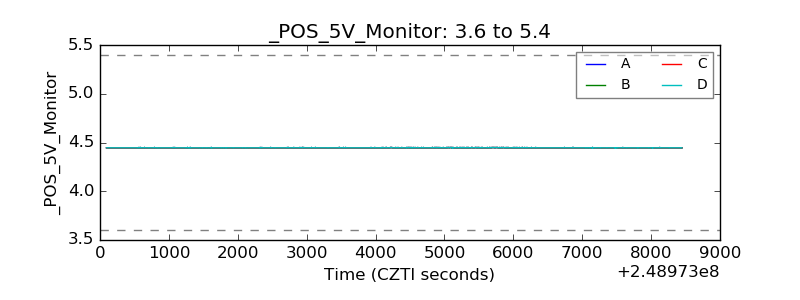 |
| _ROLL_ROT | 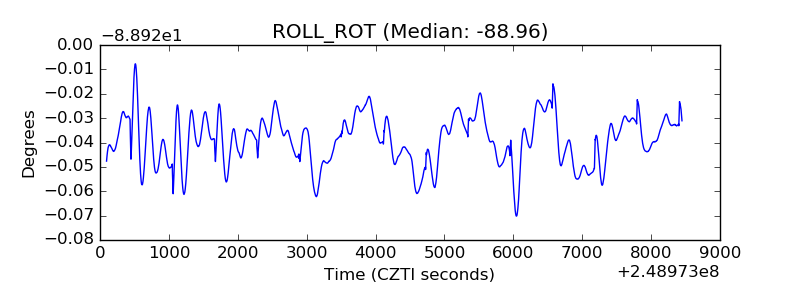 |
| _Roll_DEC | 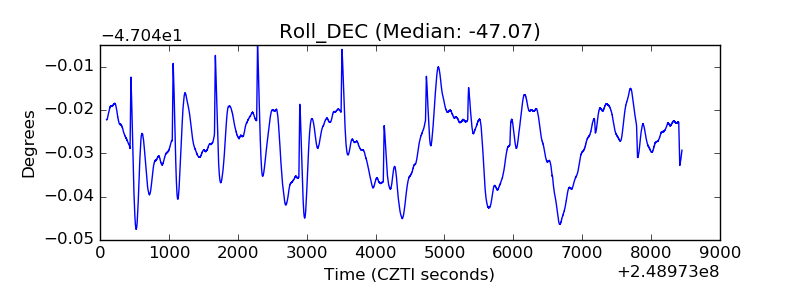 |
| _Roll_RA | 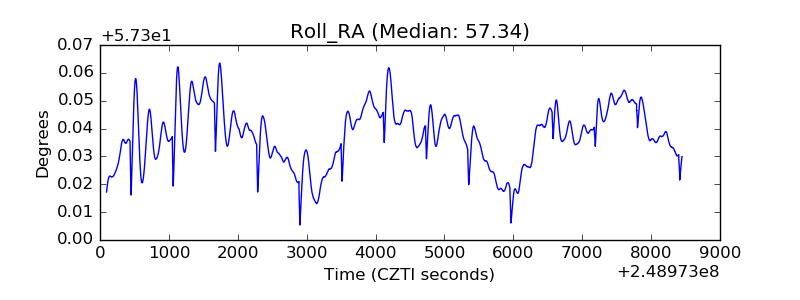 |
| Veto Counter | 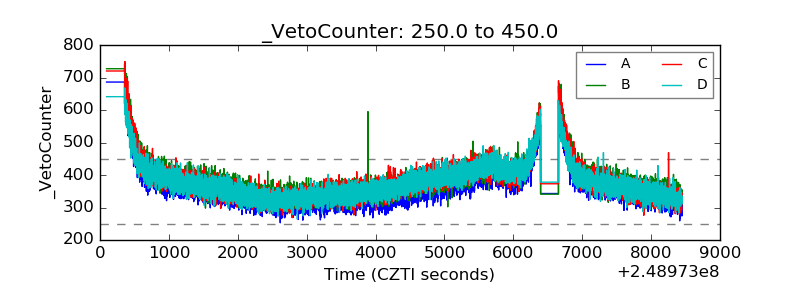 |