| Param | Original file | Final file |
|---|---|---|
| Filename | modeM0/AS1A04_198T01_9000001708_11628cztM0_level2.evt | modeM0/AS1A04_198T01_9000001708_11628cztM0_level2_quad_clean.evt |
| Size (bytes) | 727,344,000 | 94,956,480 |
| Size | 693.6 MB | 90.6 MB |
| Events in quadrant A | 6,952,344 | 603,204 |
| Events in quadrant B | 4,358,918 | 635,619 |
| Events in quadrant C | 3,255,119 | 628,888 |
| Events in quadrant D | 6,960,363 | 491,618 |
| Mode SS | |||
|---|---|---|---|
| Quadrant | BADHDUFLAG | Total packets | Discarded packets |
| A | 0 | 150 | 0 |
| B | 0 | 150 | 0 |
| C | 0 | 150 | 0 |
| D | 0 | 150 | 0 |
| Mode M0 | |||
|---|---|---|---|
| Quadrant | BADHDUFLAG | Total packets | Discarded packets |
| A | 0 | 25813 | 2 |
| B | 0 | 17870 | 1 |
| C | 0 | 15038 | 1 |
| D | 0 | 25713 | 1 |
| Mode M9 | |||
|---|---|---|---|
| Quadrant | BADHDUFLAG | Total packets | Discarded packets |
| A | 0 | 4 | 0 |
| B | 0 | 4 | 0 |
| C | 0 | 4 | 0 |
| D | 0 | 4 | 0 |
| Quadrant | Total seconds | Saturated seconds | Saturation percentage |
|---|---|---|---|
| A | 7403 | 839 | 11.333243% |
| B | 7403 | 223 | 3.012292% |
| C | 7403 | 11 | 0.148588% |
| D | 7403 | 1391 | 18.789680% |
Noise dominated data is calculated using 1-second bins in cleaned event files. If a bin has >2000 counts, and if more than 50% of those come from <1% of pixels, then it is considered to be noise-dominated and hence unusable.
| Quadrant | # 1 sec bins | Bins with >0 counts | Bins with >2000 counts | High rate bins dominated by noise | Noise dominated (total time) | Noise dominated (detector-on time) | Marked lightcurve |
|---|---|---|---|---|---|---|---|
| A | 7784 | 7405 | 517 | 517 | 6.64% | 6.98% | 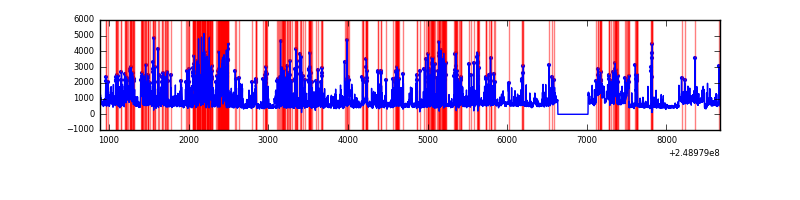 |
| B | 7784 | 7405 | 97 | 97 | 1.25% | 1.31% | 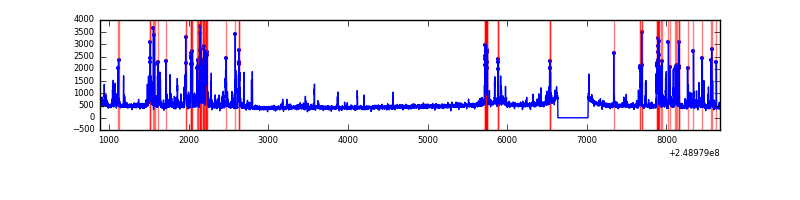 |
| C | 7784 | 7405 | 0 | 0 | 0.00% | 0.00% | 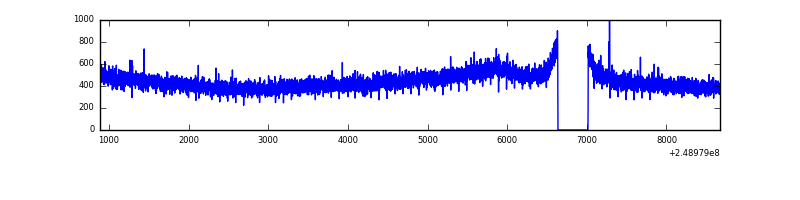 |
| D | 7784 | 7405 | 1261 | 1261 | 16.20% | 17.03% | 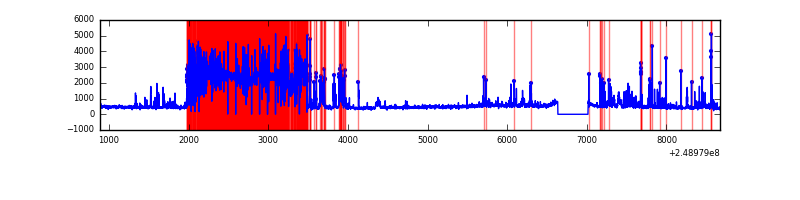 |
Top three noisy pixels from each quadrant. If the there are fewer than three noisy pixels in the level2.evt file, extra rows are filled as -1
| Pixel properties | Quadrant properties | ||||||
|---|---|---|---|---|---|---|---|
| Quadrant | DetID | PixID | Counts | Sigma | Mean | Median | Sigma |
| A | 8 | 5 | 3348742 | 19430.5 | 825 | 803 | 172.3 |
| A | 1 | 162 | 153723 | 887.51 | 825 | 803 | 172.3 |
| A | 1 | 178 | 90505 | 520.61 | 825 | 803 | 172.3 |
| B | 4 | 239 | 840431 | 5074.97 | 853 | 831 | 165.4 |
| B | 11 | 51 | 77959 | 466.2 | 853 | 831 | 165.4 |
| B | 15 | 204 | 54243 | 322.85 | 853 | 831 | 165.4 |
| C | 8 | 128 | 11165 | 53.43 | 829 | 832 | 193.4 |
| C | 13 | 61 | 6219 | 27.85 | 829 | 832 | 193.4 |
| C | 8 | 112 | 6121 | 27.35 | 829 | 832 | 193.4 |
| D | 7 | 80 | 3725166 | 21113.11 | 729 | 708 | 176.4 |
| D | 1 | 52 | 223676 | 1263.96 | 729 | 708 | 176.4 |
| D | 13 | 104 | 79717 | 447.88 | 729 | 708 | 176.4 |
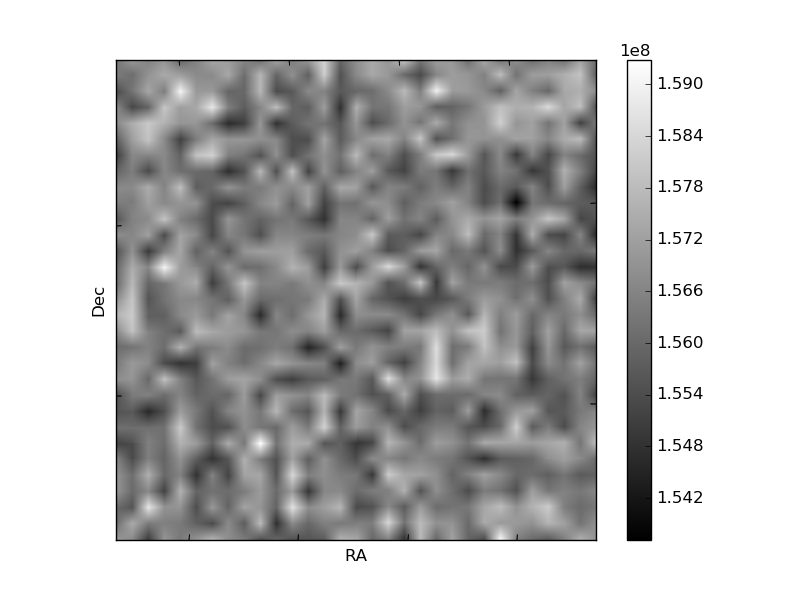
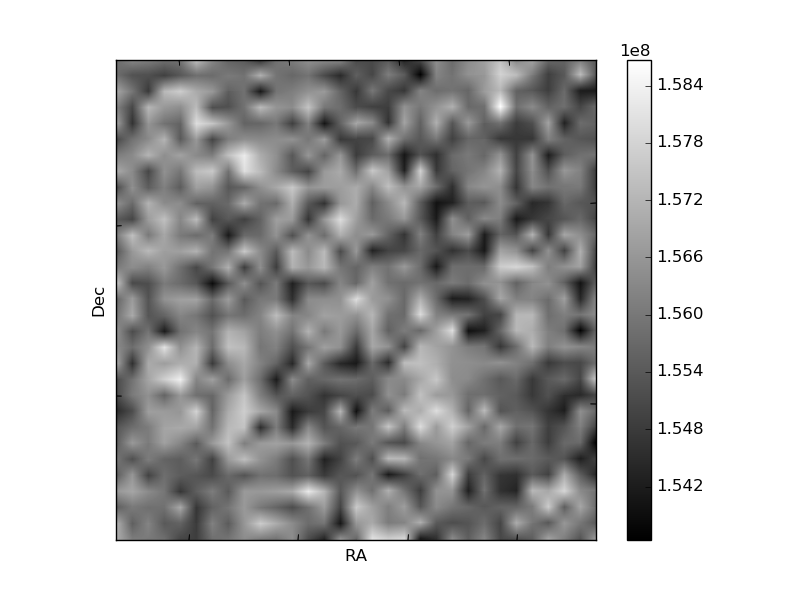
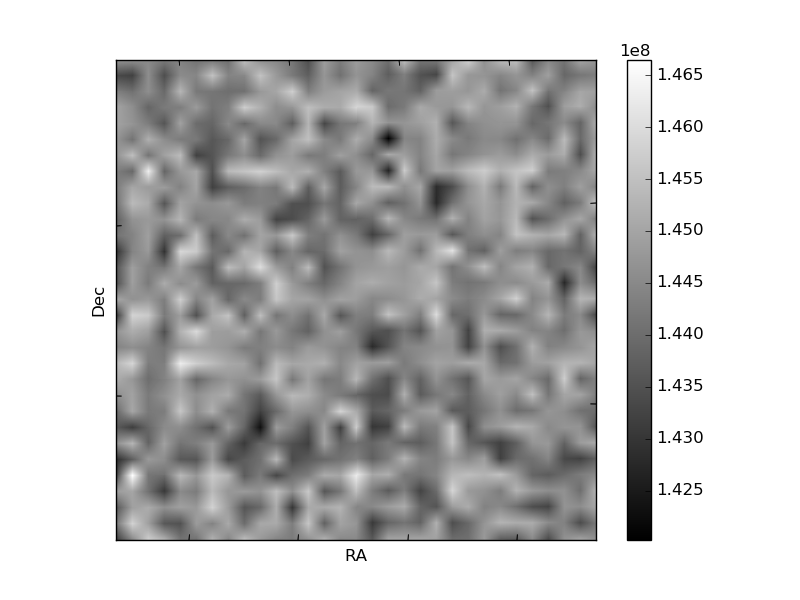
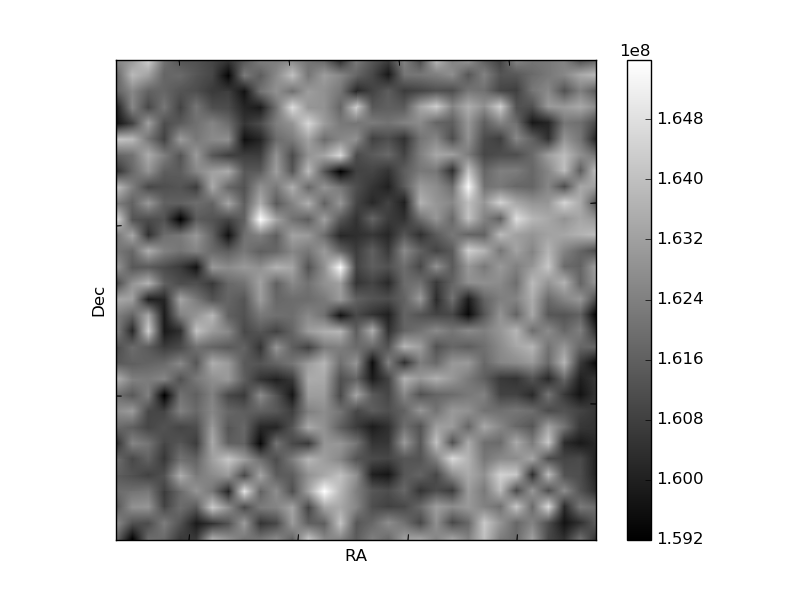
Histogram calculated using DETX and DETY for each event in the final _common_clean file
| Quadrant A | 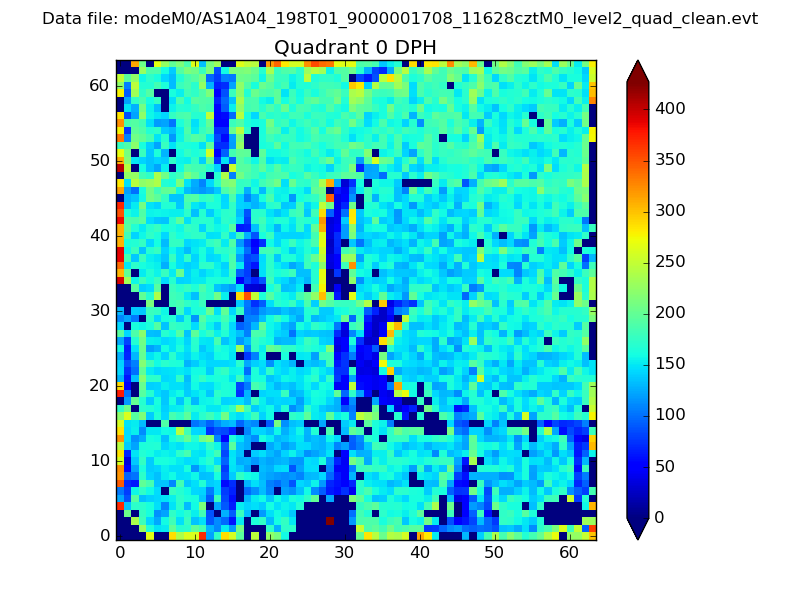 |
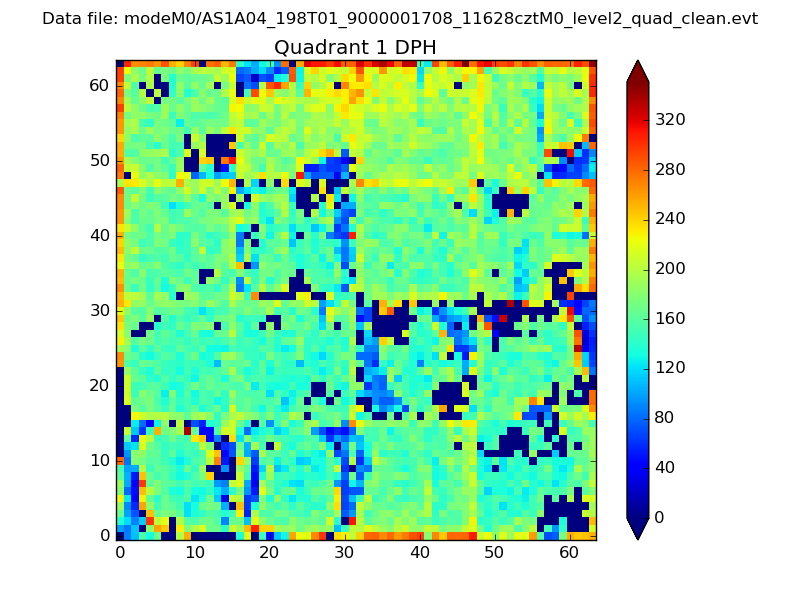 |
Quadrant B |
|---|---|---|---|
| Quadrant D | 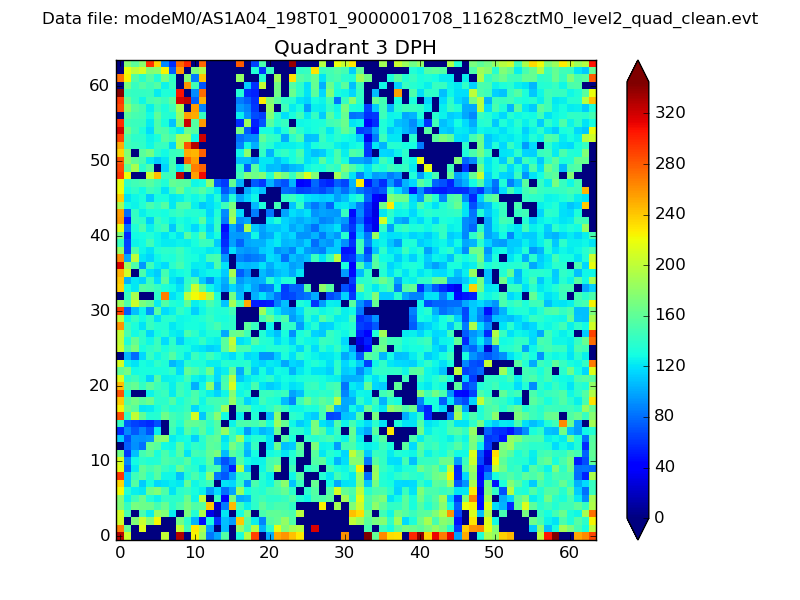 |
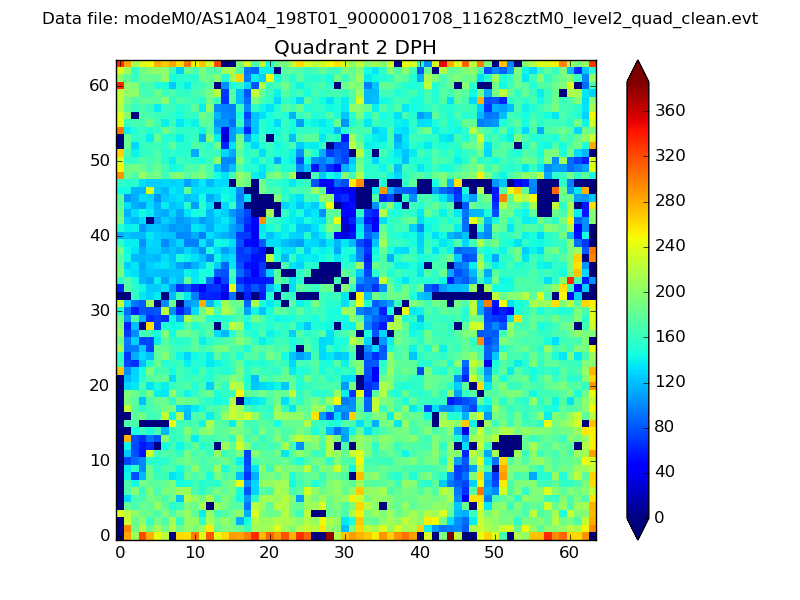 |
Quadrant C |
| Plot type | Count rate plots | Images |
|---|---|---|
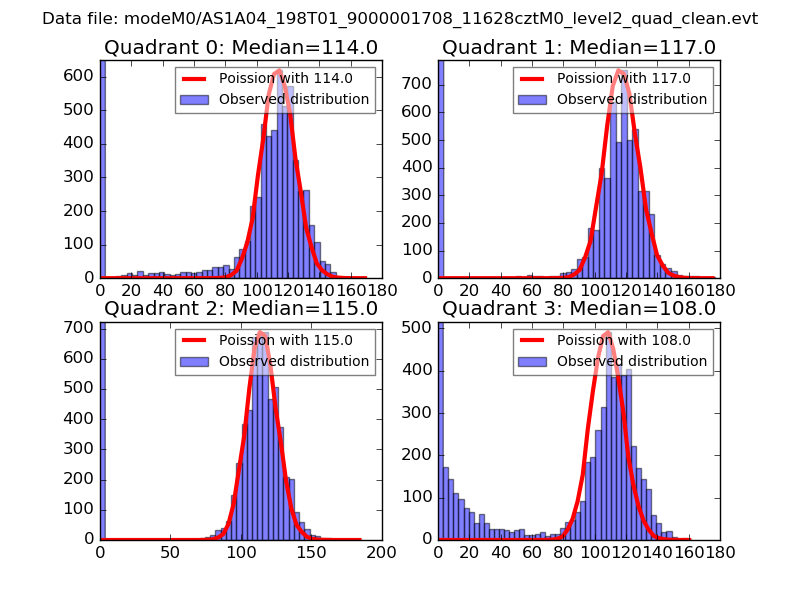
| Comparison with Poisson distribution Blue bars denote a histogram of data divided into 1 sec bins. Red curve is a Poisson curve with rate = median count rate of data. |
 |
 |
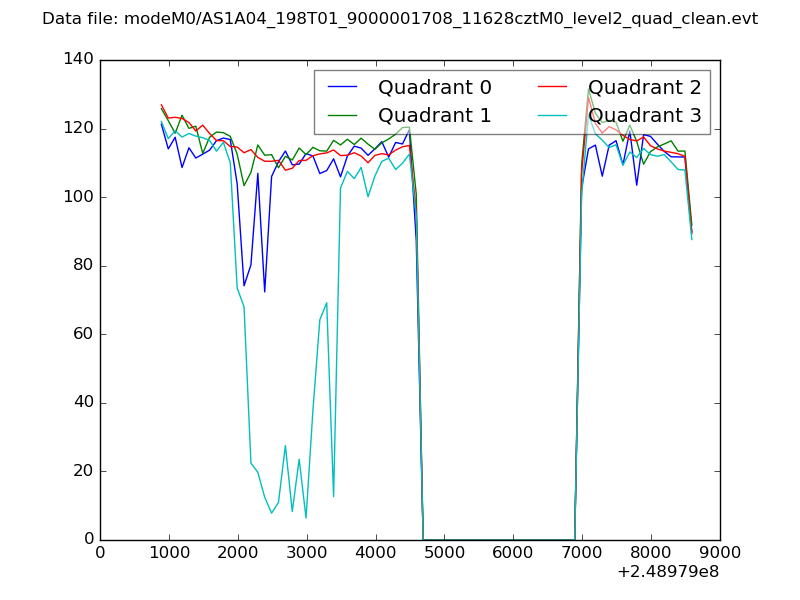
| Quadrant-wise count rates Data is divided into 100 sec bins |
 |
|
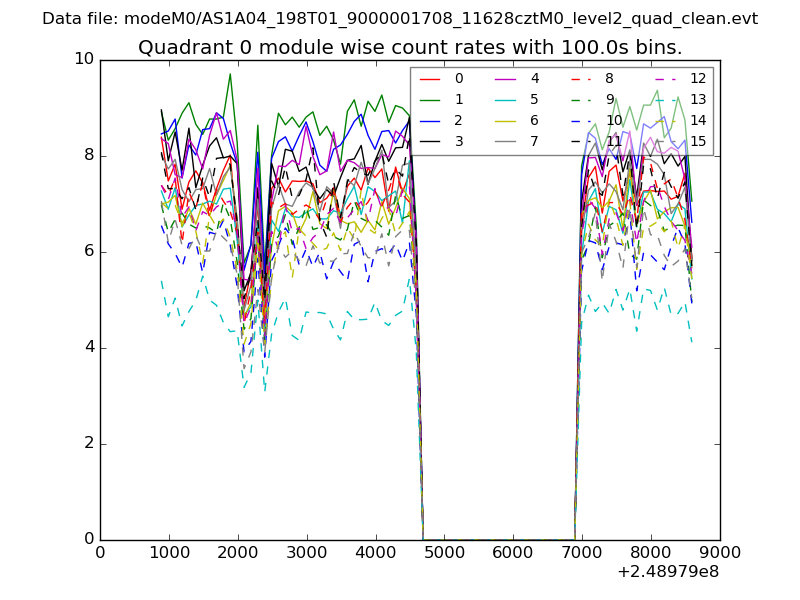
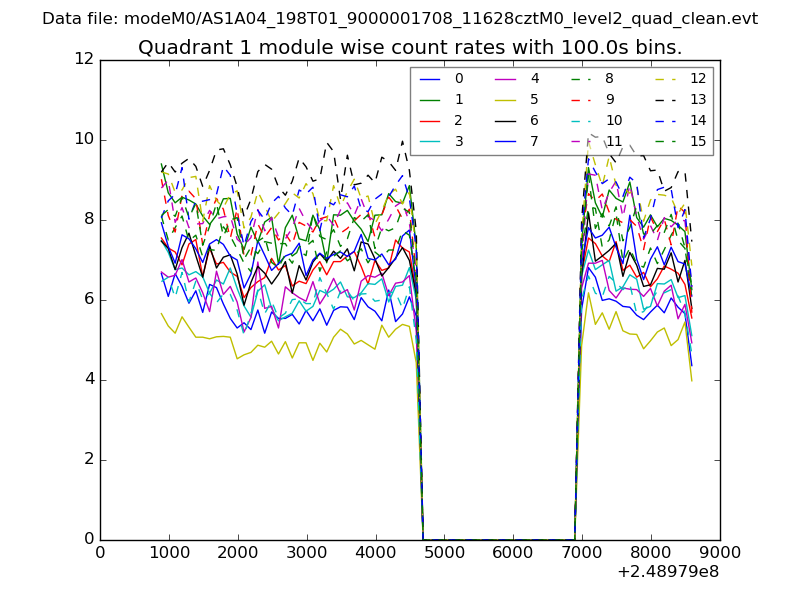
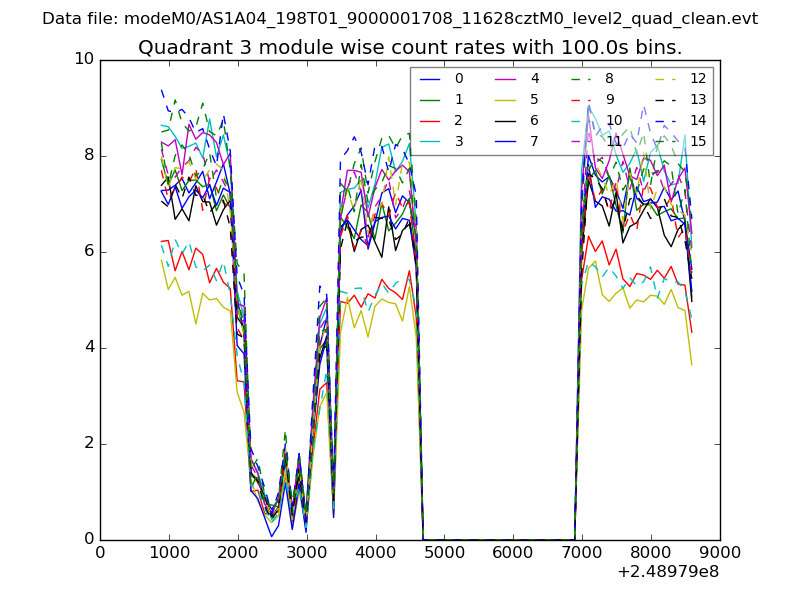
| Module-wise count rates for Quadrant A Data is divided into 100 sec bins |
 |
 |
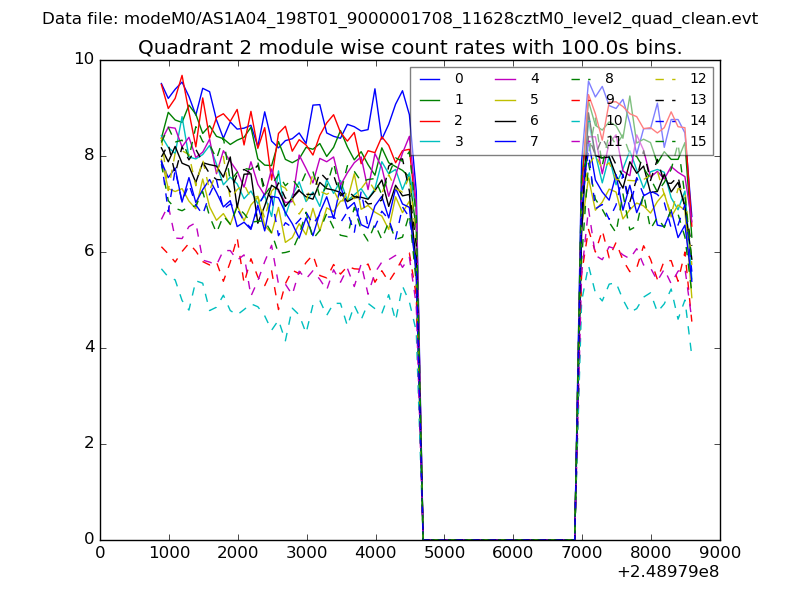
| Module-wise count rates for Quadrant B Data is divided into 100 sec bins |
 |
 |
| Module-wise count rates for Quadrant C Data is divided into 100 sec bins |
 |
 |
| Module-wise count rates for Quadrant D Data is divided into 100 sec bins |
 |
 |
| Parameter | Plot |
|---|---|
| CZT HV Monitor | 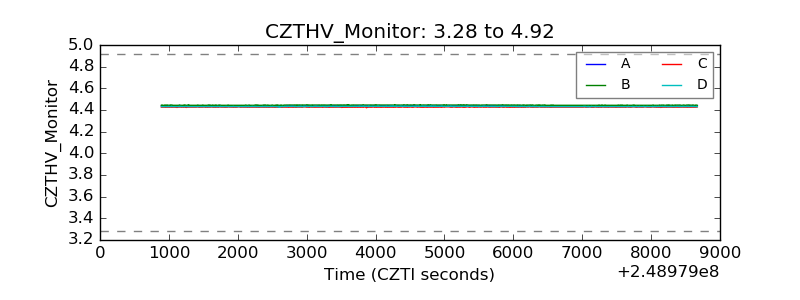 |
| D_VDD |  |
| Temperature 1 | 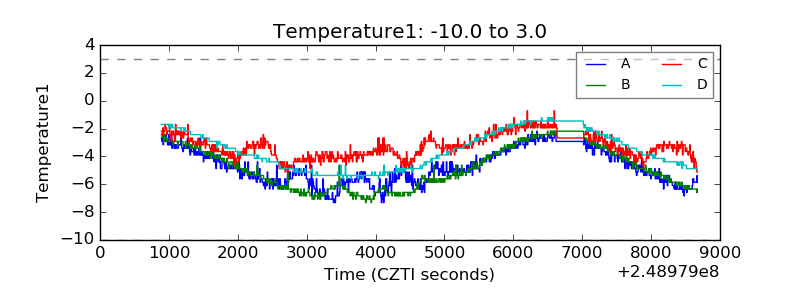 |
| Veto HV Monitor | 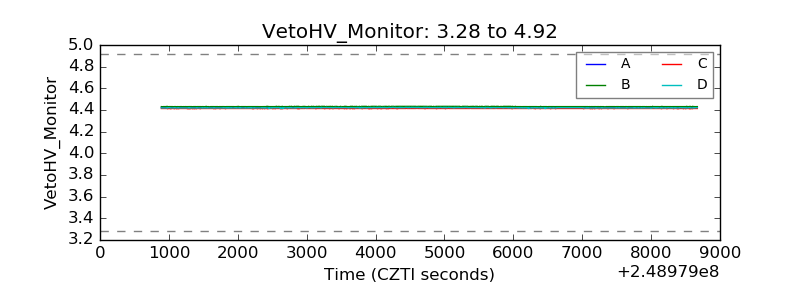 |
| Veto LLD | 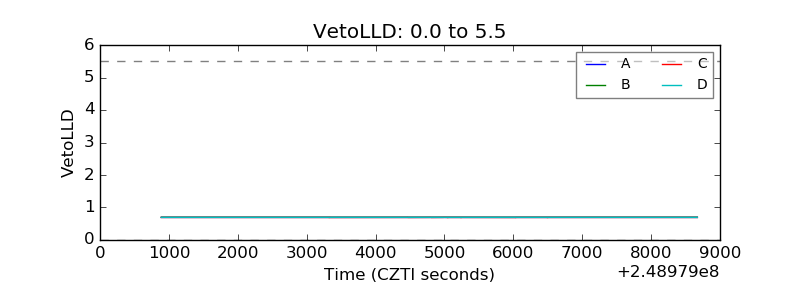 |
| Alpha Counter | 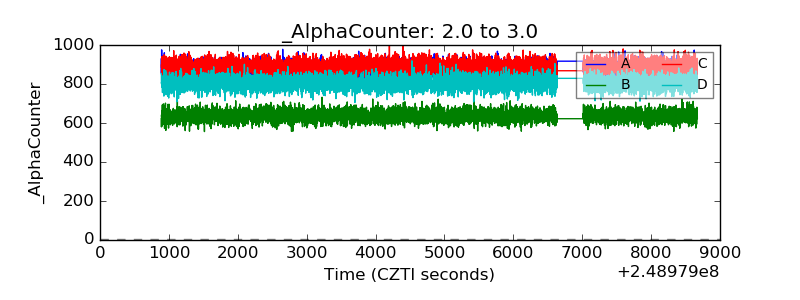 |
| _CPM_Rate | 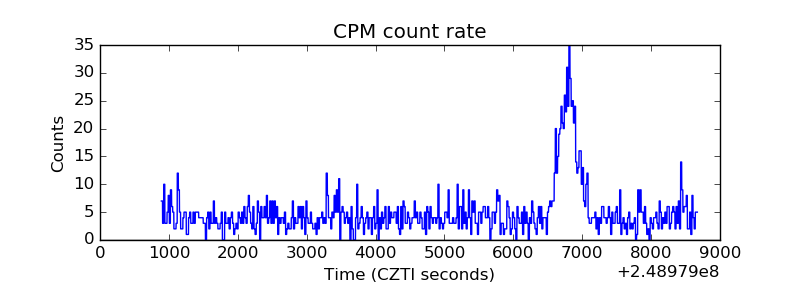 |
| CZT Counter | 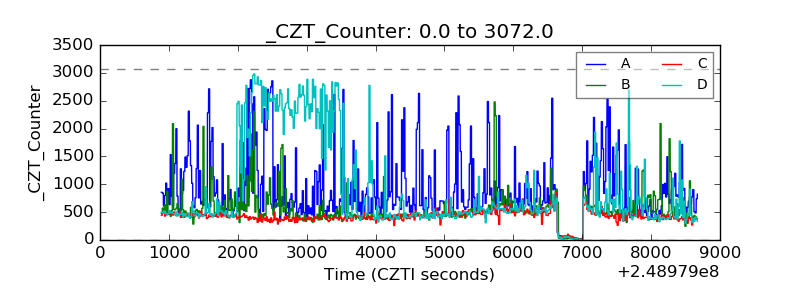 |
| +2.5 Volts monitor |  |
| +5 Volts monitor |  |
| _ROLL_ROT | 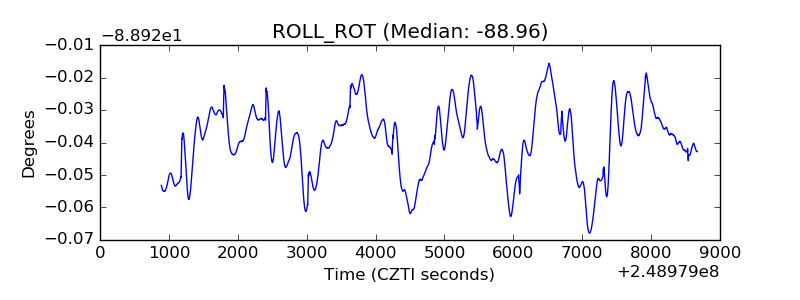 |
| _Roll_DEC | 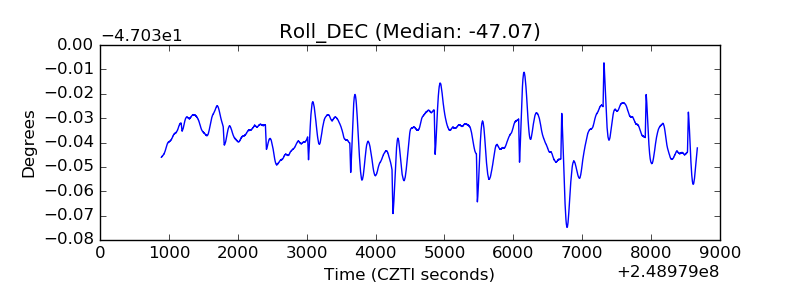 |
| _Roll_RA | 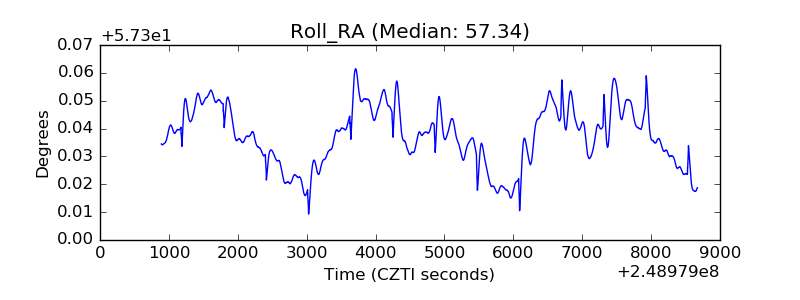 |
| Veto Counter | 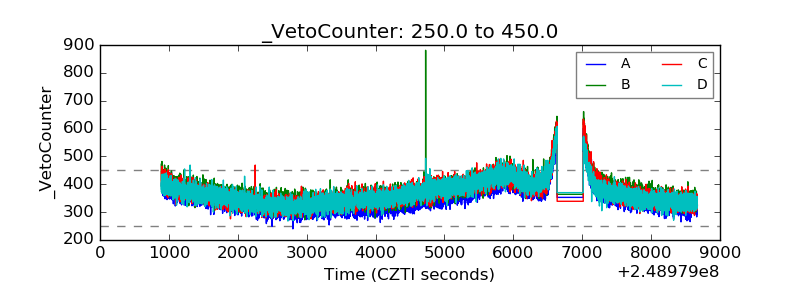 |