| Param | Original file | Final file |
|---|---|---|
| Filename | modeM0/AS1A04_198T01_9000001708_11631cztM0_level2.evt | modeM0/AS1A04_198T01_9000001708_11631cztM0_level2_quad_clean.evt |
| Size (bytes) | 558,253,440 | 76,844,160 |
| Size | 532.4 MB | 73.3 MB |
| Events in quadrant A | 5,995,471 | 465,998 |
| Events in quadrant B | 3,673,776 | 485,822 |
| Events in quadrant C | 2,754,931 | 479,478 |
| Events in quadrant D | 4,063,624 | 464,069 |
| Mode SS | |||
|---|---|---|---|
| Quadrant | BADHDUFLAG | Total packets | Discarded packets |
| A | 0 | 126 | 0 |
| B | 0 | 126 | 0 |
| C | 0 | 126 | 0 |
| D | 0 | 126 | 0 |
| Mode M0 | |||
|---|---|---|---|
| Quadrant | BADHDUFLAG | Total packets | Discarded packets |
| A | 0 | 22171 | 2 |
| B | 0 | 15101 | 2 |
| C | 0 | 12611 | 2 |
| D | 0 | 16440 | 2 |
| Mode M9 | |||
|---|---|---|---|
| Quadrant | BADHDUFLAG | Total packets | Discarded packets |
| A | 0 | 6 | 0 |
| B | 0 | 6 | 0 |
| C | 0 | 6 | 0 |
| D | 0 | 7 | 0 |
| Quadrant | Total seconds | Saturated seconds | Saturation percentage |
|---|---|---|---|
| A | 6176 | 968 | 15.673575% |
| B | 6176 | 218 | 3.529793% |
| C | 6176 | 10 | 0.161917% |
| D | 6176 | 434 | 7.027202% |
Noise dominated data is calculated using 1-second bins in cleaned event files. If a bin has >2000 counts, and if more than 50% of those come from <1% of pixels, then it is considered to be noise-dominated and hence unusable.
| Quadrant | # 1 sec bins | Bins with >0 counts | Bins with >2000 counts | High rate bins dominated by noise | Noise dominated (total time) | Noise dominated (detector-on time) | Marked lightcurve |
|---|---|---|---|---|---|---|---|
| A | 6702 | 6178 | 497 | 497 | 7.42% | 8.04% | 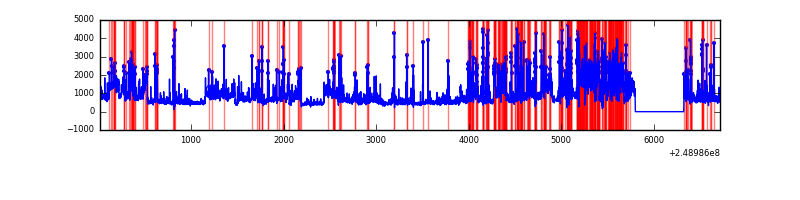 |
| B | 6702 | 6178 | 85 | 85 | 1.27% | 1.38% | 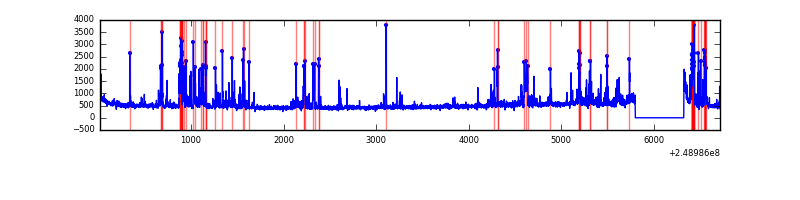 |
| C | 6702 | 6178 | 1 | 1 | 0.01% | 0.02% | 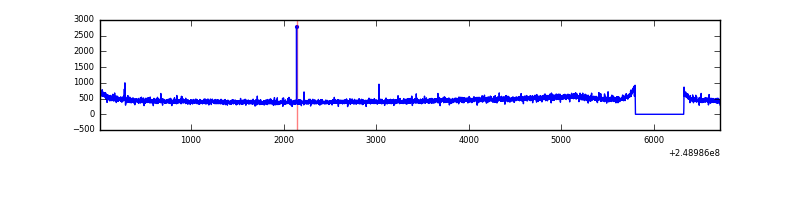 |
| D | 6702 | 6178 | 181 | 181 | 2.70% | 2.93% | 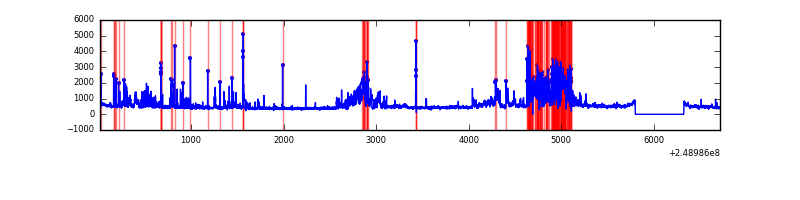 |
Top three noisy pixels from each quadrant. If the there are fewer than three noisy pixels in the level2.evt file, extra rows are filled as -1
| Pixel properties | Quadrant properties | ||||||
|---|---|---|---|---|---|---|---|
| Quadrant | DetID | PixID | Counts | Sigma | Mean | Median | Sigma |
| A | 8 | 5 | 3107779 | 21888.95 | 678 | 661 | 141.9 |
| A | 1 | 162 | 97072 | 679.19 | 678 | 661 | 141.9 |
| A | 1 | 178 | 56034 | 390.09 | 678 | 661 | 141.9 |
| B | 4 | 239 | 697798 | 5000.68 | 720 | 702 | 139.4 |
| B | 11 | 51 | 62877 | 446.02 | 720 | 702 | 139.4 |
| B | 15 | 204 | 61637 | 437.12 | 720 | 702 | 139.4 |
| C | 14 | 234 | 7235 | 39.82 | 703 | 707 | 164.0 |
| C | 13 | 61 | 5030 | 26.37 | 703 | 707 | 164.0 |
| C | 1 | 5 | 4440 | 22.77 | 703 | 707 | 164.0 |
| D | 13 | 152 | 1104427 | 6798.83 | 666 | 647 | 162.3 |
| D | 1 | 52 | 220801 | 1356.06 | 666 | 647 | 162.3 |
| D | 13 | 104 | 58997 | 359.41 | 666 | 647 | 162.3 |
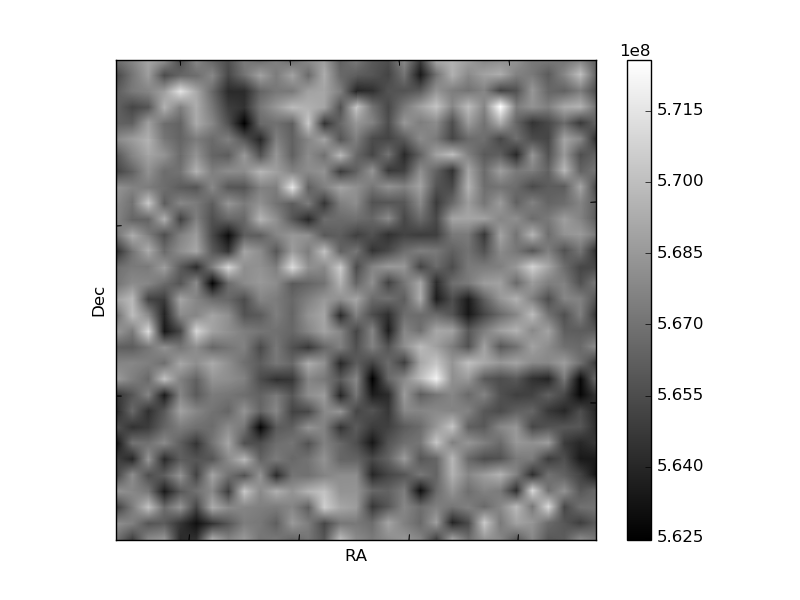
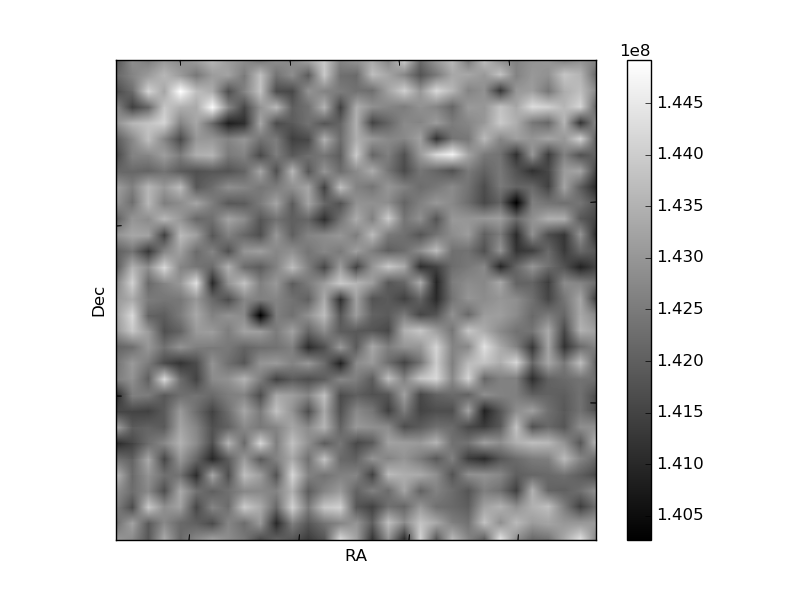
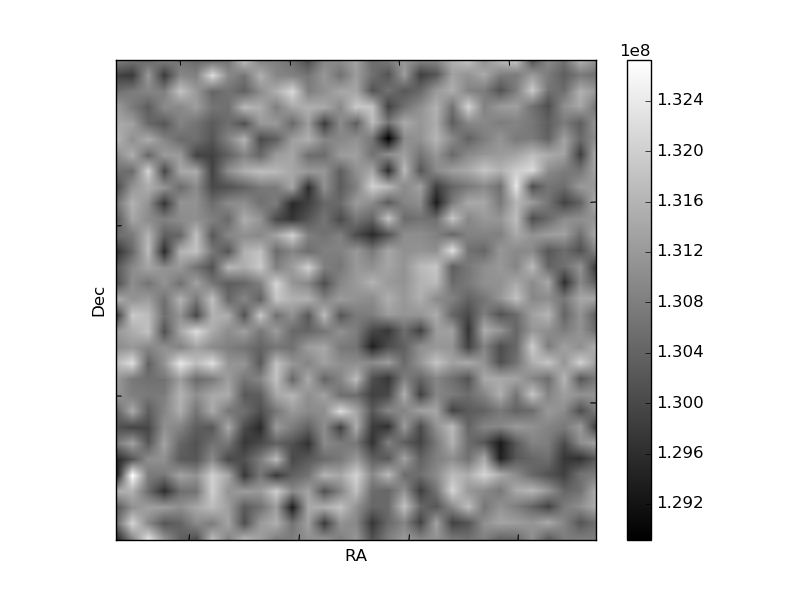
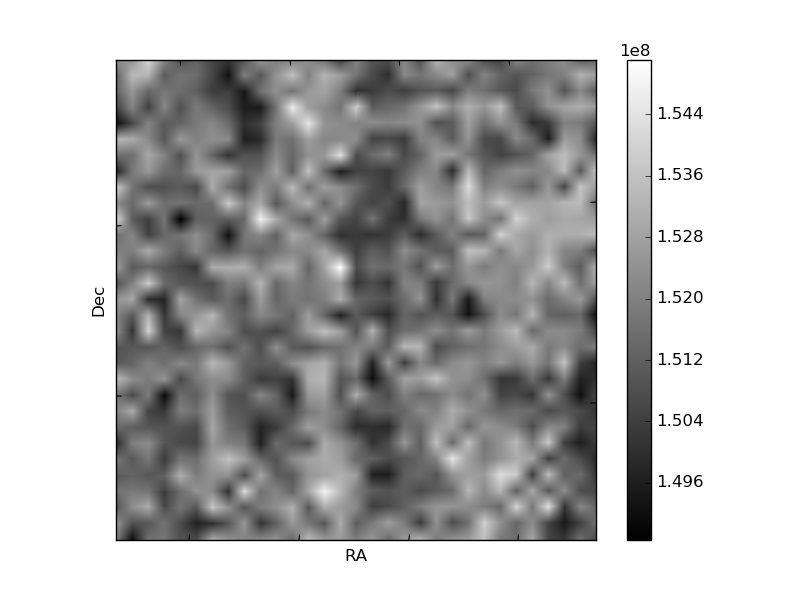
Histogram calculated using DETX and DETY for each event in the final _common_clean file
| Quadrant A | 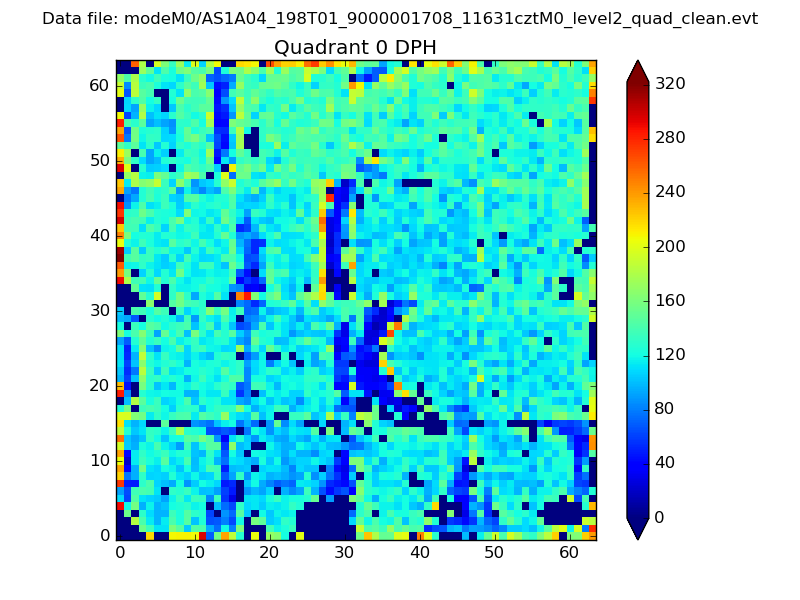 |
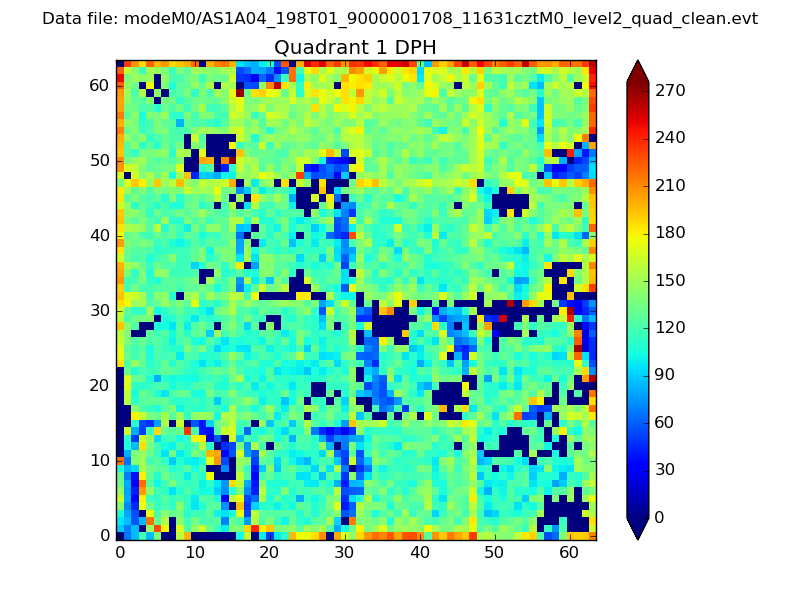 |
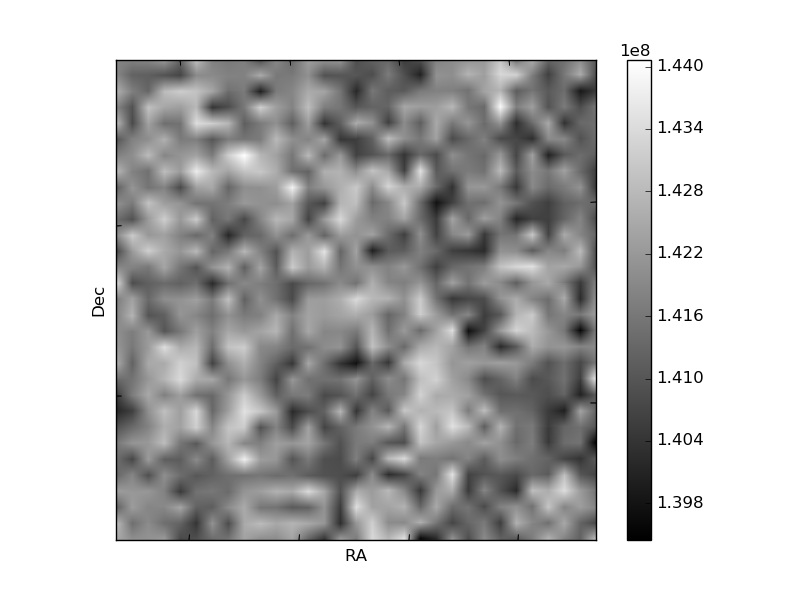
Quadrant B |
|---|---|---|---|
| Quadrant D | 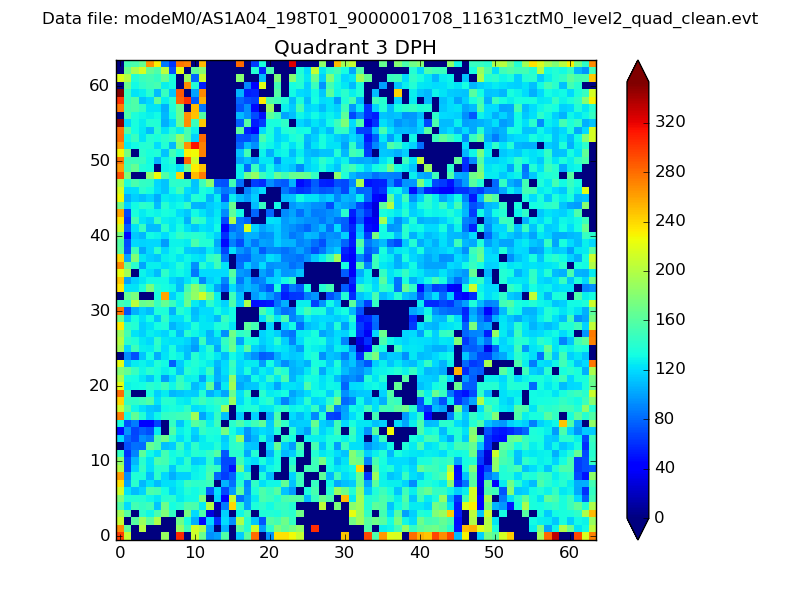 |
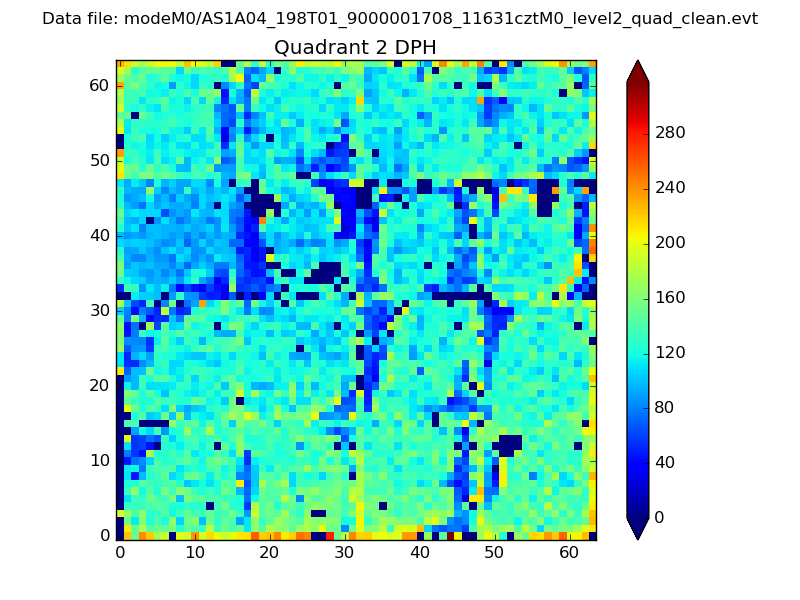 |
Quadrant C |
| Plot type | Count rate plots | Images |
|---|---|---|
| Comparison with Poisson distribution Blue bars denote a histogram of data divided into 1 sec bins. Red curve is a Poisson curve with rate = median count rate of data. |
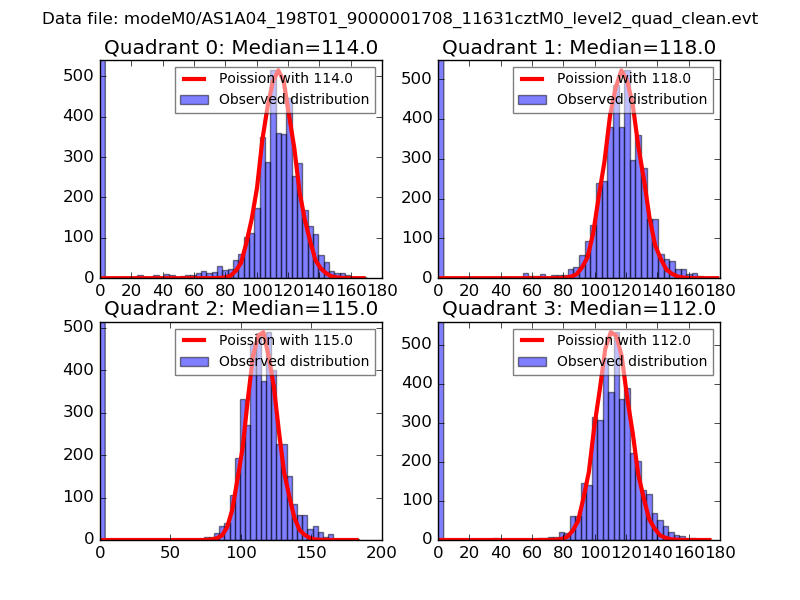 |
 |
| Quadrant-wise count rates Data is divided into 100 sec bins |
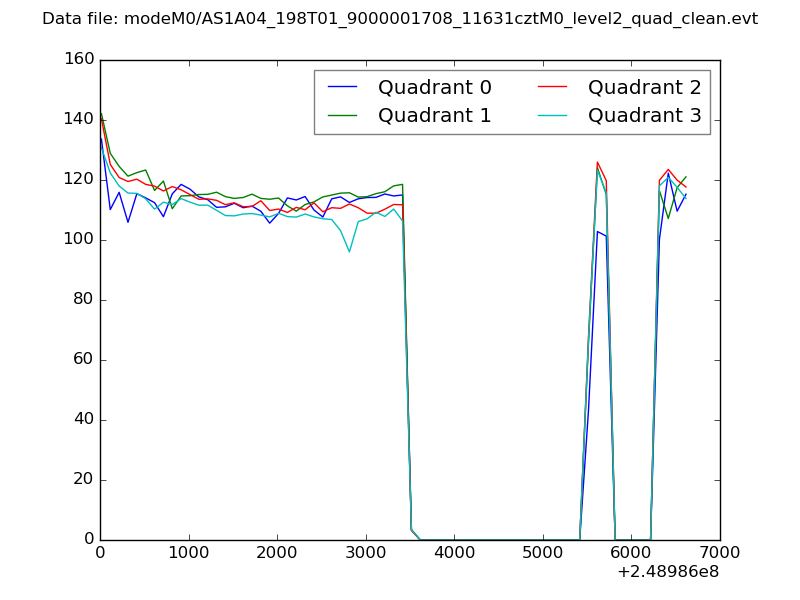 |
|
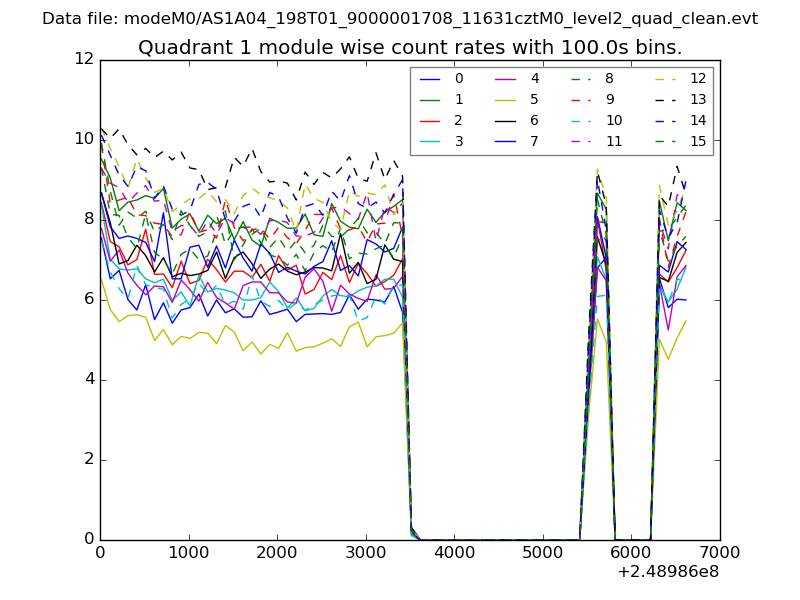
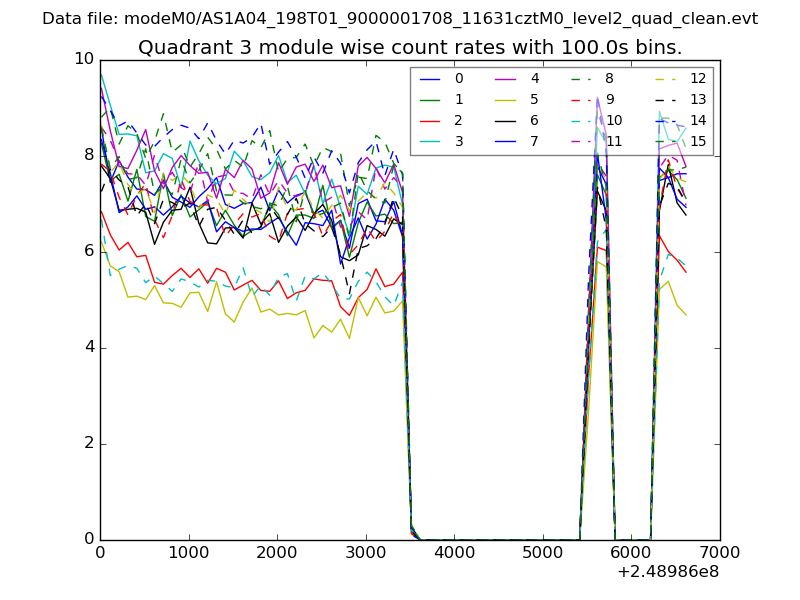
| Module-wise count rates for Quadrant A Data is divided into 100 sec bins |
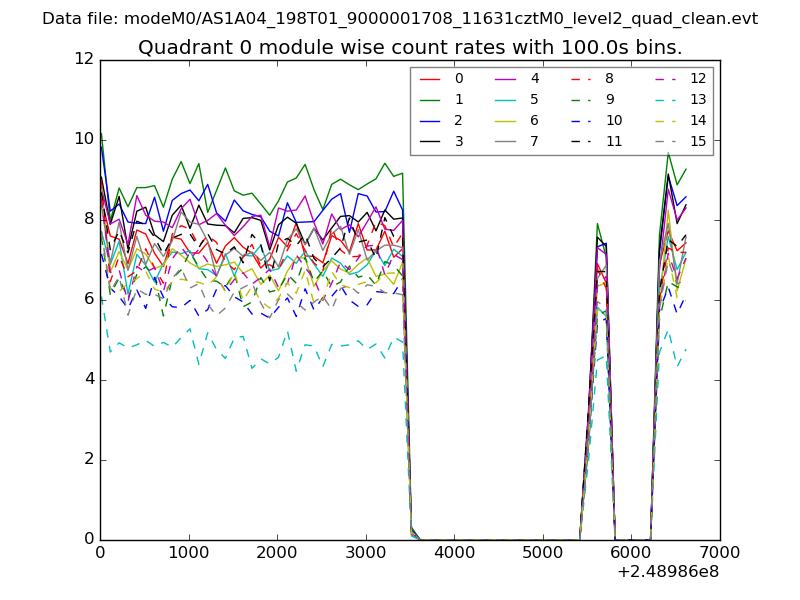 |
 |
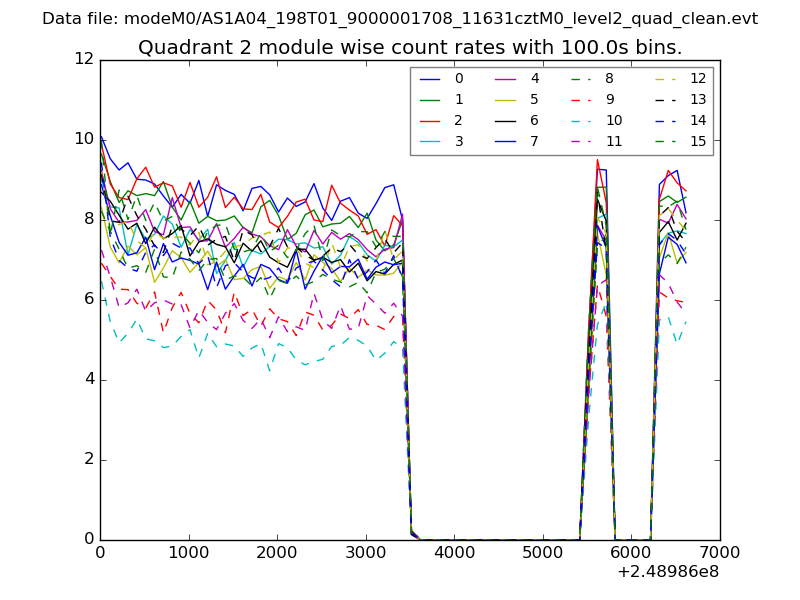
| Module-wise count rates for Quadrant B Data is divided into 100 sec bins |
 |
 |
| Module-wise count rates for Quadrant C Data is divided into 100 sec bins |
 |
 |
| Module-wise count rates for Quadrant D Data is divided into 100 sec bins |
 |
 |
| Parameter | Plot |
|---|---|
| CZT HV Monitor | 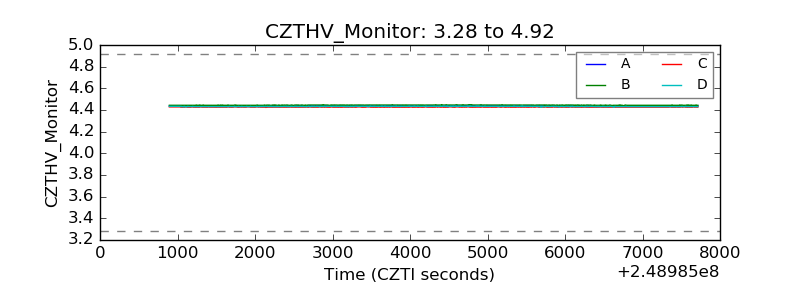 |
| D_VDD | 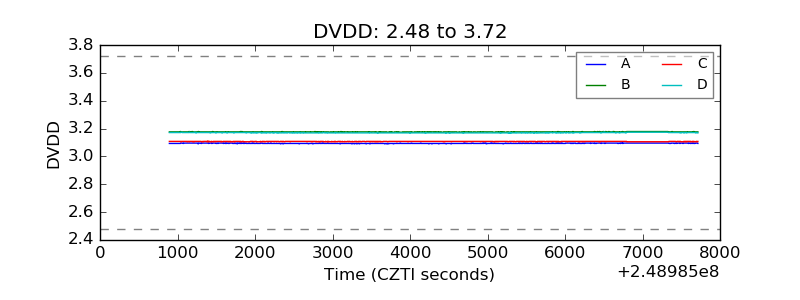 |
| Temperature 1 | 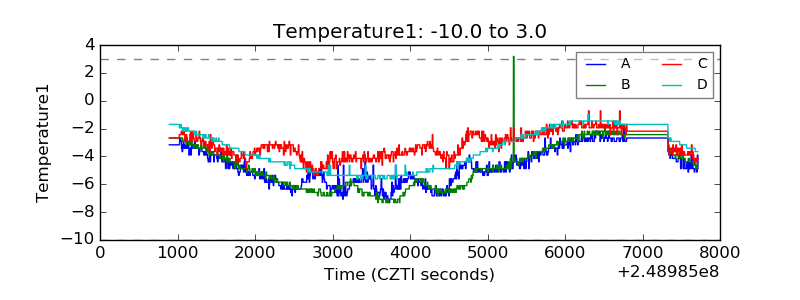 |
| Veto HV Monitor | 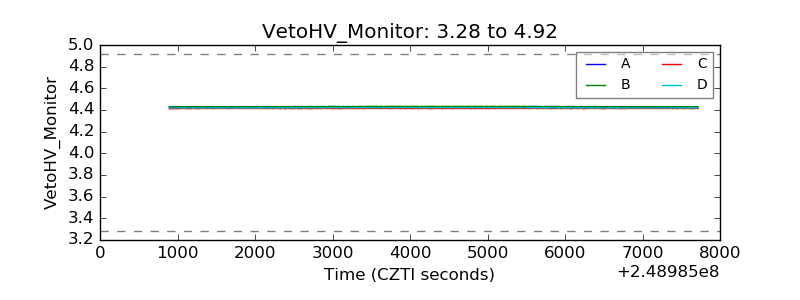 |
| Veto LLD | 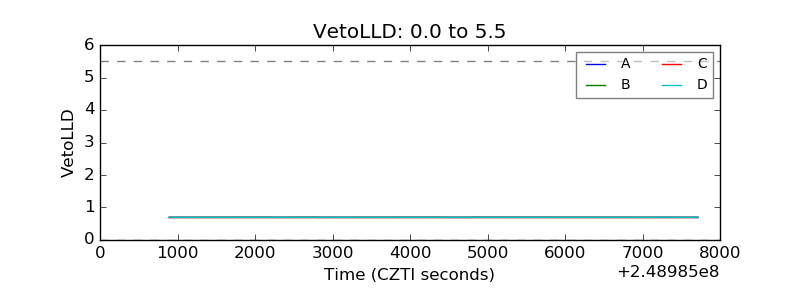 |
| Alpha Counter | 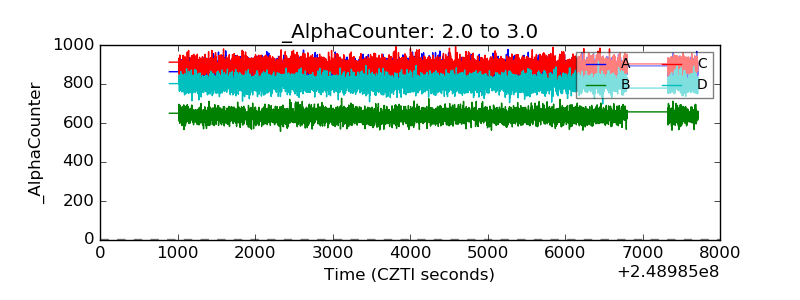 |
| _CPM_Rate | 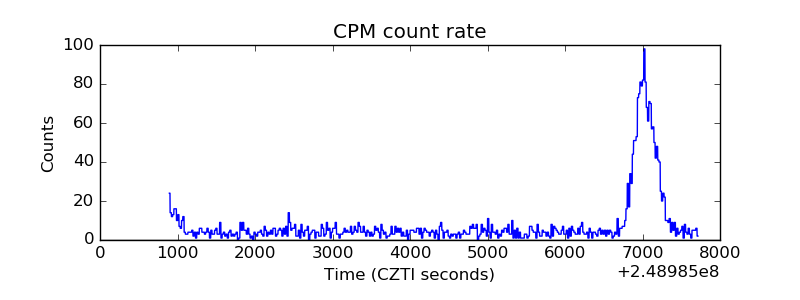 |
| CZT Counter | 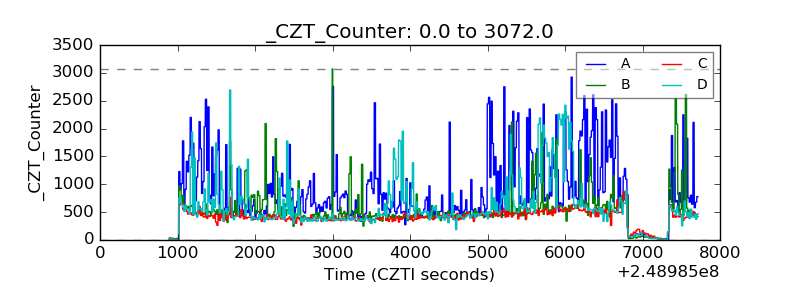 |
| +2.5 Volts monitor | 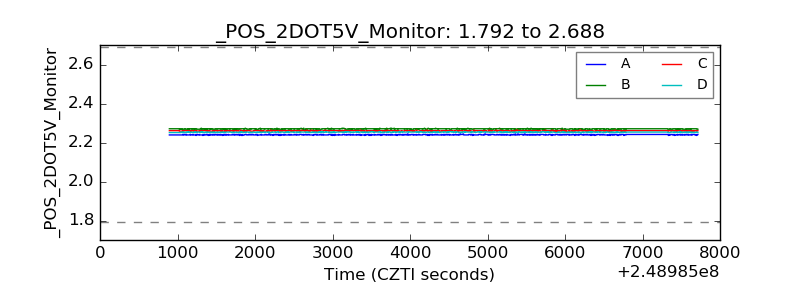 |
| +5 Volts monitor | 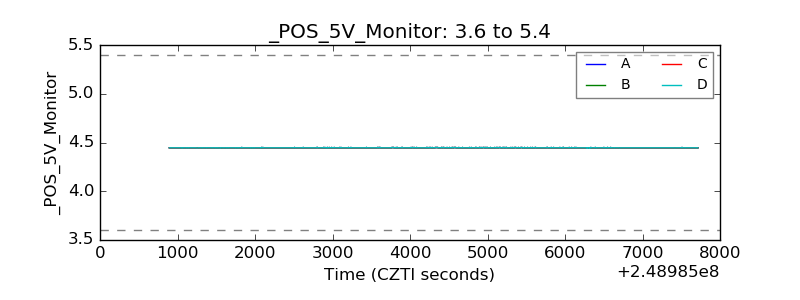 |
| _ROLL_ROT | 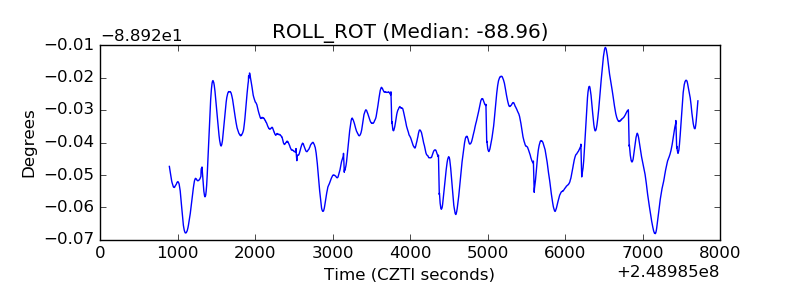 |
| _Roll_DEC | 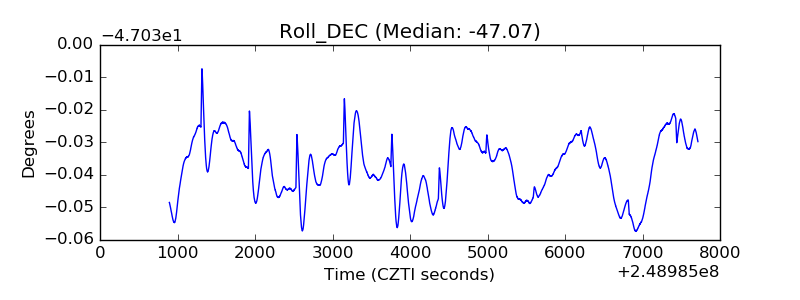 |
| _Roll_RA | 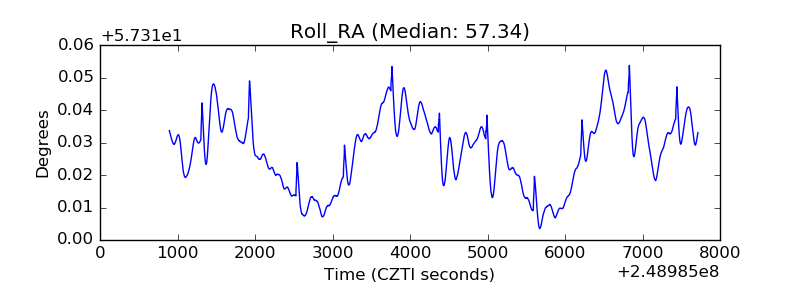 |
| Veto Counter | 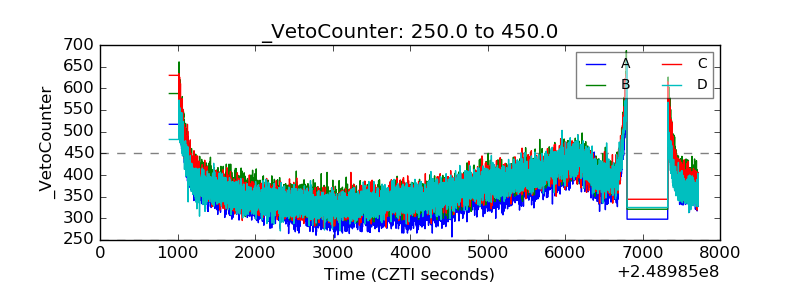 |