| Param | Original file | Final file |
|---|---|---|
| Filename | modeM0/AS1A04_049T01_9000001710cztM0_level2.fits | modeM0/AS1A04_049T01_9000001710cztM0_level2_quad_clean.evt |
| Size (bytes) | 238,144,320 | 220,193,280 |
| Size | 227.1 MB | 210.0 MB |
| Events in quadrant A | 1,428,238 | 1,228,890 |
| Events in quadrant B | 1,444,934 | 1,320,898 |
| Events in quadrant C | 1,497,810 | 1,355,038 |
| Events in quadrant D | 972,884 | 900,101 |
| Mode M9 | |||
|---|---|---|---|
| Quadrant | BADHDUFLAG | Total packets | Discarded packets |
| A | 0 | 50 | 0 |
| B | 0 | 50 | 0 |
| C | 0 | 50 | 0 |
| D | 0 | 50 | 0 |
| Mode SS | |||
|---|---|---|---|
| Quadrant | BADHDUFLAG | Total packets | Discarded packets |
| A | 0 | 552 | 0 |
| B | 0 | 552 | 0 |
| C | 0 | 552 | 0 |
| D | 0 | 552 | 0 |
| Mode M0 | |||
|---|---|---|---|
| Quadrant | BADHDUFLAG | Total packets | Discarded packets |
| A | 0 | 94470 | 0 |
| B | 0 | 69107 | 0 |
| C | 0 | 54963 | 0 |
| D | 0 | 117730 | 0 |
| Quadrant | Total seconds | Saturated seconds | Saturation percentage |
|---|---|---|---|
| A | 27083 | 3701 | 13.665399% |
| B | 27083 | 1186 | 4.379131% |
| C | 27083 | 67 | 0.247388% |
| D | 27083 | 9240 | 34.117343% |
Noise dominated data is calculated using 1-second bins in cleaned event files. If a bin has >2000 counts, and if more than 50% of those come from <1% of pixels, then it is considered to be noise-dominated and hence unusable.
| Quadrant | # 1 sec bins | Bins with >0 counts | Bins with >2000 counts | High rate bins dominated by noise | Noise dominated (total time) | Noise dominated (detector-on time) | Marked lightcurve |
|---|---|---|---|---|---|---|---|
| A | 31964 | 27066 | 0 | 0 | 0.00% | 0.00% |  |
| B | 31964 | 27080 | 0 | 0 | 0.00% | 0.00% |  |
| C | 31964 | 27082 | 0 | 0 | 0.00% | 0.00% | 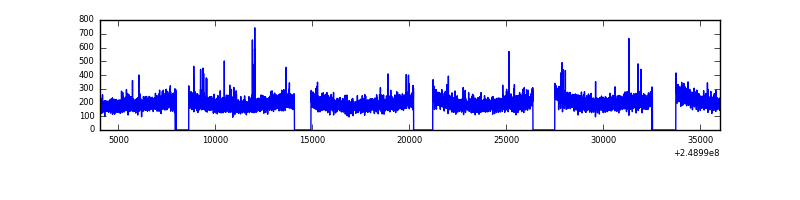 |
| D | 31964 | 26020 | 0 | 0 | 0.00% | 0.00% | 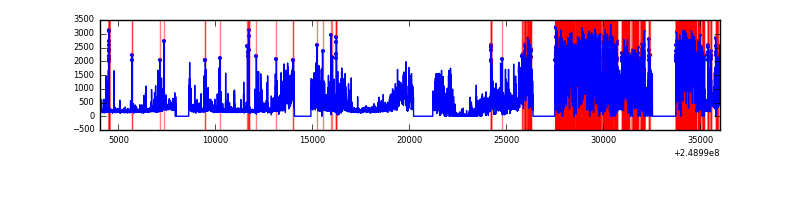 |
Top three noisy pixels from each quadrant. If the there are fewer than three noisy pixels in the level2.evt file, extra rows are filled as -1
| Pixel properties | Quadrant properties | ||||||
|---|---|---|---|---|---|---|---|
| Quadrant | DetID | PixID | Counts | Sigma | Mean | Median | Sigma |
| A | 14 | 188 | 1431 | 11.52 | 371 | 347 | 94.1 |
| A | 0 | 29 | 1400 | 11.19 | 371 | 347 | 94.1 |
| A | 14 | 204 | 1233 | 9.41 | 371 | 347 | 94.1 |
| B | 2 | 9 | 1260 | 11.67 | 382 | 365 | 76.7 |
| B | 5 | 128 | 992 | 8.17 | 382 | 365 | 76.7 |
| B | 3 | 17 | 983 | 8.06 | 382 | 365 | 76.7 |
| C | 12 | 241 | 1108 | 7.14 | 395 | 367 | 103.8 |
| C | 2 | 191 | 1056 | 6.64 | 395 | 367 | 103.8 |
| C | 1 | 65 | 1034 | 6.42 | 395 | 367 | 103.8 |
| D | 6 | 231 | 729 | 6.26 | 277 | 251 | 76.4 |
| D | 3 | 31 | 713 | 6.05 | 277 | 251 | 76.4 |
| D | 3 | 14 | 703 | 5.92 | 277 | 251 | 76.4 |
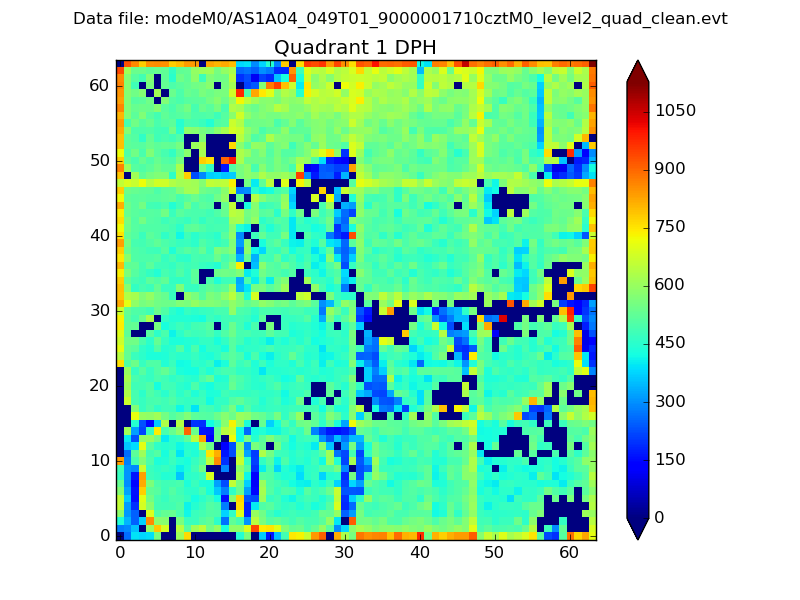
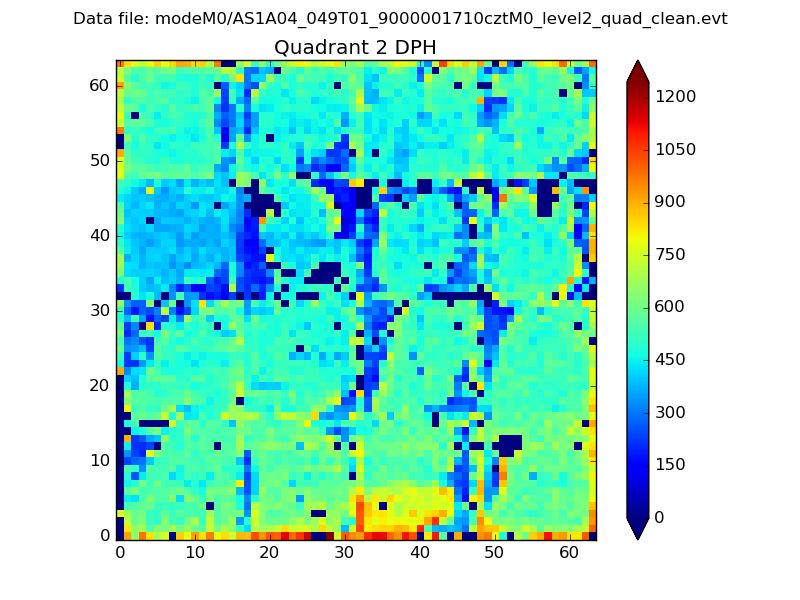
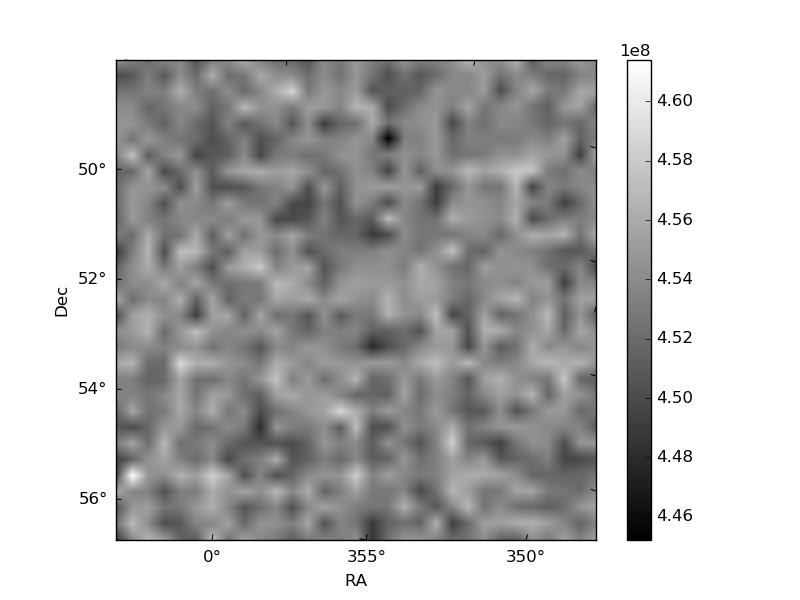
Histogram calculated using DETX and DETY for each event in the final _common_clean file
| Quadrant A |  |
 |
Quadrant B |
|---|---|---|---|
| Quadrant D |  |
 |
Quadrant C |
| Plot type | Count rate plots | Images |
|---|---|---|
| Comparison with Poisson distribution Blue bars denote a histogram of data divided into 1 sec bins. Red curve is a Poisson curve with rate = median count rate of data. |
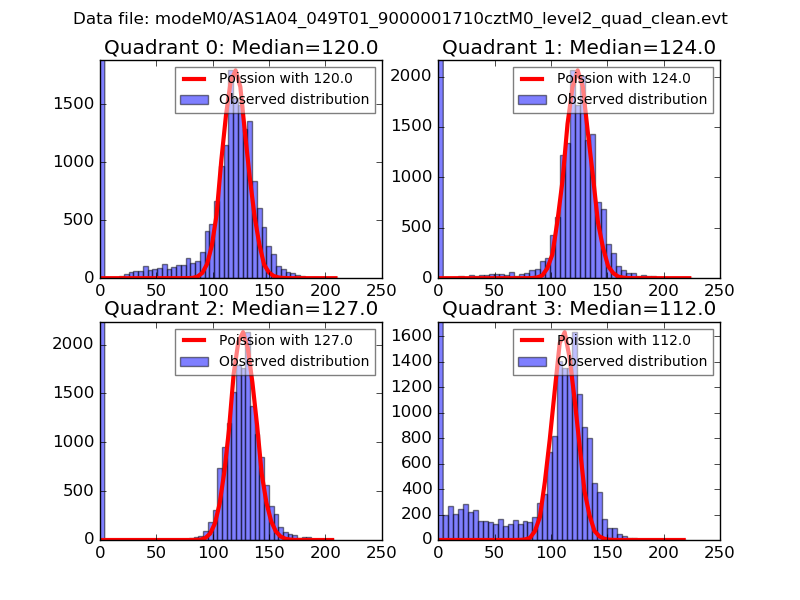 |
 |
| Quadrant-wise count rates Data is divided into 100 sec bins |
 |
|
| Module-wise count rates for Quadrant A Data is divided into 100 sec bins |
 |
 |
| Module-wise count rates for Quadrant B Data is divided into 100 sec bins |
 |
 |
| Module-wise count rates for Quadrant C Data is divided into 100 sec bins |
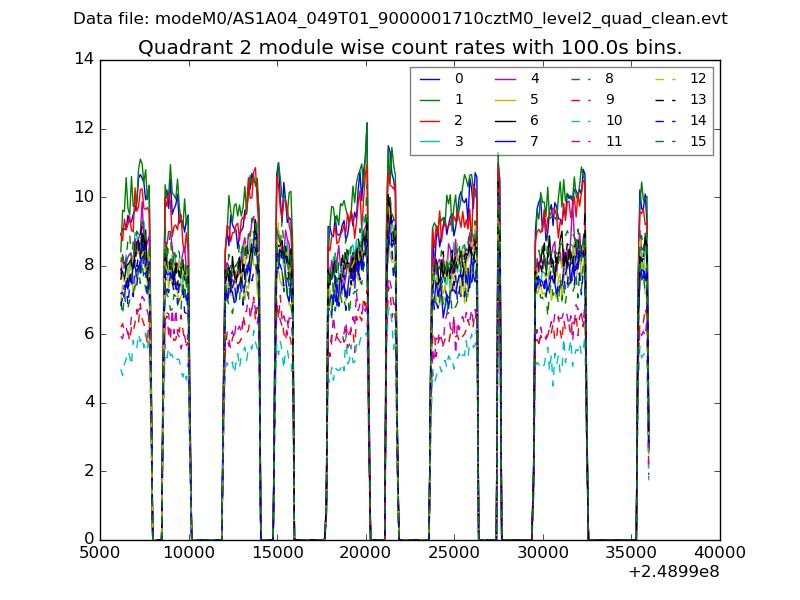 |
 |
| Module-wise count rates for Quadrant D Data is divided into 100 sec bins |
 |
 |
| Parameter | Plot |
|---|---|
| CZT HV Monitor |  |
| D_VDD | 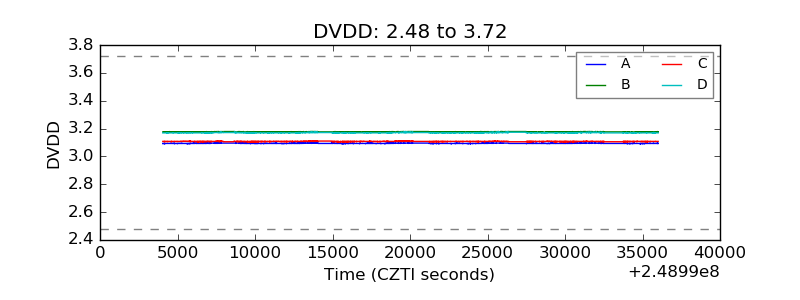 |
| Temperature 1 |  |
| Veto HV Monitor |  |
| Veto LLD | 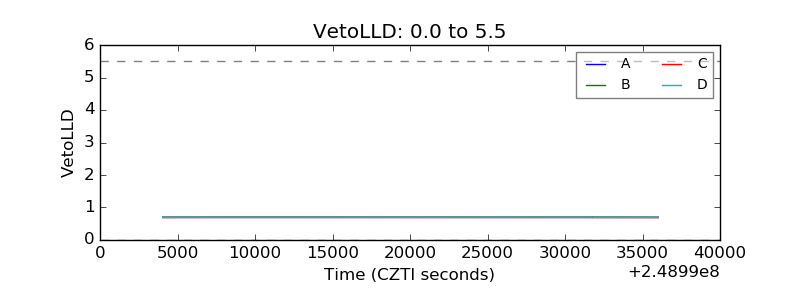 |
| Alpha Counter |  |
| _CPM_Rate | 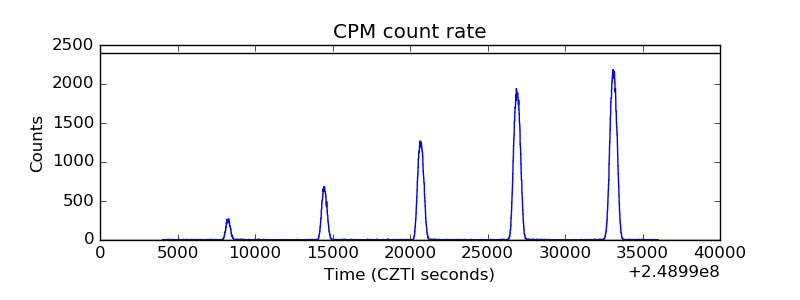 |
| CZT Counter |  |
| +2.5 Volts monitor |  |
| +5 Volts monitor |  |
| _ROLL_ROT |  |
| _Roll_DEC | 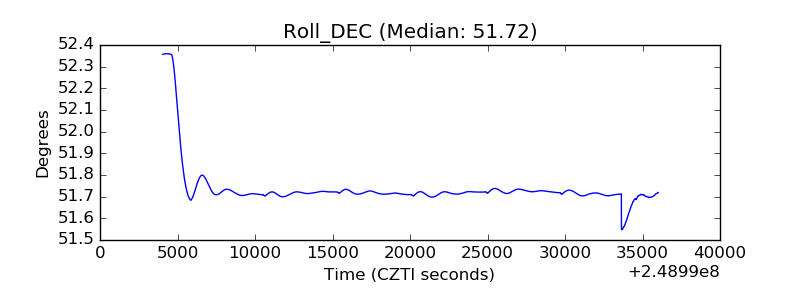 |
| _Roll_RA |  |
| Veto Counter |  |