| Param | Original file | Final file |
|---|---|---|
| Filename | modeM0/AS1A04_049T01_9000001710_11631cztM0_level2.evt | modeM0/AS1A04_049T01_9000001710_11631cztM0_level2_quad_clean.evt |
| Size (bytes) | 1,031,921,280 | 127,393,920 |
| Size | 984.1 MB | 121.5 MB |
| Events in quadrant A | 11,979,416 | 727,774 |
| Events in quadrant B | 6,892,456 | 789,487 |
| Events in quadrant C | 4,794,749 | 824,374 |
| Events in quadrant D | 6,852,484 | 764,213 |
| Mode M9 | |||
|---|---|---|---|
| Quadrant | BADHDUFLAG | Total packets | Discarded packets |
| A | 0 | 16 | 0 |
| B | 0 | 16 | 0 |
| C | 0 | 16 | 0 |
| D | 0 | 16 | 0 |
| Mode SS | |||
|---|---|---|---|
| Quadrant | BADHDUFLAG | Total packets | Discarded packets |
| A | 0 | 220 | 0 |
| B | 0 | 220 | 0 |
| C | 0 | 220 | 0 |
| D | 0 | 220 | 0 |
| Mode M0 | |||
|---|---|---|---|
| Quadrant | BADHDUFLAG | Total packets | Discarded packets |
| A | 0 | 43065 | 3 |
| B | 0 | 28210 | 2 |
| C | 0 | 21944 | 2 |
| D | 0 | 28244 | 2 |
| Quadrant | Total seconds | Saturated seconds | Saturation percentage |
|---|---|---|---|
| A | 10851 | 2295 | 21.150124% |
| B | 10851 | 567 | 5.225325% |
| C | 10851 | 24 | 0.221178% |
| D | 10851 | 600 | 5.529444% |
Noise dominated data is calculated using 1-second bins in cleaned event files. If a bin has >2000 counts, and if more than 50% of those come from <1% of pixels, then it is considered to be noise-dominated and hence unusable.
| Quadrant | # 1 sec bins | Bins with >0 counts | Bins with >2000 counts | High rate bins dominated by noise | Noise dominated (total time) | Noise dominated (detector-on time) | Marked lightcurve |
|---|---|---|---|---|---|---|---|
| A | 12398 | 10854 | 1370 | 1370 | 11.05% | 12.62% | 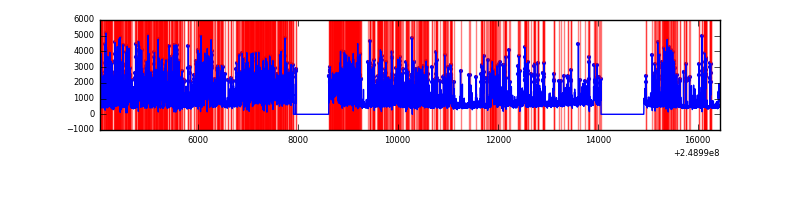 |
| B | 12398 | 10855 | 306 | 306 | 2.47% | 2.82% | 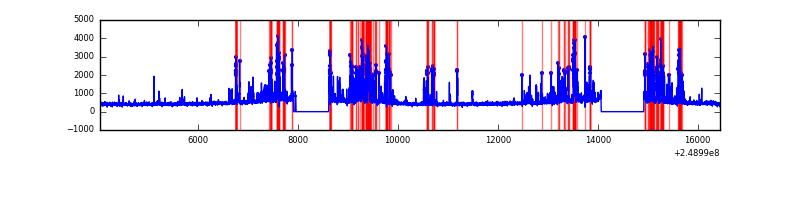 |
| C | 12398 | 10855 | 0 | 0 | 0.00% | 0.00% |  |
| D | 12398 | 10855 | 394 | 394 | 3.18% | 3.63% | 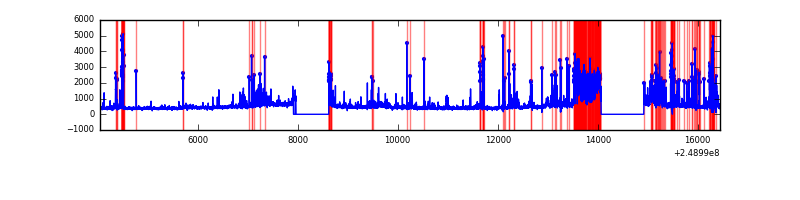 |
Top three noisy pixels from each quadrant. If the there are fewer than three noisy pixels in the level2.evt file, extra rows are filled as -1
| Pixel properties | Quadrant properties | ||||||
|---|---|---|---|---|---|---|---|
| Quadrant | DetID | PixID | Counts | Sigma | Mean | Median | Sigma |
| A | 8 | 5 | 7047209 | 29758.3 | 1148 | 1119 | 236.8 |
| A | 1 | 162 | 182145 | 764.54 | 1148 | 1119 | 236.8 |
| A | 1 | 178 | 105358 | 440.24 | 1148 | 1119 | 236.8 |
| B | 4 | 239 | 1498444 | 6403.07 | 1229 | 1195 | 233.8 |
| B | 10 | 16 | 138963 | 589.17 | 1229 | 1195 | 233.8 |
| B | 3 | 64 | 124608 | 527.78 | 1229 | 1195 | 233.8 |
| C | 12 | 4 | 10212 | 31.5 | 1225 | 1230 | 285.1 |
| C | 13 | 61 | 8866 | 26.78 | 1225 | 1230 | 285.1 |
| C | 1 | 5 | 6352 | 17.96 | 1225 | 1230 | 285.1 |
| D | 13 | 152 | 986254 | 3408.57 | 1191 | 1155 | 289.0 |
| D | 1 | 52 | 628035 | 2169.09 | 1191 | 1155 | 289.0 |
| D | 10 | 253 | 116048 | 397.54 | 1191 | 1155 | 289.0 |
Histogram calculated using DETX and DETY for each event in the final _common_clean file
| Quadrant A |  |
 |
Quadrant B |
|---|---|---|---|
| Quadrant D | 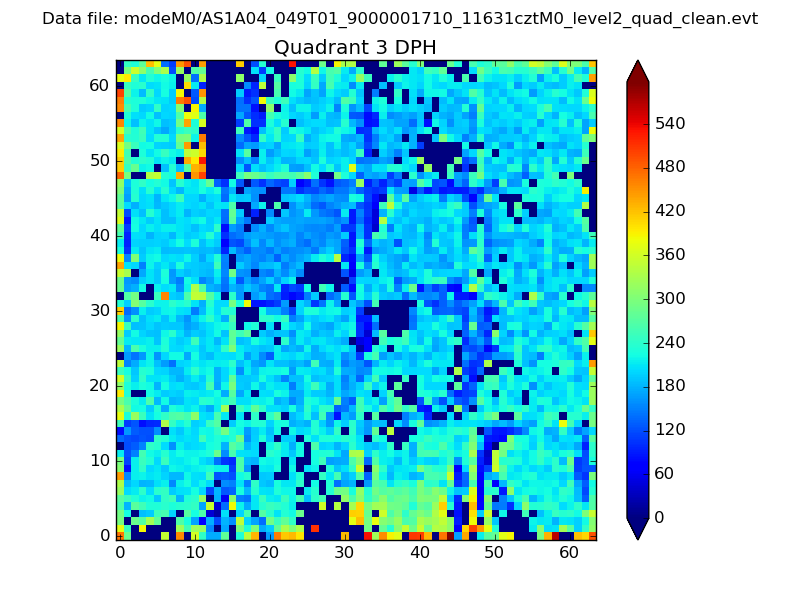 |
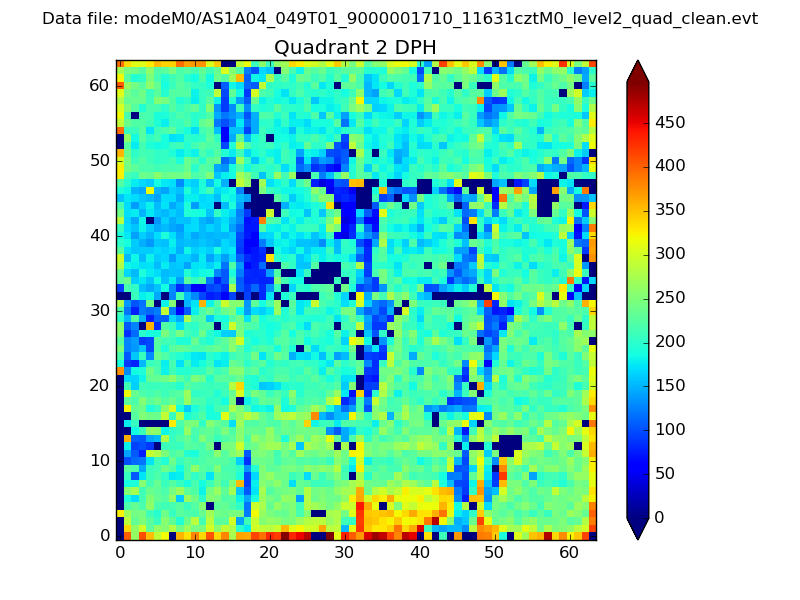 |
Quadrant C |
| Plot type | Count rate plots | Images |
|---|---|---|
| Comparison with Poisson distribution Blue bars denote a histogram of data divided into 1 sec bins. Red curve is a Poisson curve with rate = median count rate of data. |
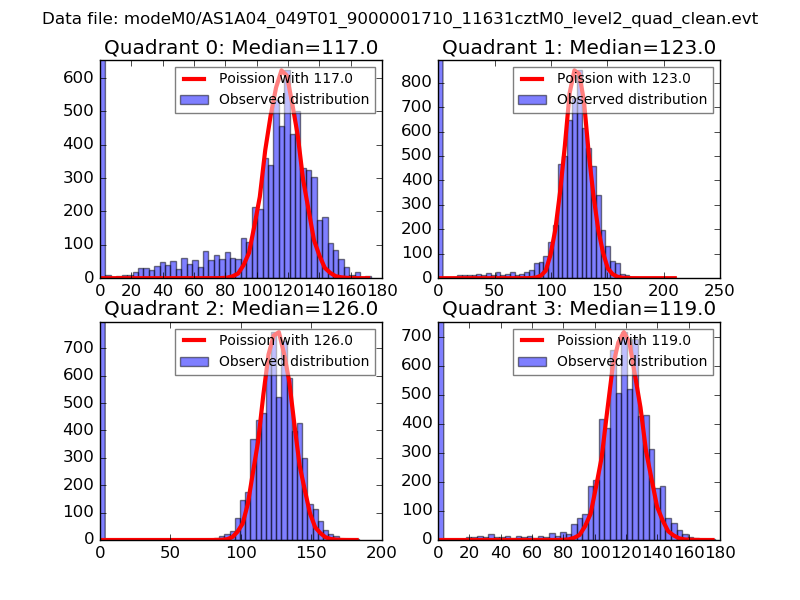 |
 |
| Quadrant-wise count rates Data is divided into 100 sec bins |
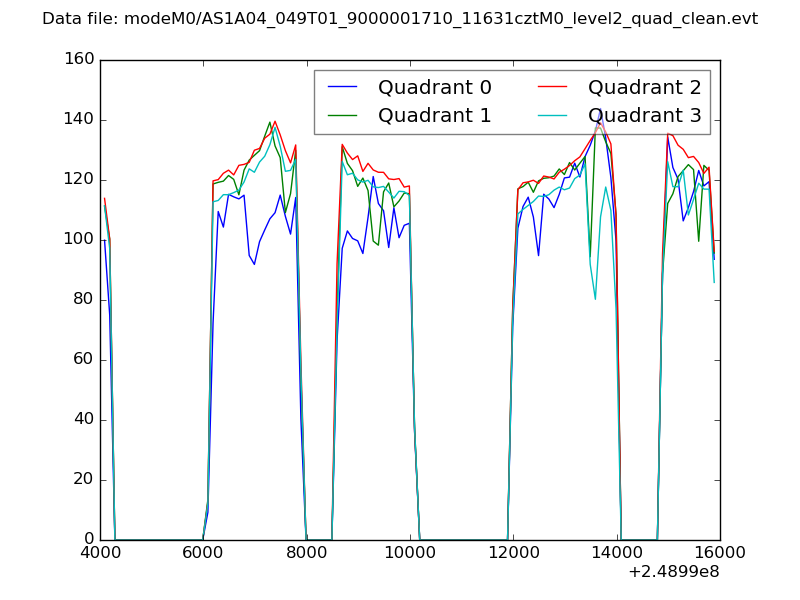 |
|
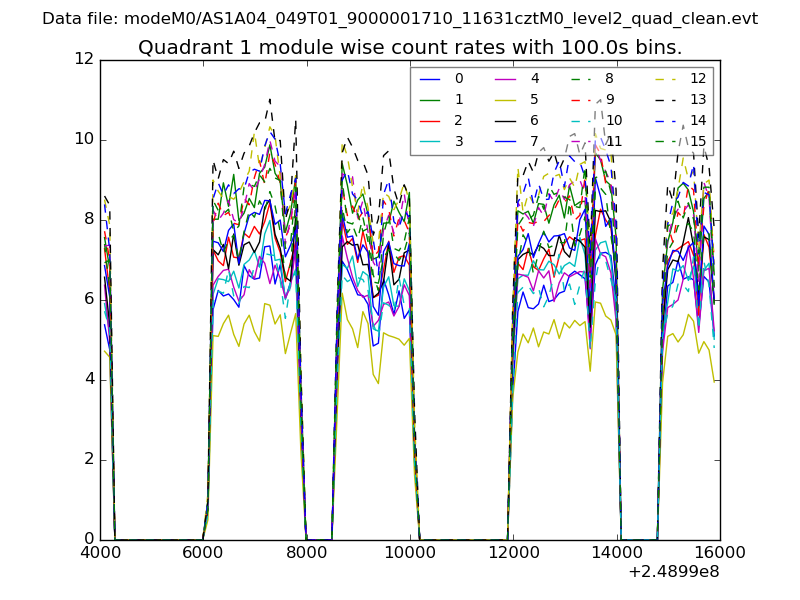
| Module-wise count rates for Quadrant A Data is divided into 100 sec bins |
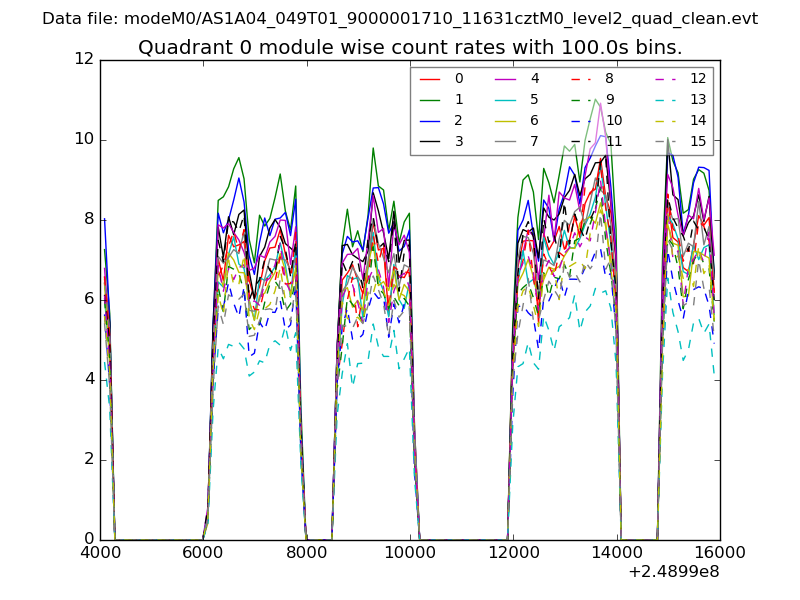 |
 |
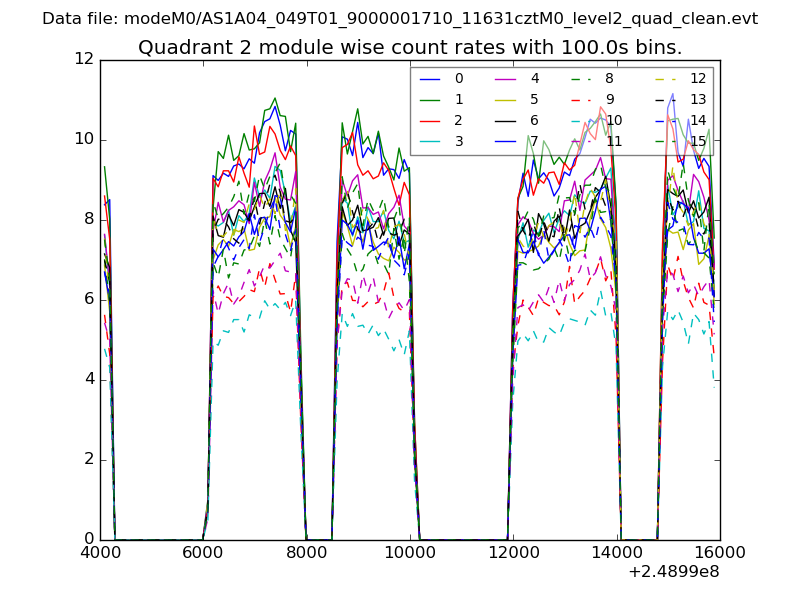
| Module-wise count rates for Quadrant B Data is divided into 100 sec bins |
 |
 |
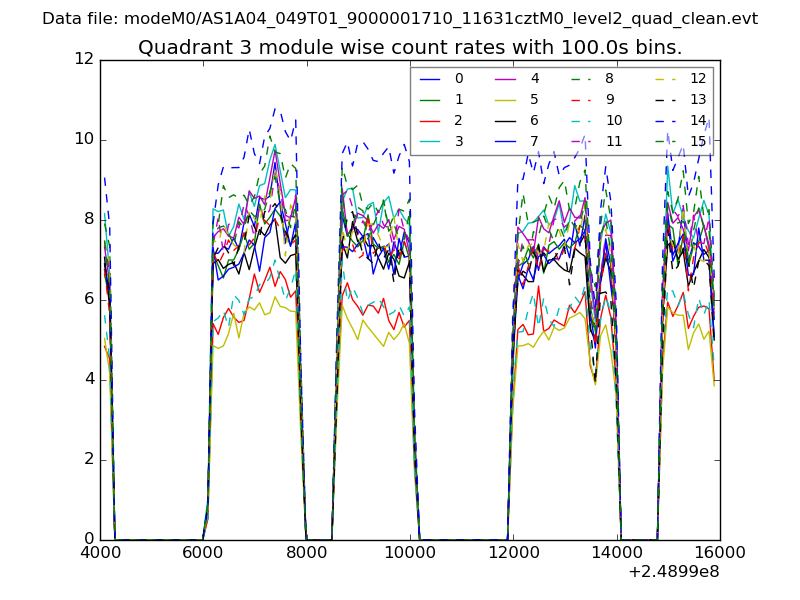
| Module-wise count rates for Quadrant C Data is divided into 100 sec bins |
 |
 |
| Module-wise count rates for Quadrant D Data is divided into 100 sec bins |
 |
 |
| Parameter | Plot |
|---|---|
| CZT HV Monitor | 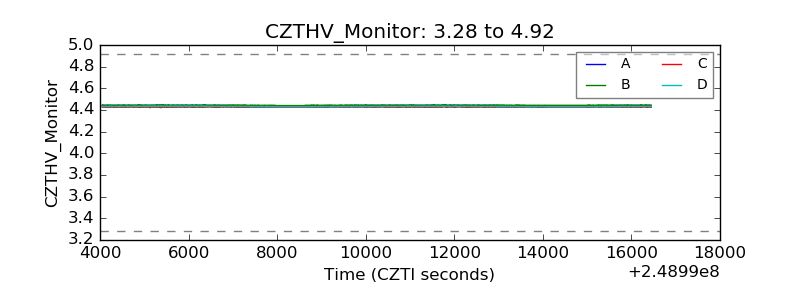 |
| D_VDD | 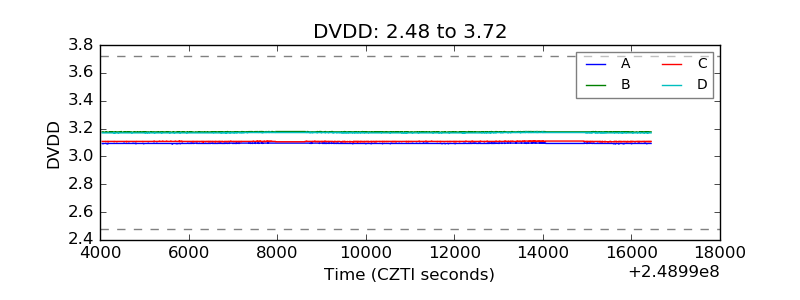 |
| Temperature 1 | 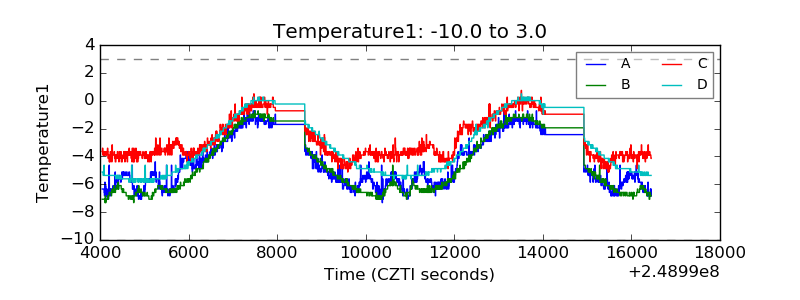 |
| Veto HV Monitor | 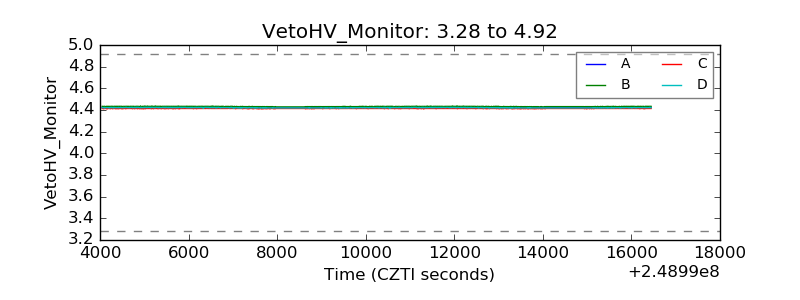 |
| Veto LLD | 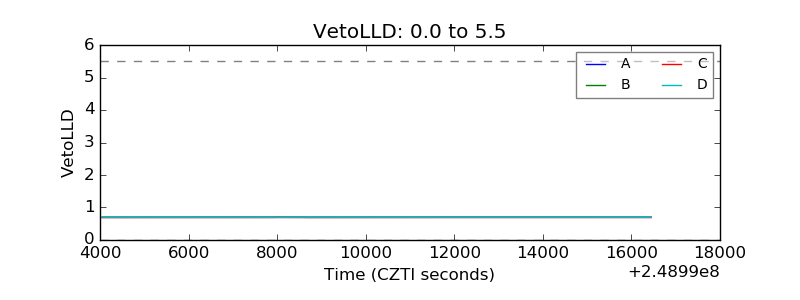 |
| Alpha Counter | 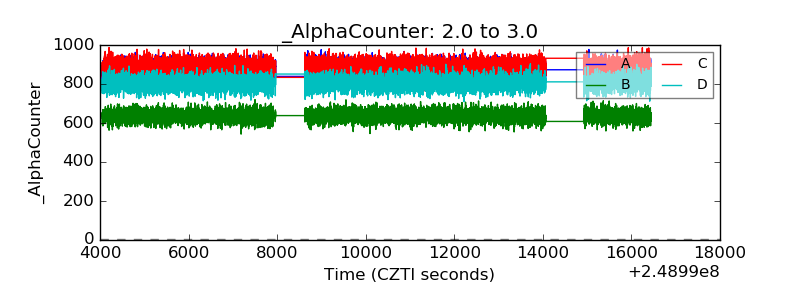 |
| _CPM_Rate | 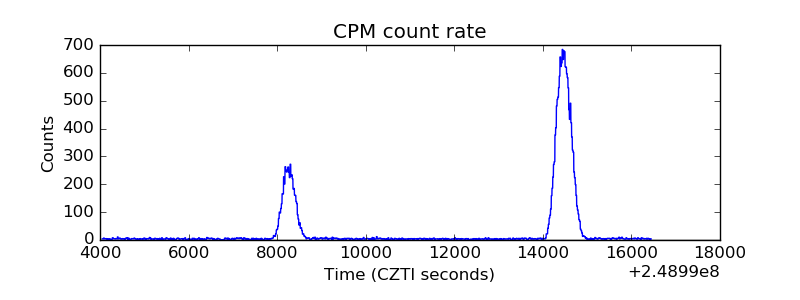 |
| CZT Counter | 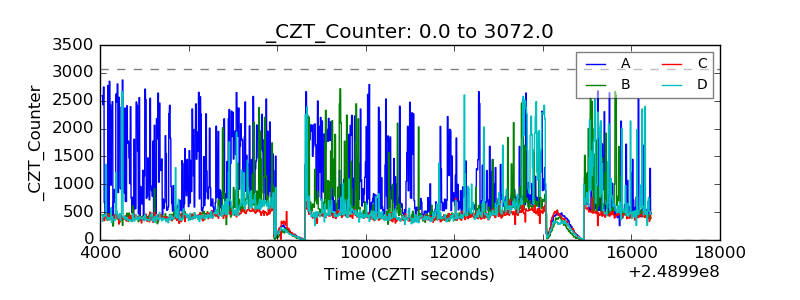 |
| +2.5 Volts monitor |  |
| +5 Volts monitor |  |
| _ROLL_ROT | 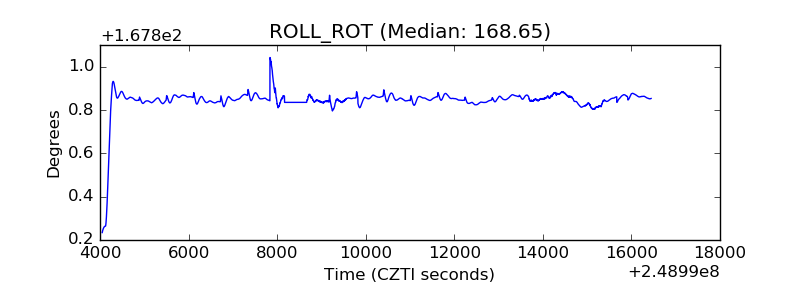 |
| _Roll_DEC | 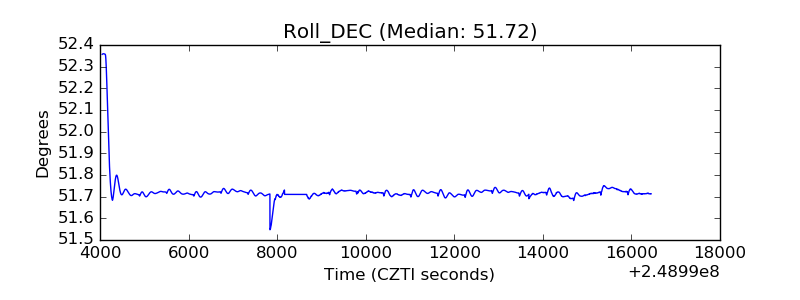 |
| _Roll_RA | 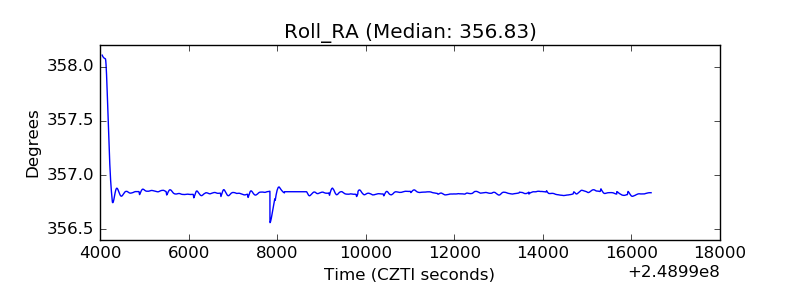 |
| Veto Counter | 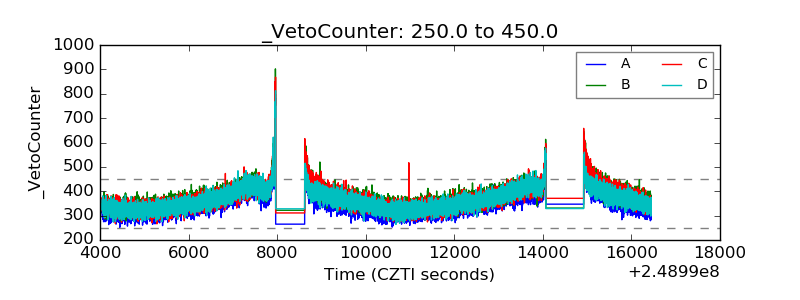 |