| Param | Original file | Final file |
|---|---|---|
| Filename | modeM0/AS1A04_049T01_9000001710_11632cztM0_level2.evt | modeM0/AS1A04_049T01_9000001710_11632cztM0_level2_quad_clean.evt |
| Size (bytes) | 718,361,280 | 89,343,360 |
| Size | 685.1 MB | 85.2 MB |
| Events in quadrant A | 6,417,749 | 540,548 |
| Events in quadrant B | 4,617,385 | 565,444 |
| Events in quadrant C | 3,281,543 | 583,277 |
| Events in quadrant D | 6,950,234 | 512,614 |
| Mode M9 | |||
|---|---|---|---|
| Quadrant | BADHDUFLAG | Total packets | Discarded packets |
| A | 0 | 19 | 0 |
| B | 0 | 19 | 0 |
| C | 0 | 19 | 0 |
| D | 0 | 19 | 0 |
| Mode SS | |||
|---|---|---|---|
| Quadrant | BADHDUFLAG | Total packets | Discarded packets |
| A | 0 | 148 | 0 |
| B | 0 | 148 | 0 |
| C | 0 | 148 | 0 |
| D | 0 | 148 | 0 |
| Mode M0 | |||
|---|---|---|---|
| Quadrant | BADHDUFLAG | Total packets | Discarded packets |
| A | 0 | 24029 | 3 |
| B | 0 | 18720 | 2 |
| C | 0 | 14674 | 2 |
| D | 0 | 25712 | 2 |
| Quadrant | Total seconds | Saturated seconds | Saturation percentage |
|---|---|---|---|
| A | 7223 | 824 | 11.408002% |
| B | 7223 | 325 | 4.499515% |
| C | 7223 | 15 | 0.207670% |
| D | 7223 | 1564 | 21.653053% |
Noise dominated data is calculated using 1-second bins in cleaned event files. If a bin has >2000 counts, and if more than 50% of those come from <1% of pixels, then it is considered to be noise-dominated and hence unusable.
| Quadrant | # 1 sec bins | Bins with >0 counts | Bins with >2000 counts | High rate bins dominated by noise | Noise dominated (total time) | Noise dominated (detector-on time) | Marked lightcurve |
|---|---|---|---|---|---|---|---|
| A | 9069 | 7226 | 375 | 375 | 4.13% | 5.19% | 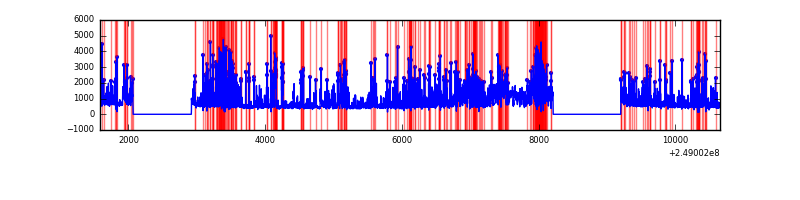 |
| B | 9069 | 7226 | 174 | 174 | 1.92% | 2.41% |  |
| C | 9069 | 7226 | 0 | 0 | 0.00% | 0.00% | 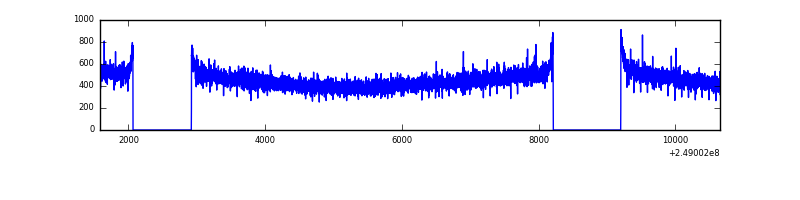 |
| D | 9068 | 7225 | 691 | 691 | 7.62% | 9.56% | 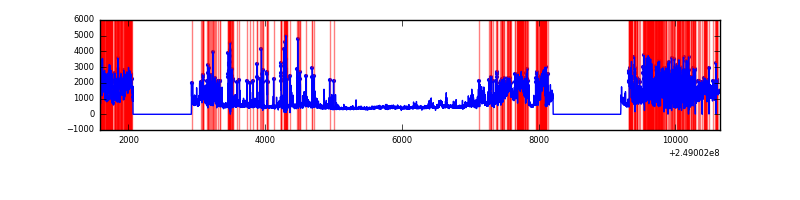 |
Top three noisy pixels from each quadrant. If the there are fewer than three noisy pixels in the level2.evt file, extra rows are filled as -1
| Pixel properties | Quadrant properties | ||||||
|---|---|---|---|---|---|---|---|
| Quadrant | DetID | PixID | Counts | Sigma | Mean | Median | Sigma |
| A | 8 | 5 | 2848966 | 17088.0 | 821 | 801 | 166.7 |
| A | 1 | 162 | 125771 | 749.78 | 821 | 801 | 166.7 |
| A | 9 | 143 | 70012 | 415.24 | 821 | 801 | 166.7 |
| B | 4 | 239 | 1020102 | 6291.94 | 847 | 825 | 162.0 |
| B | 3 | 64 | 83616 | 511.06 | 847 | 825 | 162.0 |
| B | 15 | 204 | 69376 | 423.16 | 847 | 825 | 162.0 |
| C | 13 | 61 | 6075 | 26.35 | 841 | 843 | 198.5 |
| C | 3 | 202 | 2162 | 6.64 | 841 | 843 | 198.5 |
| C | -1 | -1 | -1 | -1.0 | 841 | 843 | 198.5 |
| D | 13 | 152 | 3373013 | 18987.43 | 733 | 710 | 177.6 |
| D | 1 | 52 | 370468 | 2081.89 | 733 | 710 | 177.6 |
| D | 10 | 253 | 94468 | 527.9 | 733 | 710 | 177.6 |
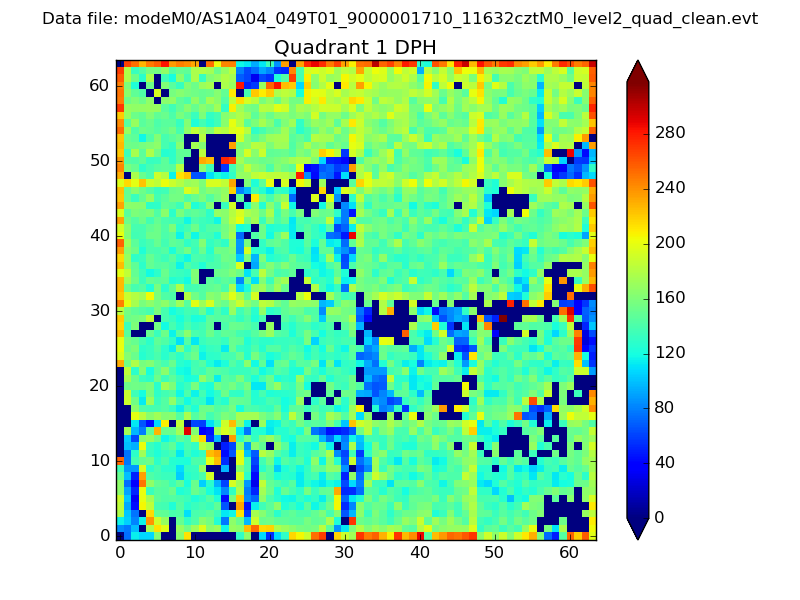
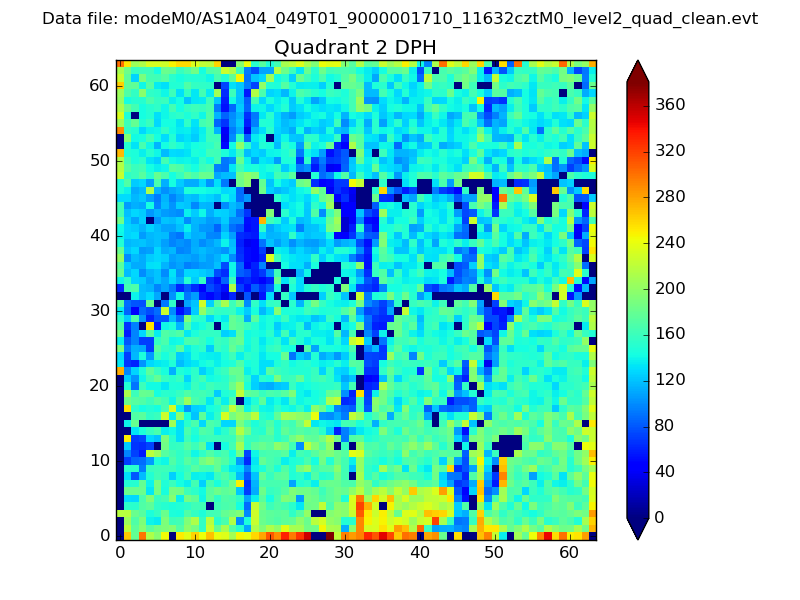
Histogram calculated using DETX and DETY for each event in the final _common_clean file
| Quadrant A | 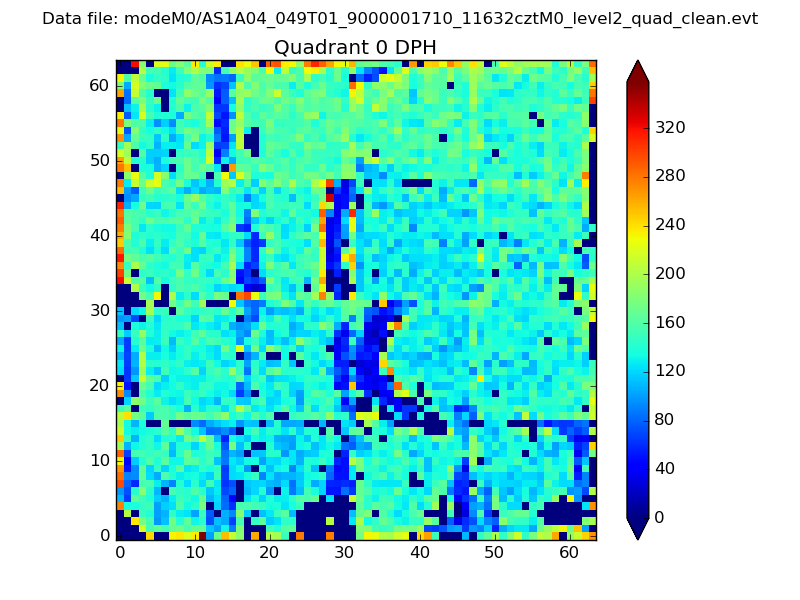 |
 |
Quadrant B |
|---|---|---|---|
| Quadrant D | 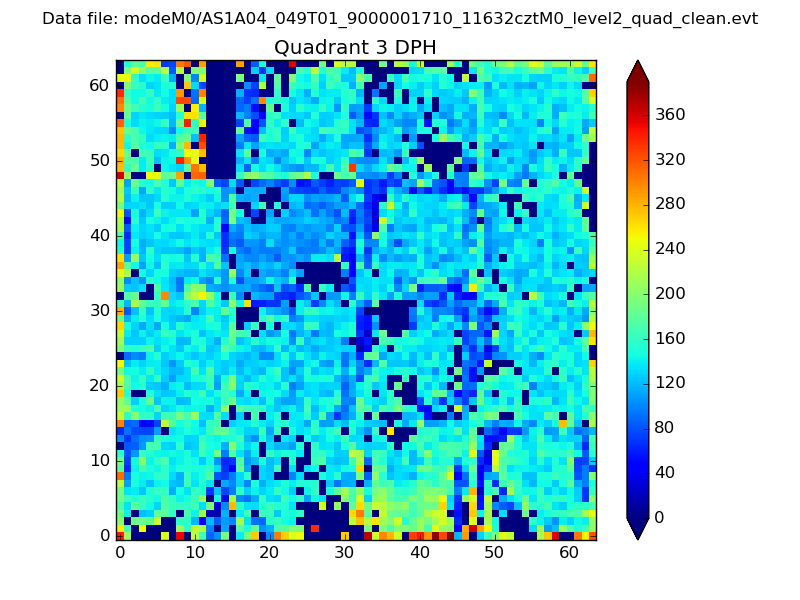 |
 |
Quadrant C |
| Plot type | Count rate plots | Images |
|---|---|---|
| Comparison with Poisson distribution Blue bars denote a histogram of data divided into 1 sec bins. Red curve is a Poisson curve with rate = median count rate of data. |
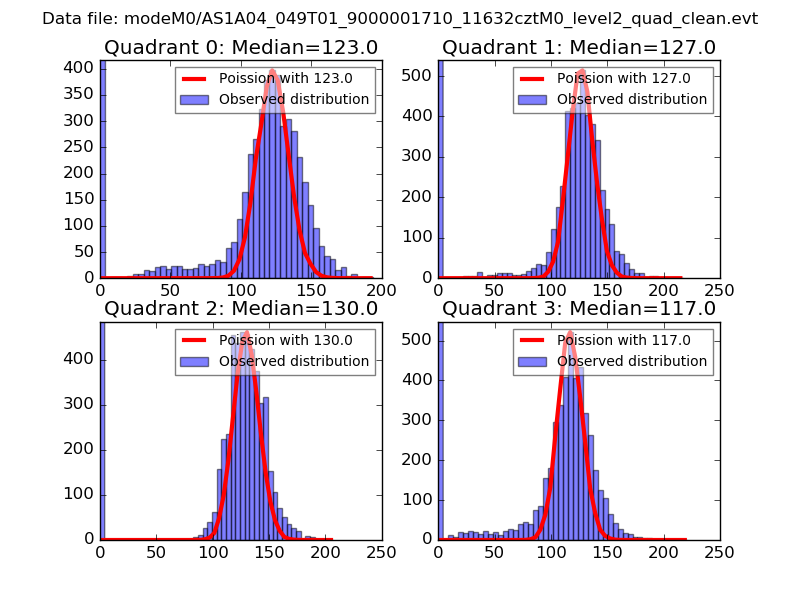 |
 |
| Quadrant-wise count rates Data is divided into 100 sec bins |
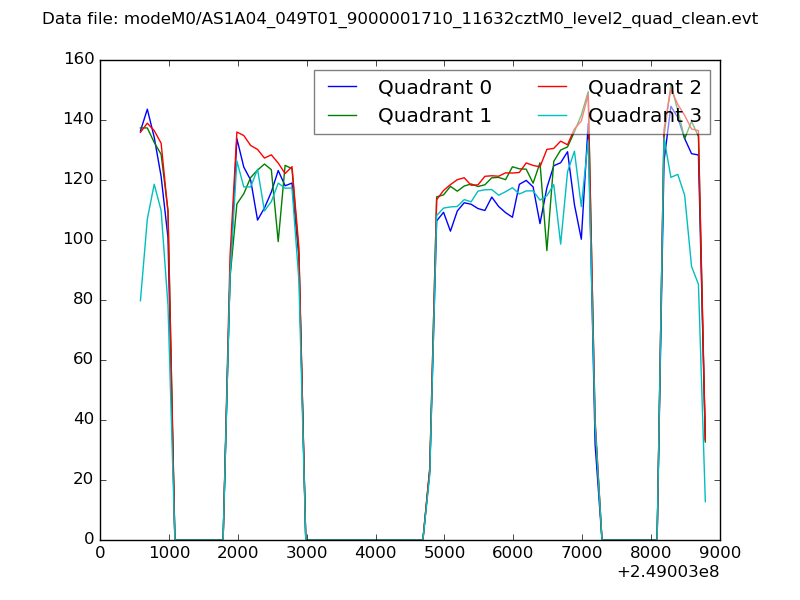 |
|
| Module-wise count rates for Quadrant A Data is divided into 100 sec bins |
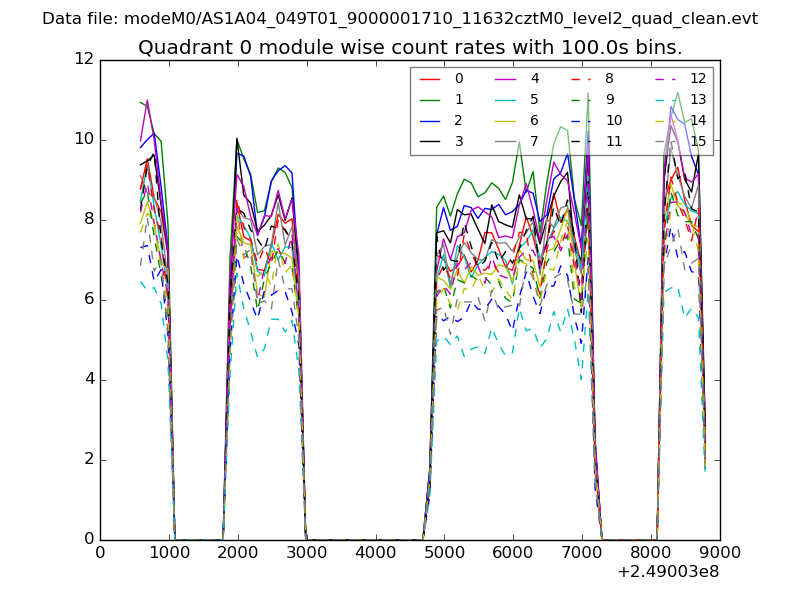 |
 |
| Module-wise count rates for Quadrant B Data is divided into 100 sec bins |
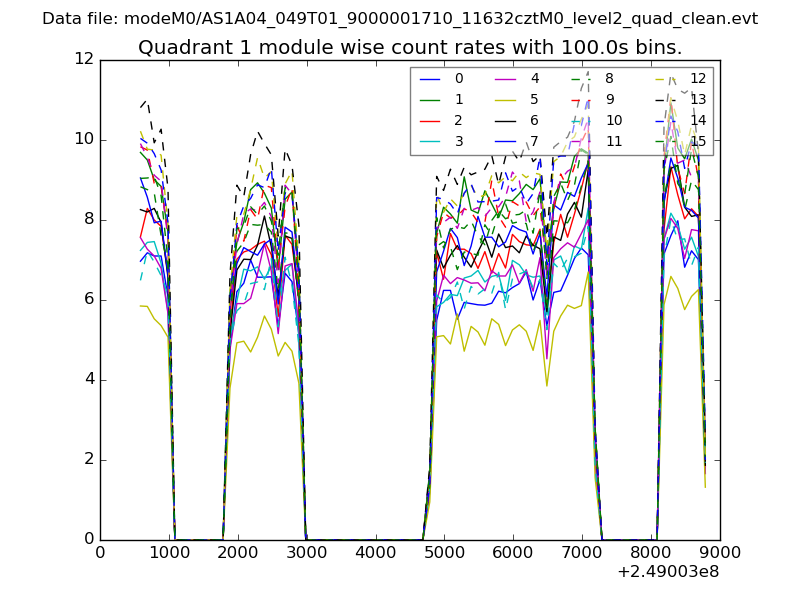 |
 |
| Module-wise count rates for Quadrant C Data is divided into 100 sec bins |
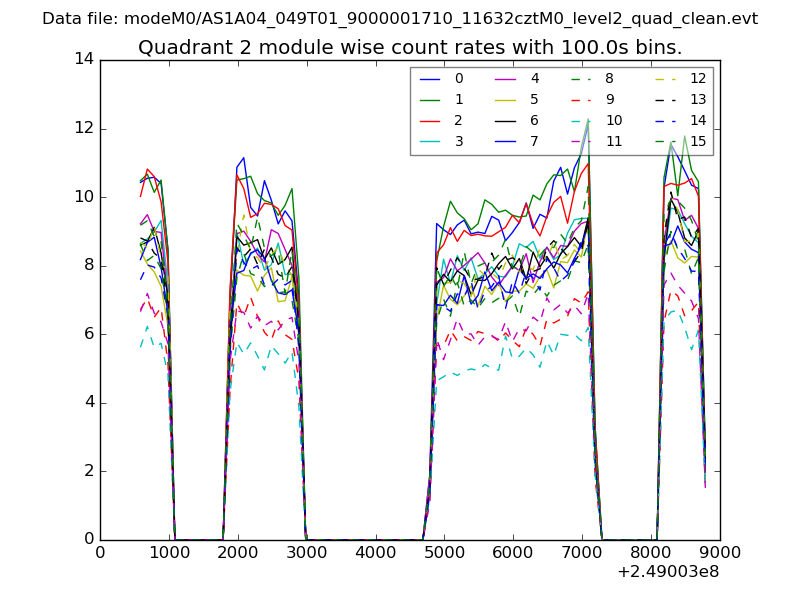 |
 |
| Module-wise count rates for Quadrant D Data is divided into 100 sec bins |
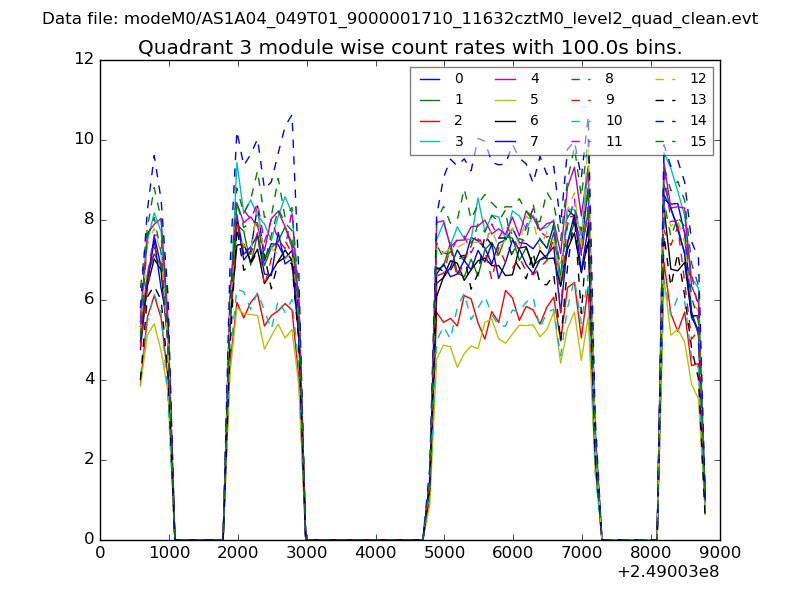 |
 |
| Parameter | Plot |
|---|---|
| CZT HV Monitor | 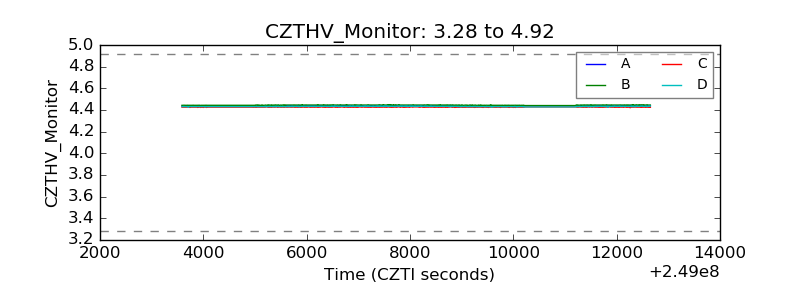 |
| D_VDD | 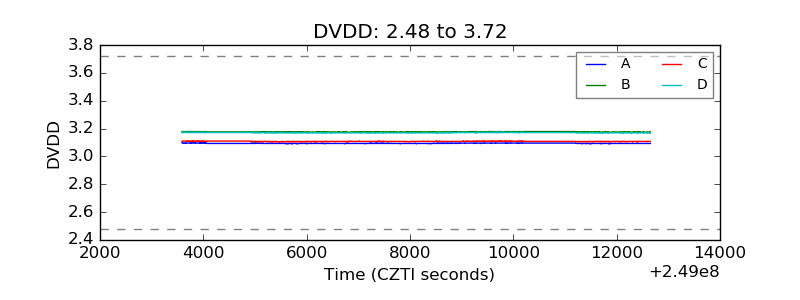 |
| Temperature 1 | 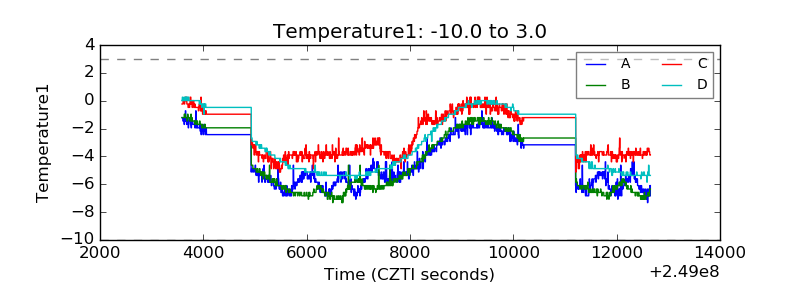 |
| Veto HV Monitor | 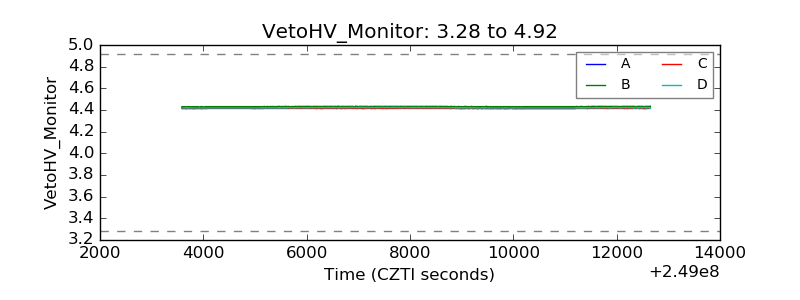 |
| Veto LLD | 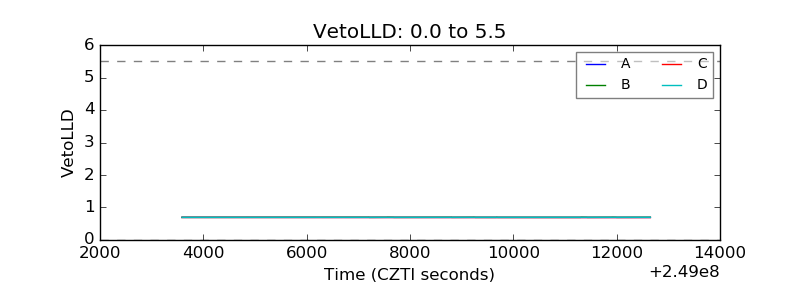 |
| Alpha Counter | 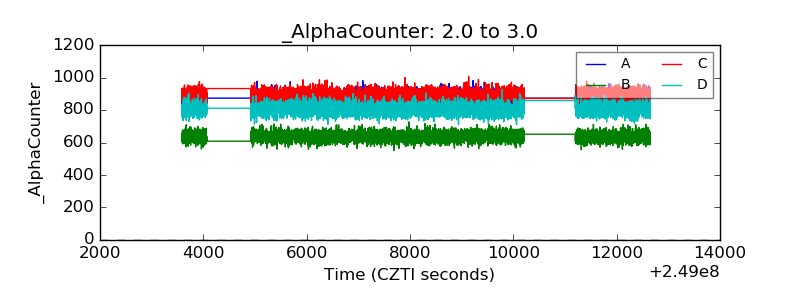 |
| _CPM_Rate | 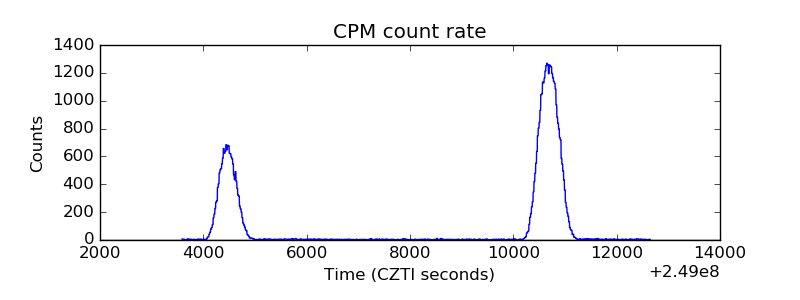 |
| CZT Counter | 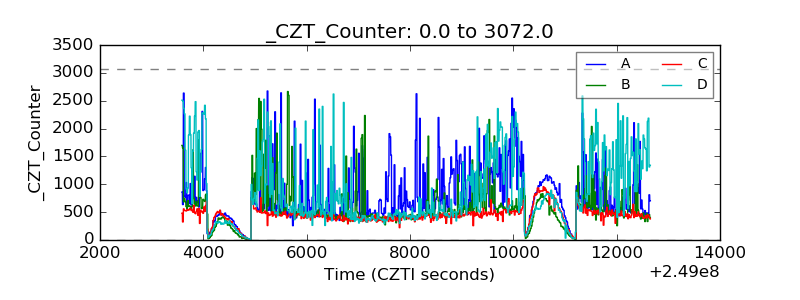 |
| +2.5 Volts monitor |  |
| +5 Volts monitor |  |
| _ROLL_ROT | 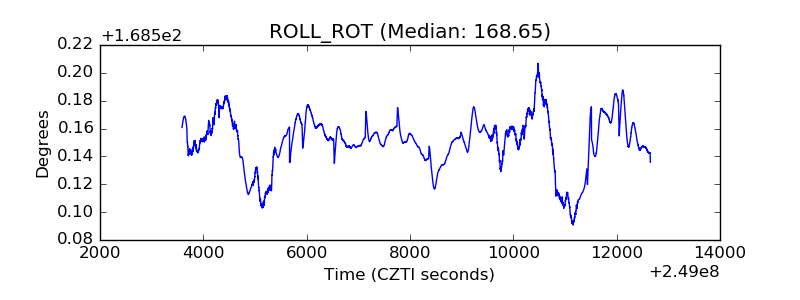 |
| _Roll_DEC | 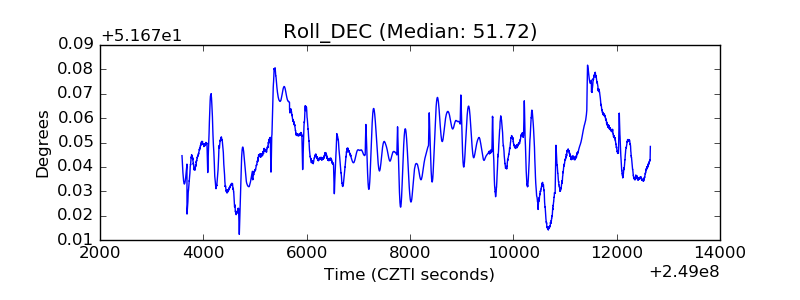 |
| _Roll_RA | 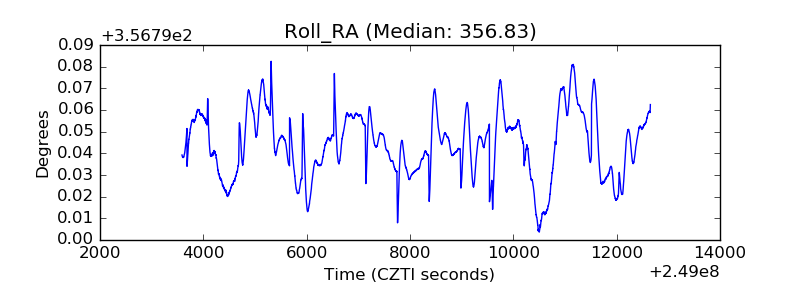 |
| Veto Counter | 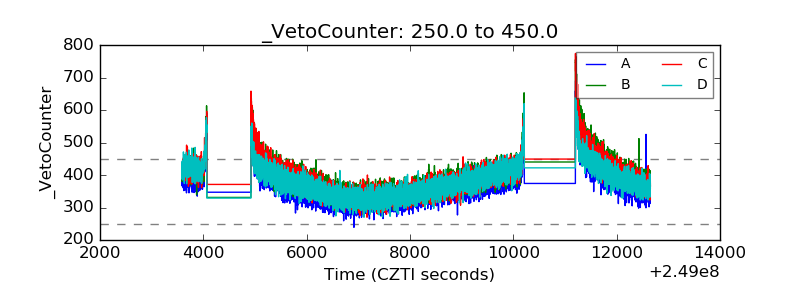 |