| Param | Original file | Final file |
|---|---|---|
| Filename | modeM0/AS1A04_049T01_9000001710_11636cztM0_level2.evt | modeM0/AS1A04_049T01_9000001710_11636cztM0_level2_quad_clean.evt |
| Size (bytes) | 284,595,840 | 14,883,840 |
| Size | 271.4 MB | 14.2 MB |
| Events in quadrant A | 1,574,703 | 72,785 |
| Events in quadrant B | 1,258,379 | 79,635 |
| Events in quadrant C | 1,055,781 | 78,922 |
| Events in quadrant D | 4,576,855 | 57,229 |
| Mode SS | |||
|---|---|---|---|
| Quadrant | BADHDUFLAG | Total packets | Discarded packets |
| A | 0 | 46 | 0 |
| B | 0 | 46 | 0 |
| C | 0 | 46 | 0 |
| D | 0 | 46 | 0 |
| Mode M0 | |||
|---|---|---|---|
| Quadrant | BADHDUFLAG | Total packets | Discarded packets |
| A | 0 | 6184 | 1 |
| B | 0 | 5119 | 1 |
| C | 0 | 4561 | 1 |
| D | 0 | 15086 | 1 |
| Quadrant | Total seconds | Saturated seconds | Saturation percentage |
|---|---|---|---|
| A | 2227 | 86 | 3.861697% |
| B | 2227 | 16 | 0.718455% |
| C | 2227 | 0 | 0.000000% |
| D | 2227 | 1528 | 68.612483% |
Noise dominated data is calculated using 1-second bins in cleaned event files. If a bin has >2000 counts, and if more than 50% of those come from <1% of pixels, then it is considered to be noise-dominated and hence unusable.
| Quadrant | # 1 sec bins | Bins with >0 counts | Bins with >2000 counts | High rate bins dominated by noise | Noise dominated (total time) | Noise dominated (detector-on time) | Marked lightcurve |
|---|---|---|---|---|---|---|---|
| A | 2228 | 2228 | 58 | 58 | 2.60% | 2.60% | 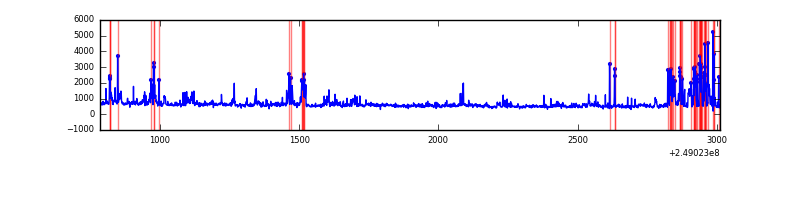 |
| B | 2228 | 2228 | 8 | 8 | 0.36% | 0.36% |  |
| C | 2228 | 2228 | 0 | 0 | 0.00% | 0.00% | 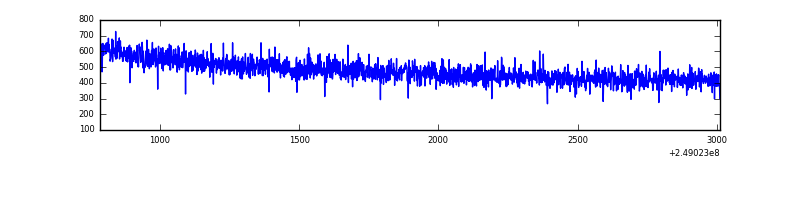 |
| D | 2228 | 2228 | 1415 | 1415 | 63.51% | 63.51% | 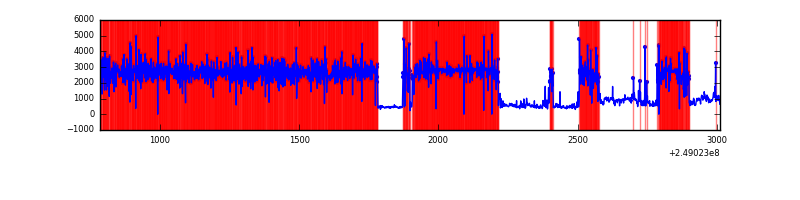 |
Top three noisy pixels from each quadrant. If the there are fewer than three noisy pixels in the level2.evt file, extra rows are filled as -1
| Pixel properties | Quadrant properties | ||||||
|---|---|---|---|---|---|---|---|
| Quadrant | DetID | PixID | Counts | Sigma | Mean | Median | Sigma |
| A | 8 | 5 | 380118 | 6529.29 | 279 | 273 | 58.2 |
| A | 1 | 162 | 42937 | 733.37 | 279 | 273 | 58.2 |
| A | 1 | 178 | 23565 | 400.37 | 279 | 273 | 58.2 |
| B | 4 | 239 | 135190 | 2467.47 | 285 | 279 | 54.7 |
| B | 0 | 219 | 6436 | 112.61 | 285 | 279 | 54.7 |
| B | 12 | 111 | 5832 | 101.56 | 285 | 279 | 54.7 |
| C | 13 | 61 | 2085 | 28.17 | 270 | 272 | 64.4 |
| C | 3 | 202 | 672 | 6.22 | 270 | 272 | 64.4 |
| C | -1 | -1 | -1 | -1.0 | 270 | 272 | 64.4 |
| D | 1 | 52 | 3843709 | 104971.18 | 149 | 145 | 36.6 |
| D | 13 | 152 | 84663 | 2308.26 | 149 | 145 | 36.6 |
| D | 13 | 122 | 41027 | 1116.52 | 149 | 145 | 36.6 |
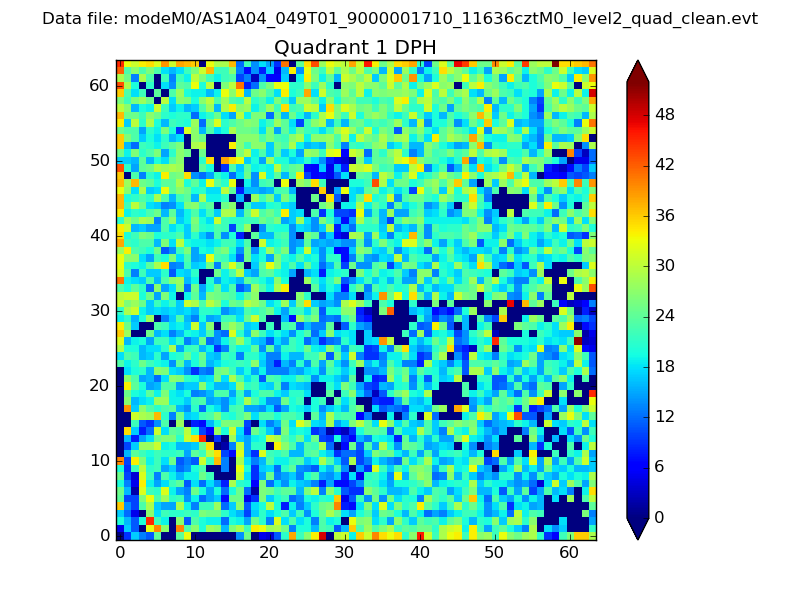
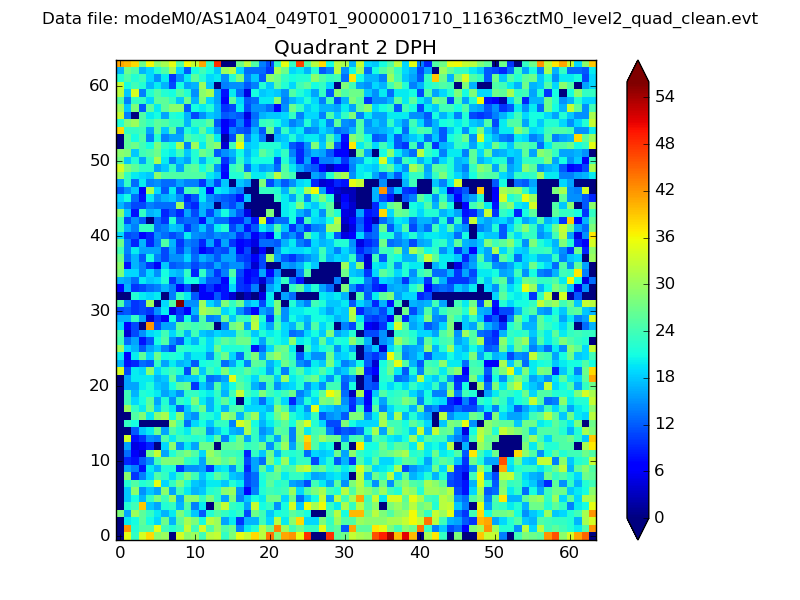
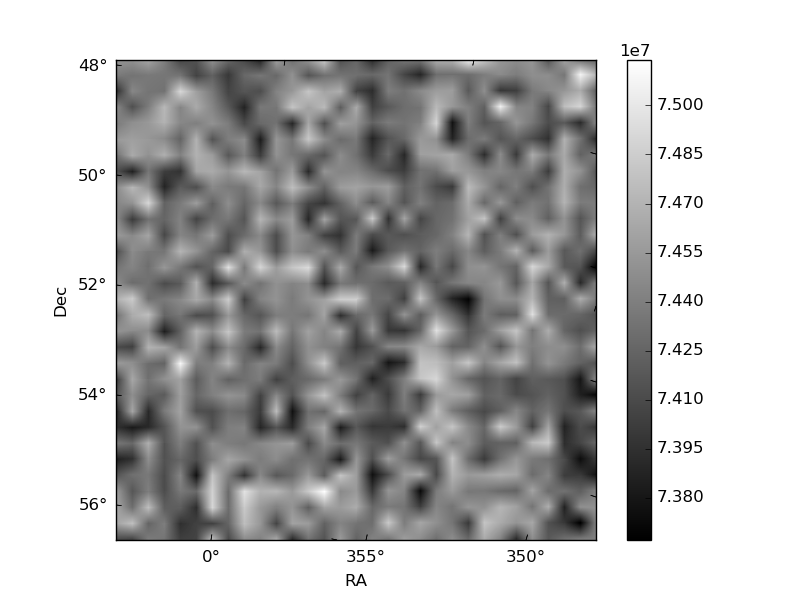
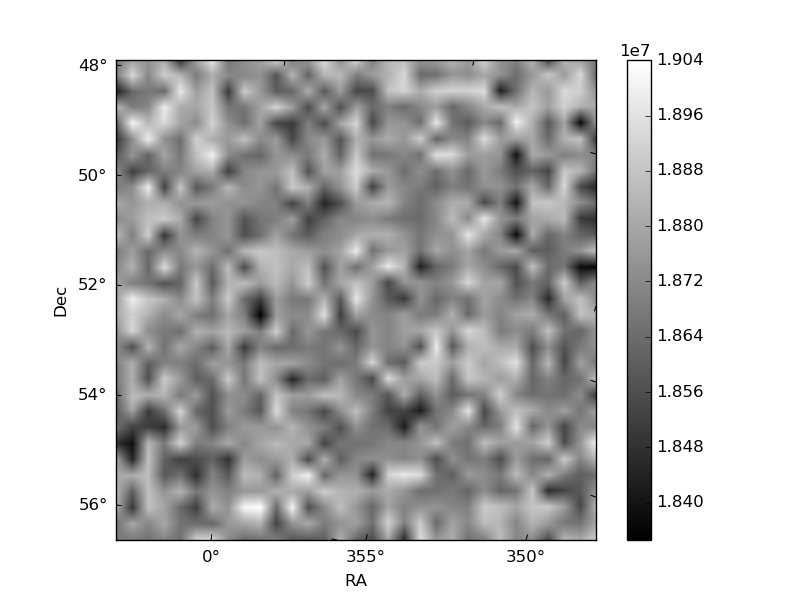
Histogram calculated using DETX and DETY for each event in the final _common_clean file
| Quadrant A | 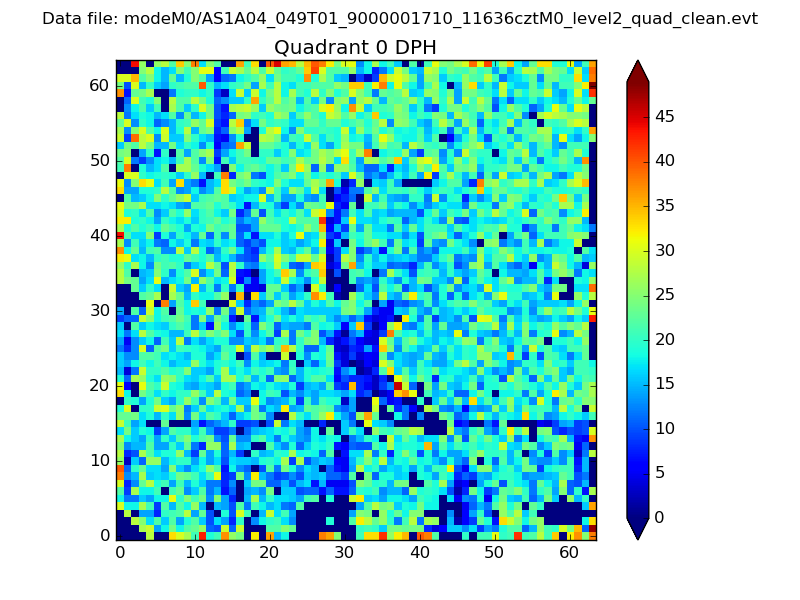 |
 |
Quadrant B |
|---|---|---|---|
| Quadrant D | 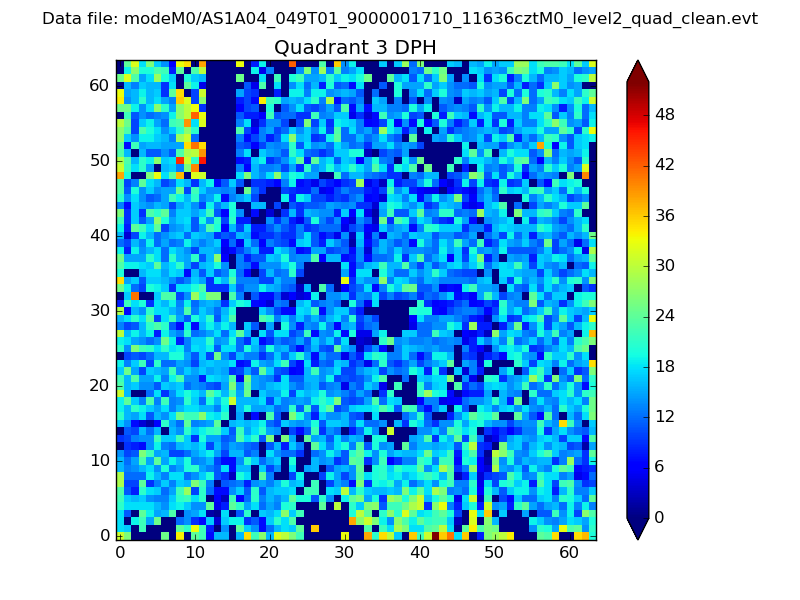 |
 |
Quadrant C |
| Plot type | Count rate plots | Images |
|---|---|---|
| Comparison with Poisson distribution Blue bars denote a histogram of data divided into 1 sec bins. Red curve is a Poisson curve with rate = median count rate of data. |
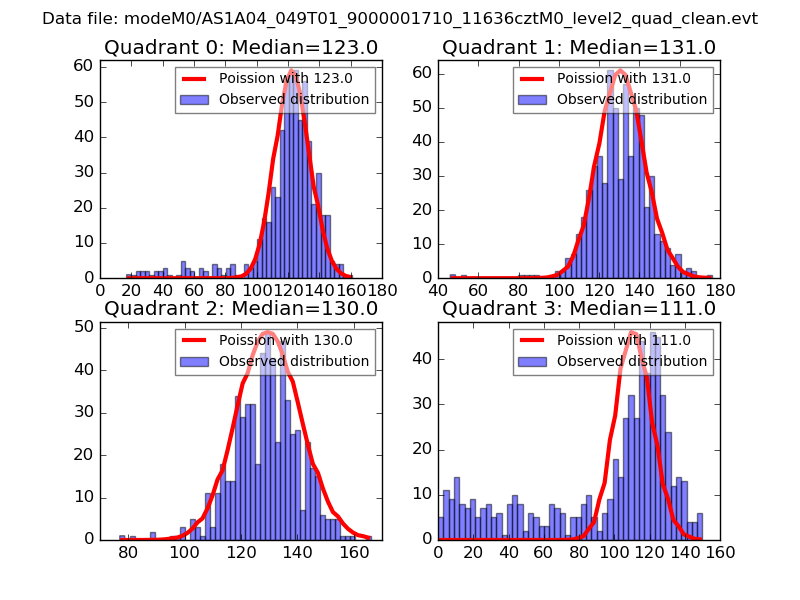 |
 |
| Quadrant-wise count rates Data is divided into 100 sec bins |
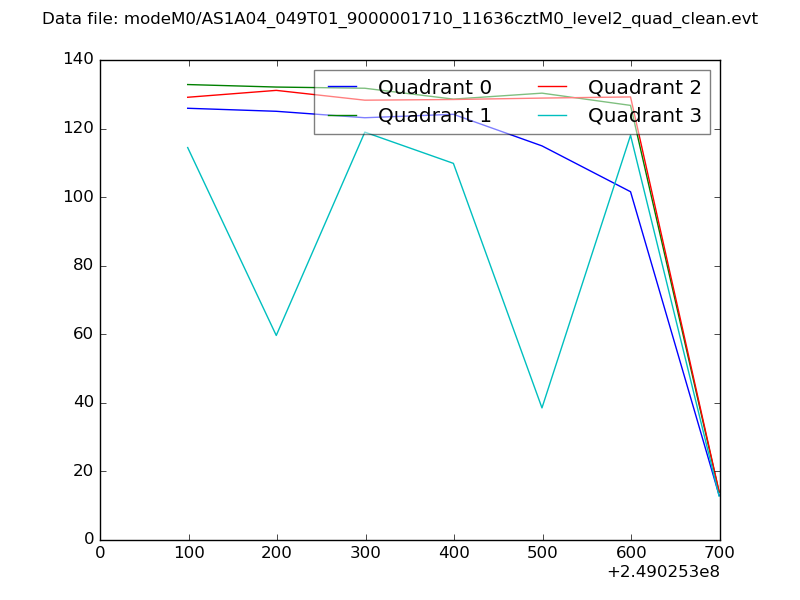 |
|
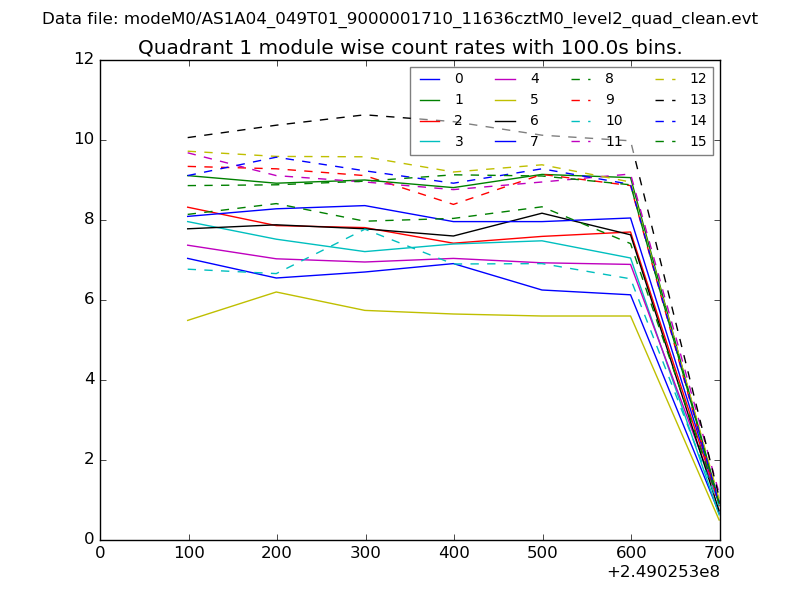
| Module-wise count rates for Quadrant A Data is divided into 100 sec bins |
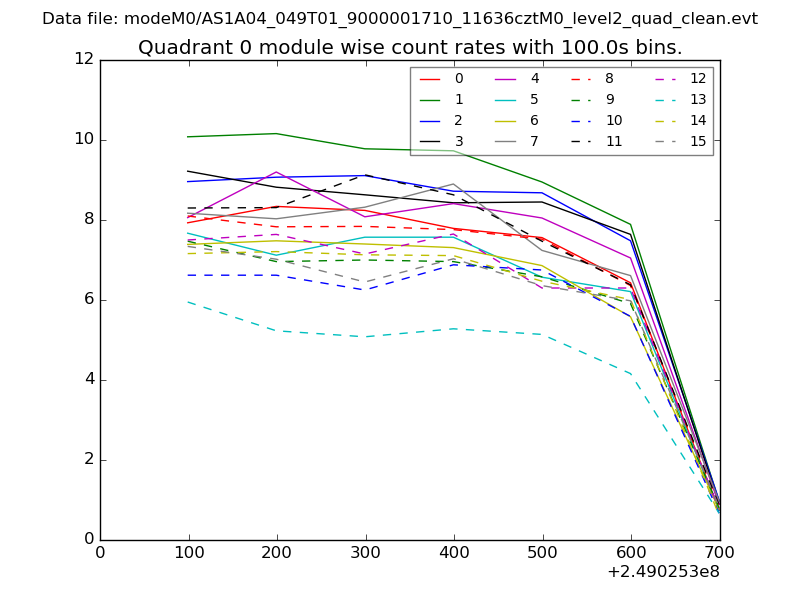 |
 |
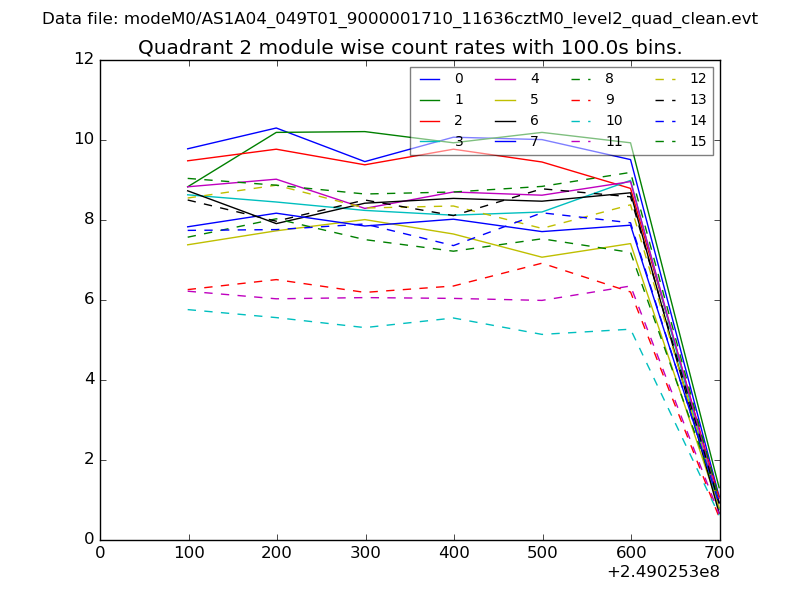
| Module-wise count rates for Quadrant B Data is divided into 100 sec bins |
 |
 |
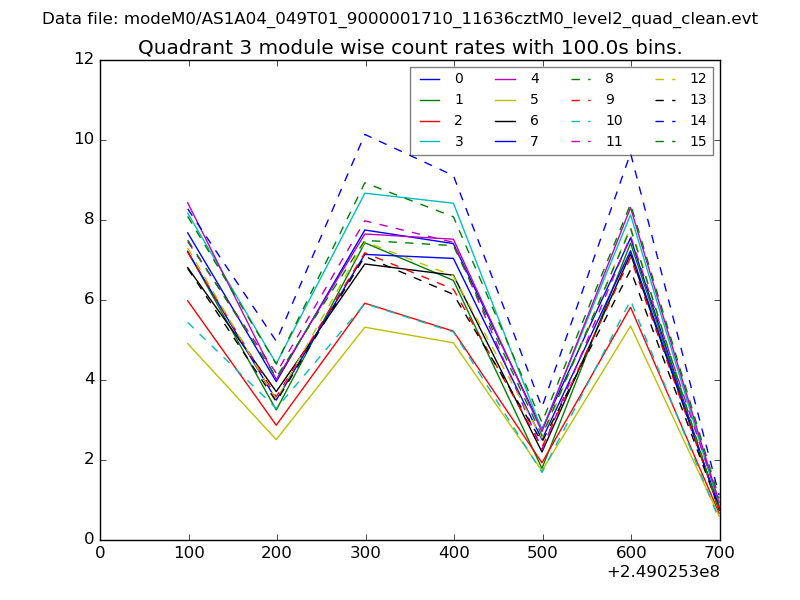
| Module-wise count rates for Quadrant C Data is divided into 100 sec bins |
 |
 |
| Module-wise count rates for Quadrant D Data is divided into 100 sec bins |
 |
 |
| Parameter | Plot |
|---|---|
| CZT HV Monitor | 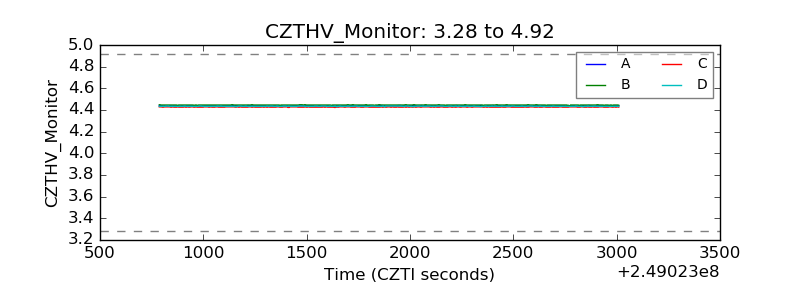 |
| D_VDD | 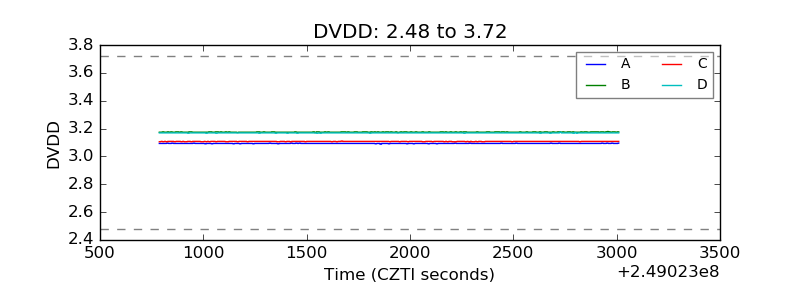 |
| Temperature 1 | 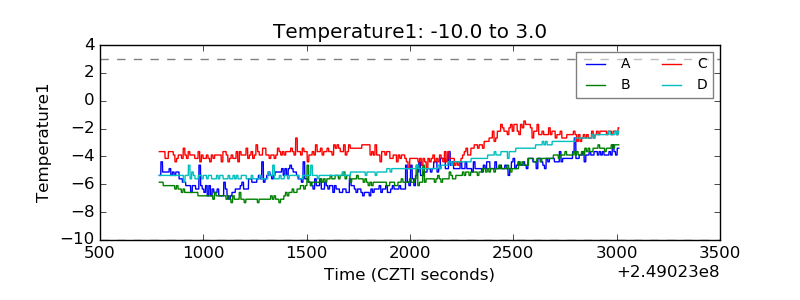 |
| Veto HV Monitor | 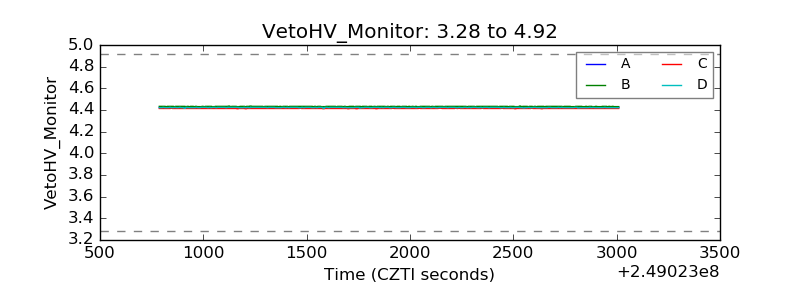 |
| Veto LLD | 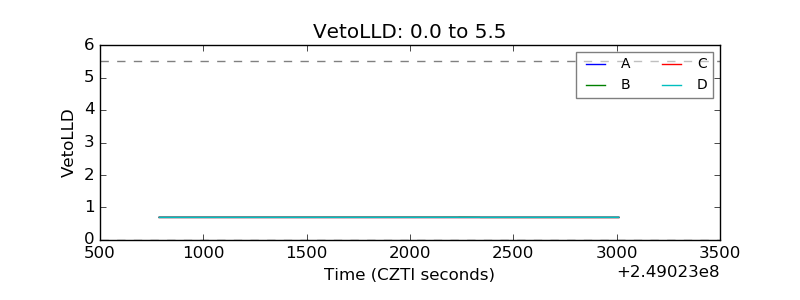 |
| Alpha Counter | 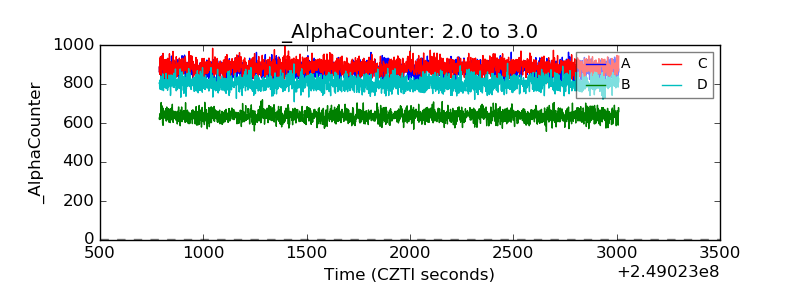 |
| _CPM_Rate | 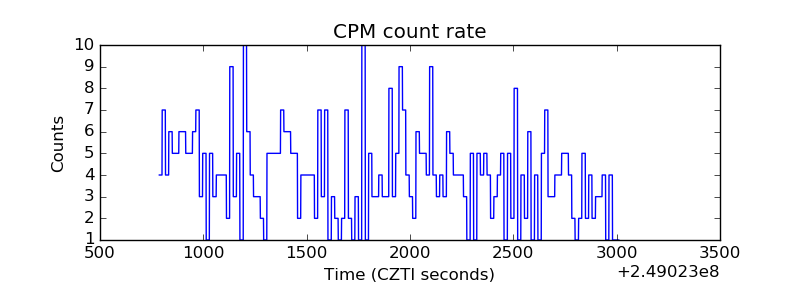 |
| CZT Counter | 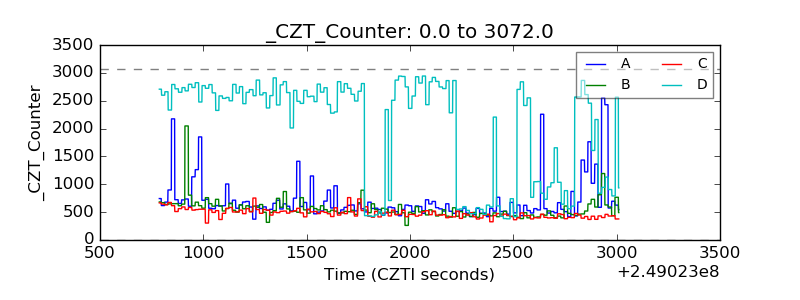 |
| +2.5 Volts monitor |  |
| +5 Volts monitor |  |
| _ROLL_ROT | 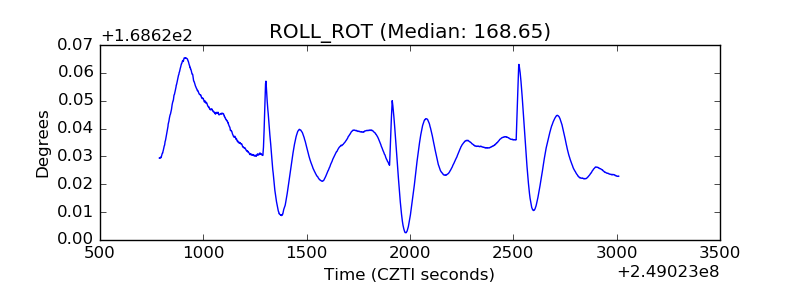 |
| _Roll_DEC | 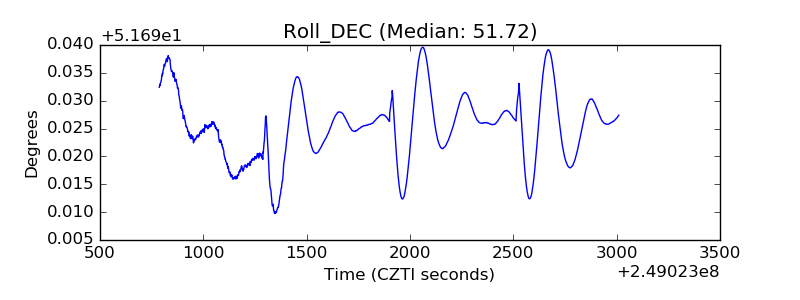 |
| _Roll_RA | 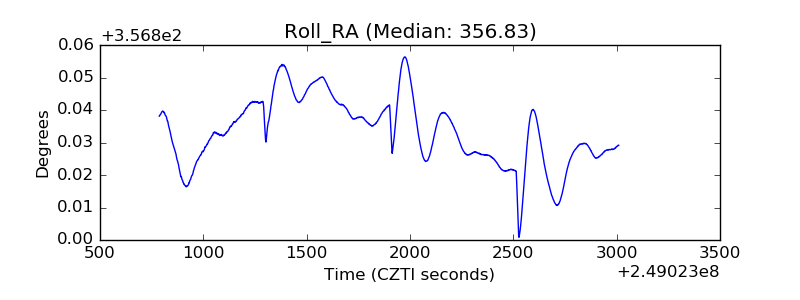 |
| Veto Counter | 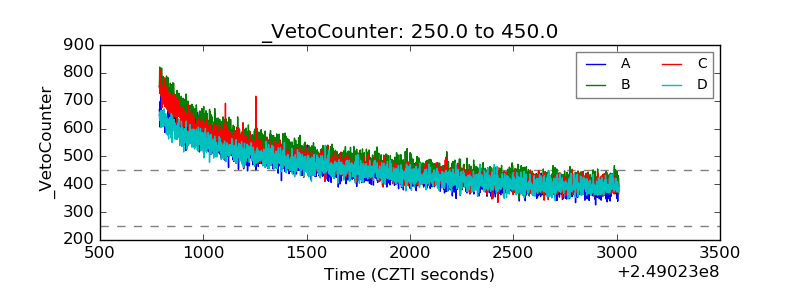 |