| Param | Original file | Final file |
|---|---|---|
| Filename | modeM0/AS1A04_026T01_9000001712cztM0_level2.fits | modeM0/AS1A04_026T01_9000001712cztM0_level2_quad_clean.evt |
| Size (bytes) | 194,109,120 | 166,821,120 |
| Size | 185.1 MB | 159.1 MB |
| Events in quadrant A | 1,147,834 | 936,954 |
| Events in quadrant B | 1,171,452 | 1,041,809 |
| Events in quadrant C | 1,199,488 | 970,251 |
| Events in quadrant D | 956,334 | 701,641 |
| Mode SS | |||
|---|---|---|---|
| Quadrant | BADHDUFLAG | Total packets | Discarded packets |
| A | 0 | 416 | 0 |
| B | 0 | 416 | 0 |
| C | 0 | 416 | 0 |
| D | 0 | 416 | 0 |
| Mode M0 | |||
|---|---|---|---|
| Quadrant | BADHDUFLAG | Total packets | Discarded packets |
| A | 0 | 73919 | 0 |
| B | 0 | 51426 | 0 |
| C | 0 | 41468 | 0 |
| D | 0 | 87012 | 0 |
| Mode M9 | |||
|---|---|---|---|
| Quadrant | BADHDUFLAG | Total packets | Discarded packets |
| A | 0 | 46 | 0 |
| B | 0 | 46 | 0 |
| C | 0 | 46 | 0 |
| D | 0 | 46 | 0 |
| Quadrant | Total seconds | Saturated seconds | Saturation percentage |
|---|---|---|---|
| A | 20328 | 3223 | 15.854978% |
| B | 20328 | 919 | 4.520858% |
| C | 20328 | 196 | 0.964187% |
| D | 20328 | 3791 | 18.649154% |
Noise dominated data is calculated using 1-second bins in cleaned event files. If a bin has >2000 counts, and if more than 50% of those come from <1% of pixels, then it is considered to be noise-dominated and hence unusable.
| Quadrant | # 1 sec bins | Bins with >0 counts | Bins with >2000 counts | High rate bins dominated by noise | Noise dominated (total time) | Noise dominated (detector-on time) | Marked lightcurve |
|---|---|---|---|---|---|---|---|
| A | 25003 | 20304 | 0 | 0 | 0.00% | 0.00% |  |
| B | 25003 | 20327 | 0 | 0 | 0.00% | 0.00% | 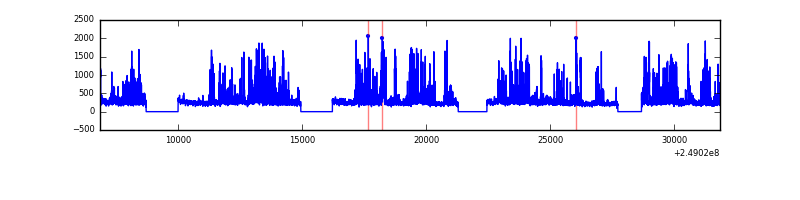 |
| C | 25003 | 20327 | 0 | 0 | 0.00% | 0.00% |  |
| D | 25003 | 20271 | 0 | 0 | 0.00% | 0.00% | 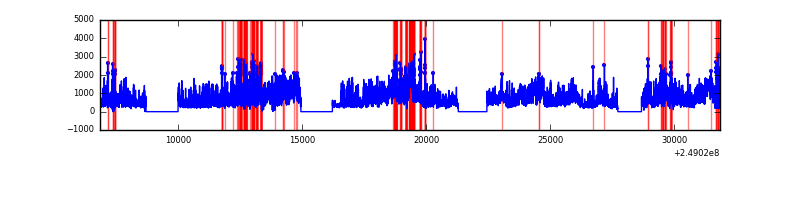 |
Top three noisy pixels from each quadrant. If the there are fewer than three noisy pixels in the level2.evt file, extra rows are filled as -1
| Pixel properties | Quadrant properties | ||||||
|---|---|---|---|---|---|---|---|
| Quadrant | DetID | PixID | Counts | Sigma | Mean | Median | Sigma |
| A | 0 | 29 | 1133 | 11.22 | 299 | 281 | 76.0 |
| A | 7 | 110 | 945 | 8.74 | 299 | 281 | 76.0 |
| A | 0 | 30 | 896 | 8.1 | 299 | 281 | 76.0 |
| B | 2 | 9 | 993 | 11.23 | 309 | 297 | 62.0 |
| B | 2 | 8 | 778 | 7.76 | 309 | 297 | 62.0 |
| B | 5 | 128 | 773 | 7.68 | 309 | 297 | 62.0 |
| C | 7 | 111 | 847 | 6.74 | 317 | 297 | 81.6 |
| C | 3 | 126 | 843 | 6.69 | 317 | 297 | 81.6 |
| C | 2 | 191 | 839 | 6.64 | 317 | 297 | 81.6 |
| D | 6 | 83 | 706 | 6.05 | 273 | 249 | 75.5 |
| D | 3 | 14 | 704 | 6.03 | 273 | 249 | 75.5 |
| D | 4 | 160 | 690 | 5.84 | 273 | 249 | 75.5 |
Histogram calculated using DETX and DETY for each event in the final _common_clean file
| Quadrant A | 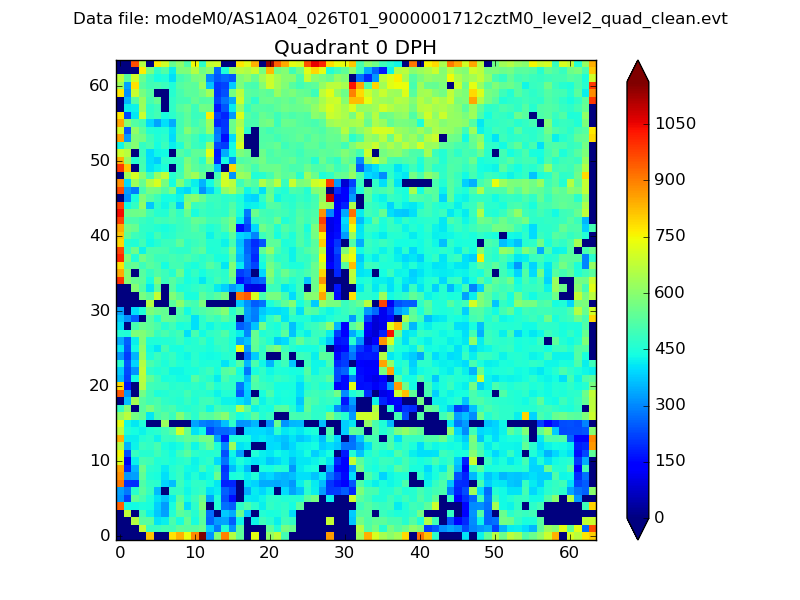 |
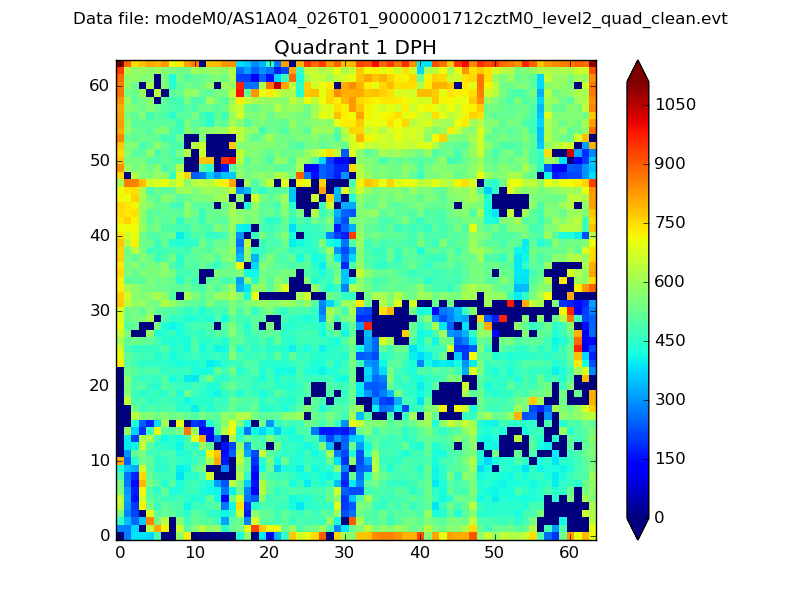 |
Quadrant B |
|---|---|---|---|
| Quadrant D | 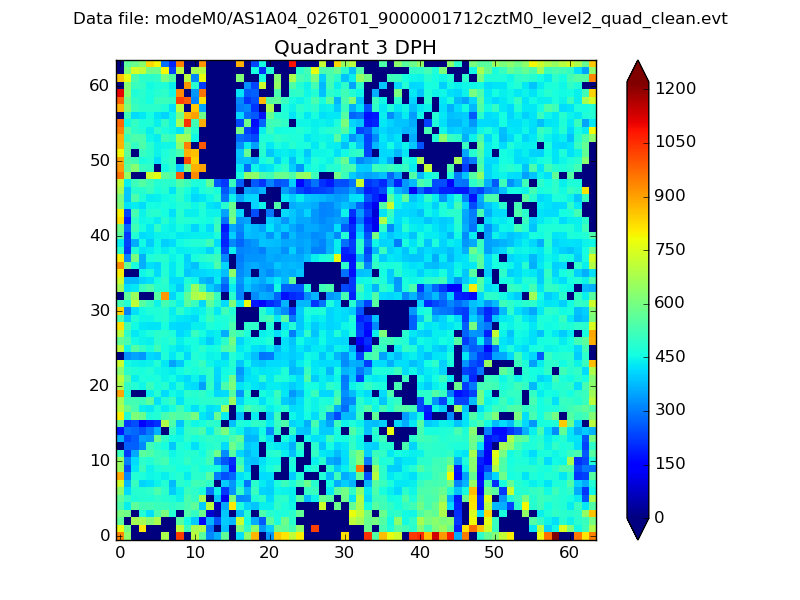 |
 |
Quadrant C |
| Plot type | Count rate plots | Images |
|---|---|---|
| Comparison with Poisson distribution Blue bars denote a histogram of data divided into 1 sec bins. Red curve is a Poisson curve with rate = median count rate of data. |
 |
 |
| Quadrant-wise count rates Data is divided into 100 sec bins |
 |
|
| Module-wise count rates for Quadrant A Data is divided into 100 sec bins |
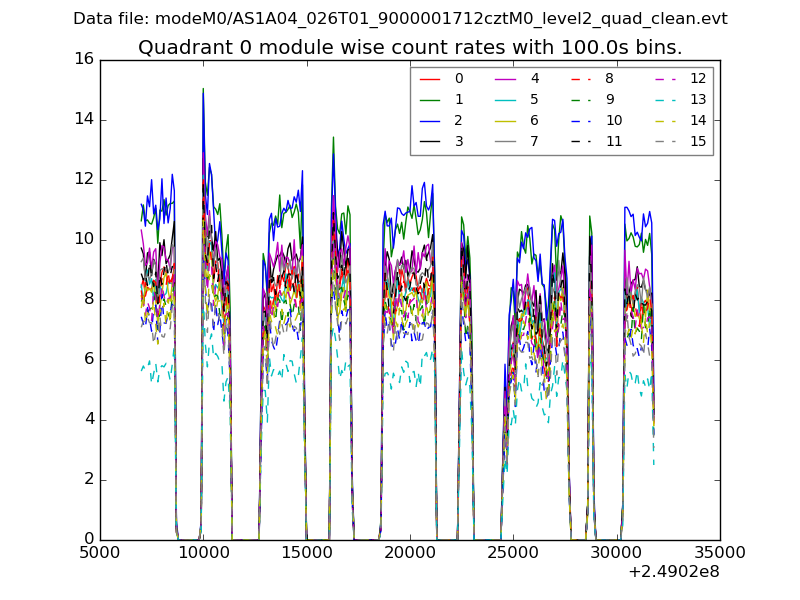 |
 |
| Module-wise count rates for Quadrant B Data is divided into 100 sec bins |
 |
 |
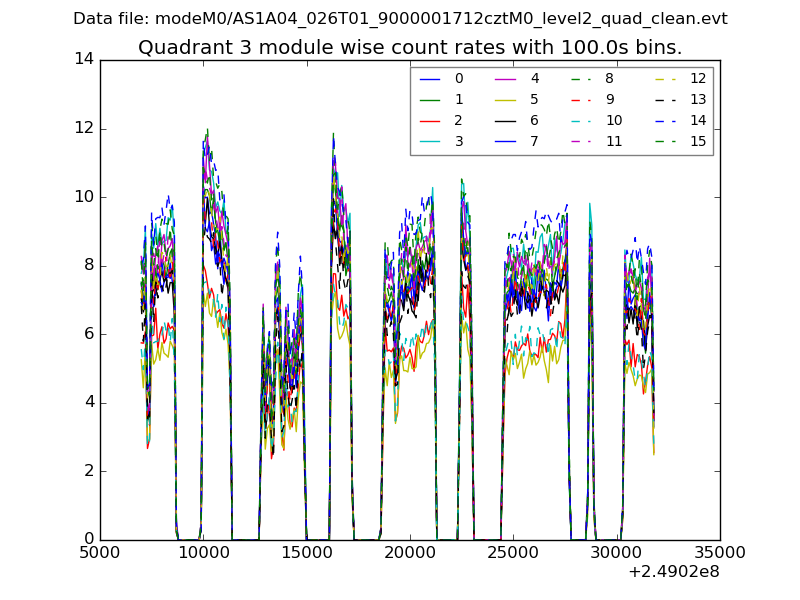
| Module-wise count rates for Quadrant C Data is divided into 100 sec bins |
 |
 |
| Module-wise count rates for Quadrant D Data is divided into 100 sec bins |
 |
 |
| Parameter | Plot |
|---|---|
| CZT HV Monitor |  |
| D_VDD | 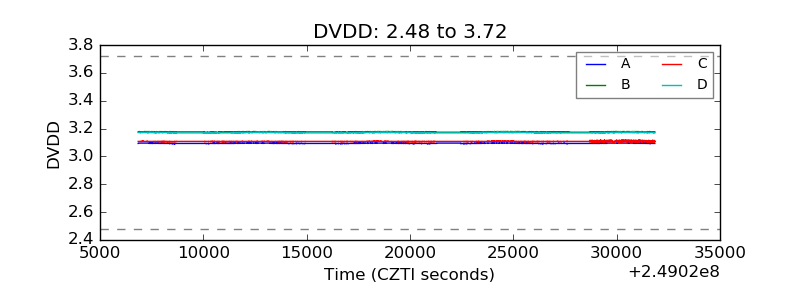 |
| Temperature 1 | 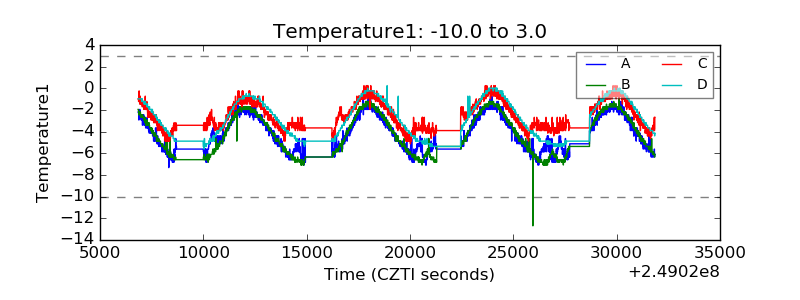 |
| Veto HV Monitor |  |
| Veto LLD |  |
| Alpha Counter |  |
| _CPM_Rate |  |
| CZT Counter |  |
| +2.5 Volts monitor |  |
| +5 Volts monitor |  |
| _ROLL_ROT |  |
| _Roll_DEC |  |
| _Roll_RA |  |
| Veto Counter |  |