| Param | Original file | Final file |
|---|---|---|
| Filename | modeM0/AS1A04_026T01_9000001712_11637cztM0_level2.evt | modeM0/AS1A04_026T01_9000001712_11637cztM0_level2_quad_clean.evt |
| Size (bytes) | 713,810,880 | 91,817,280 |
| Size | 680.7 MB | 87.6 MB |
| Events in quadrant A | 6,109,215 | 596,116 |
| Events in quadrant B | 3,934,107 | 638,983 |
| Events in quadrant C | 2,920,788 | 613,822 |
| Events in quadrant D | 8,231,502 | 494,659 |
| Mode SS | |||
|---|---|---|---|
| Quadrant | BADHDUFLAG | Total packets | Discarded packets |
| A | 0 | 128 | 0 |
| B | 0 | 128 | 0 |
| C | 0 | 128 | 0 |
| D | 0 | 128 | 0 |
| Mode M0 | |||
|---|---|---|---|
| Quadrant | BADHDUFLAG | Total packets | Discarded packets |
| A | 0 | 22539 | 2 |
| B | 0 | 15448 | 1 |
| C | 0 | 12678 | 1 |
| D | 0 | 28705 | 1 |
| Mode M9 | |||
|---|---|---|---|
| Quadrant | BADHDUFLAG | Total packets | Discarded packets |
| A | 0 | 13 | 0 |
| B | 0 | 13 | 0 |
| C | 0 | 13 | 0 |
| D | 0 | 13 | 0 |
| Quadrant | Total seconds | Saturated seconds | Saturation percentage |
|---|---|---|---|
| A | 6243 | 859 | 13.759411% |
| B | 6243 | 173 | 2.771104% |
| C | 6243 | 19 | 0.304341% |
| D | 6243 | 1914 | 30.658337% |
Noise dominated data is calculated using 1-second bins in cleaned event files. If a bin has >2000 counts, and if more than 50% of those come from <1% of pixels, then it is considered to be noise-dominated and hence unusable.
| Quadrant | # 1 sec bins | Bins with >0 counts | Bins with >2000 counts | High rate bins dominated by noise | Noise dominated (total time) | Noise dominated (detector-on time) | Marked lightcurve |
|---|---|---|---|---|---|---|---|
| A | 7519 | 6245 | 474 | 474 | 6.30% | 7.59% | 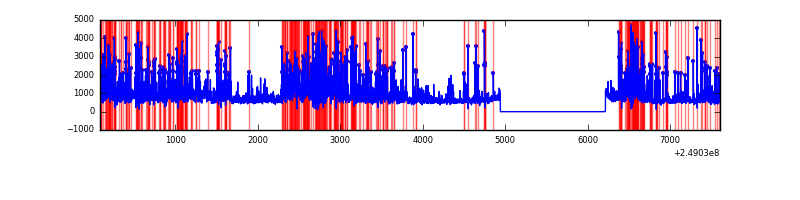 |
| B | 7519 | 6245 | 65 | 65 | 0.86% | 1.04% | 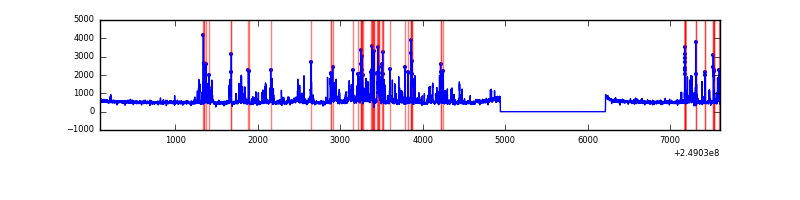 |
| C | 7519 | 6245 | 0 | 0 | 0.00% | 0.00% | 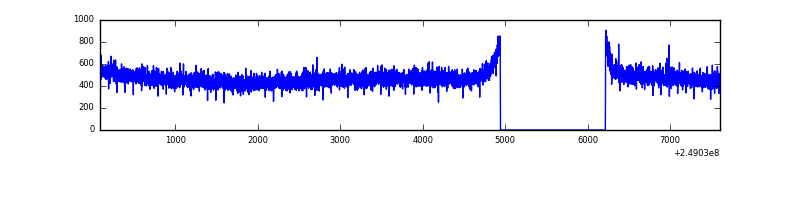 |
| D | 7519 | 6245 | 1461 | 1461 | 19.43% | 23.39% | 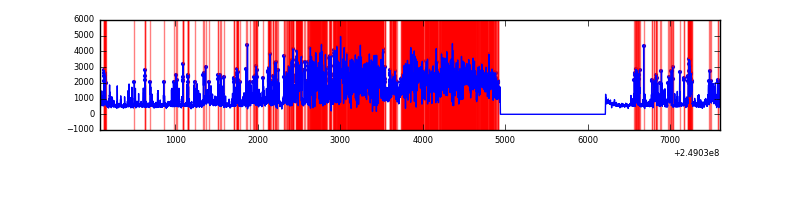 |
Top three noisy pixels from each quadrant. If the there are fewer than three noisy pixels in the level2.evt file, extra rows are filled as -1
| Pixel properties | Quadrant properties | ||||||
|---|---|---|---|---|---|---|---|
| Quadrant | DetID | PixID | Counts | Sigma | Mean | Median | Sigma |
| A | 8 | 5 | 2711904 | 17855.95 | 754 | 741 | 151.8 |
| A | 1 | 162 | 181341 | 1189.45 | 754 | 741 | 151.8 |
| A | 1 | 178 | 101397 | 662.93 | 754 | 741 | 151.8 |
| B | 4 | 239 | 701510 | 4809.4 | 783 | 767 | 145.7 |
| B | 0 | 168 | 71508 | 485.52 | 783 | 767 | 145.7 |
| B | 15 | 204 | 35983 | 241.7 | 783 | 767 | 145.7 |
| C | 13 | 61 | 5599 | 28.41 | 749 | 751 | 170.7 |
| C | 3 | 202 | 1956 | 7.06 | 749 | 751 | 170.7 |
| C | 13 | 250 | 1886 | 6.65 | 749 | 751 | 170.7 |
| D | 13 | 152 | 4516776 | 28476.85 | 662 | 642 | 158.6 |
| D | 10 | 253 | 548259 | 3453.04 | 662 | 642 | 158.6 |
| D | 8 | 195 | 214635 | 1349.35 | 662 | 642 | 158.6 |
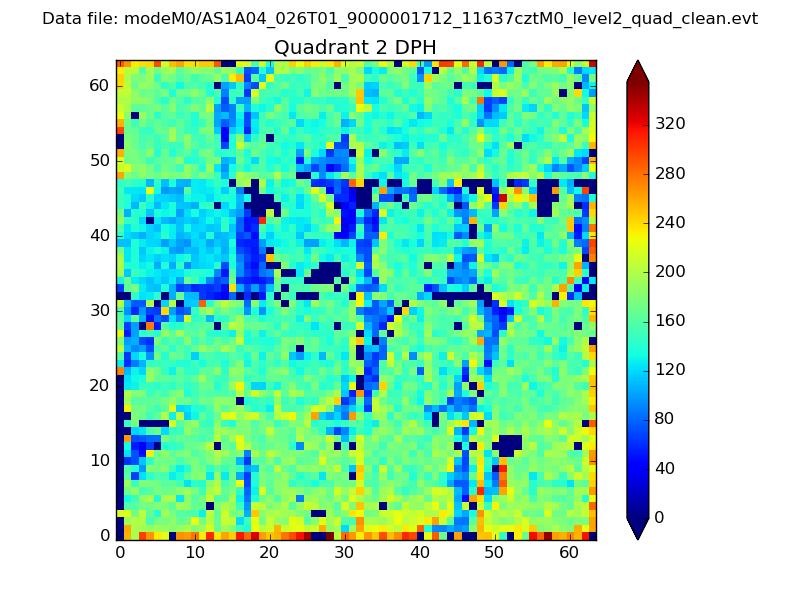
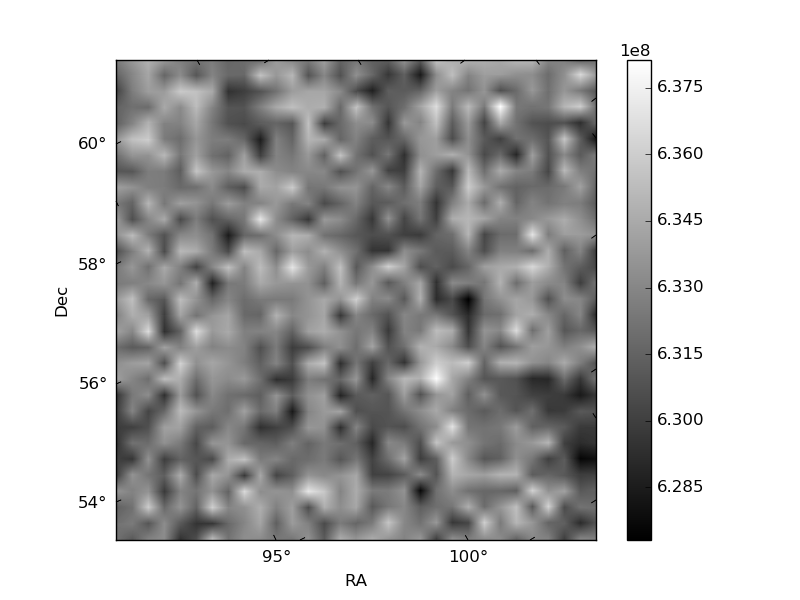
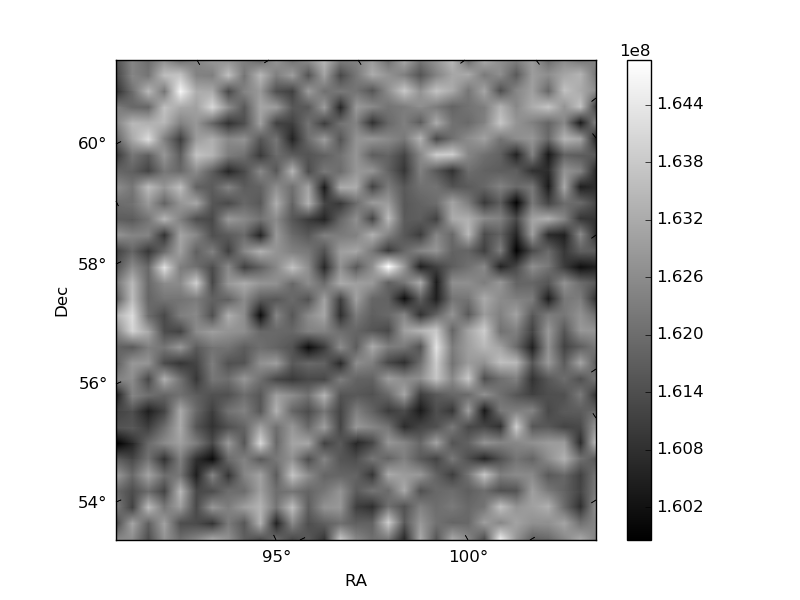
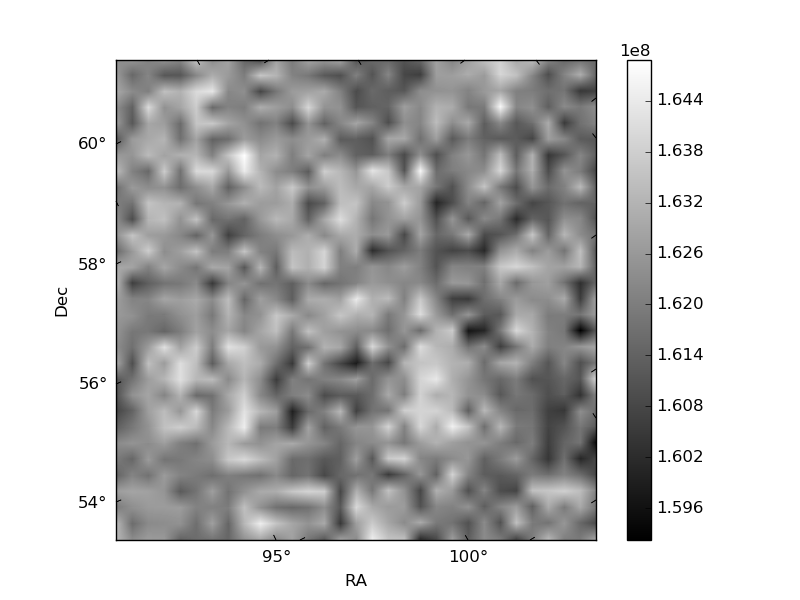
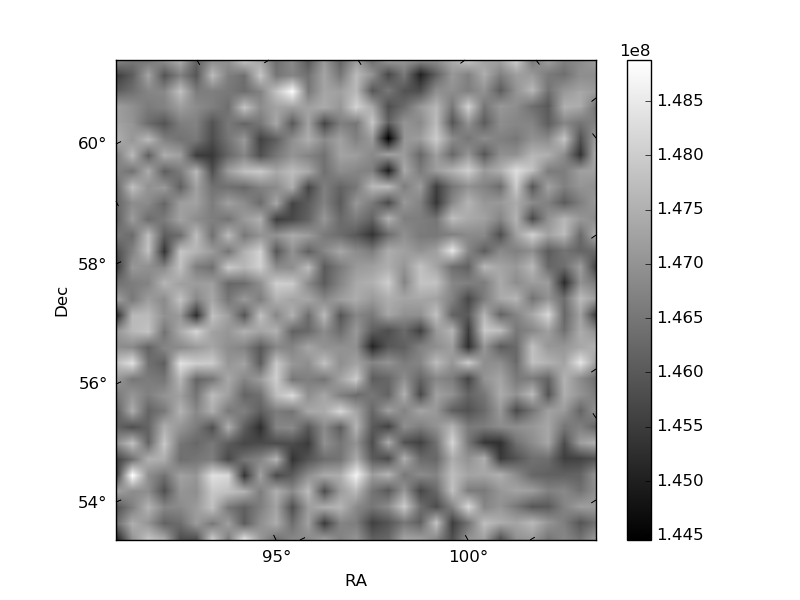
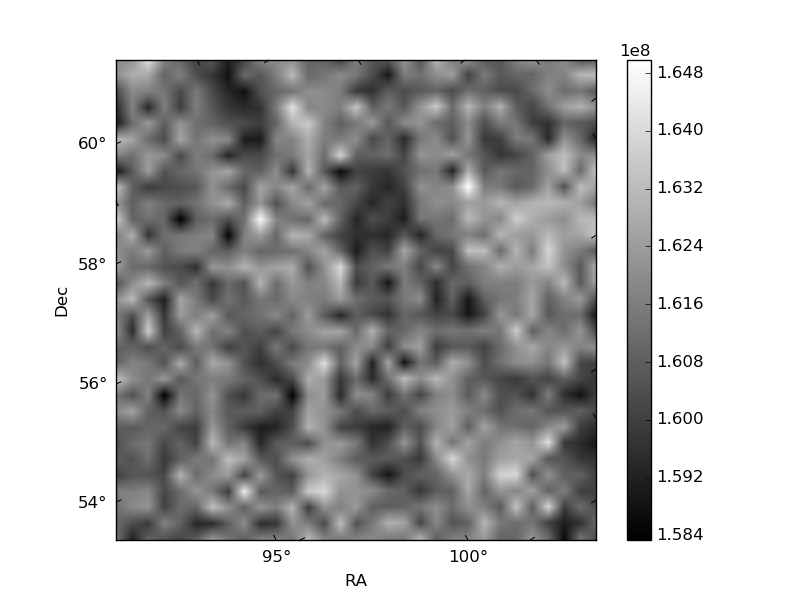
Histogram calculated using DETX and DETY for each event in the final _common_clean file
| Quadrant A | 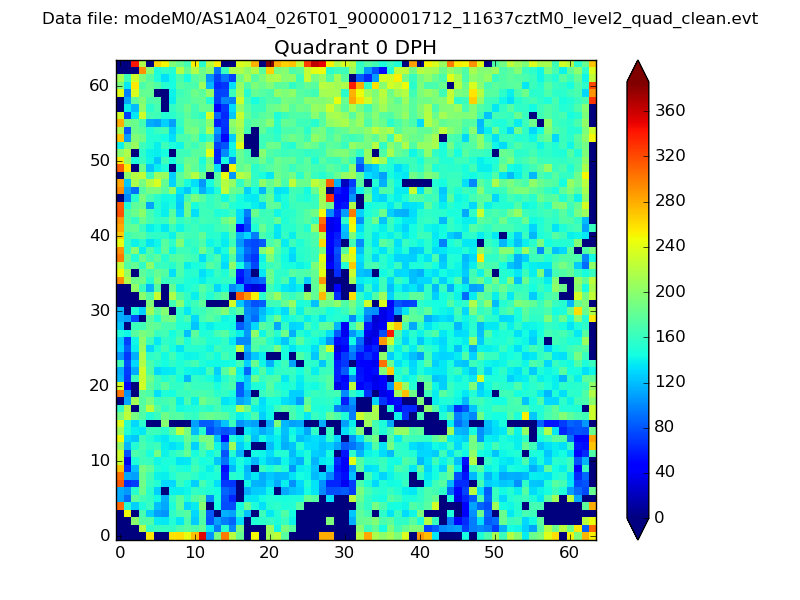 |
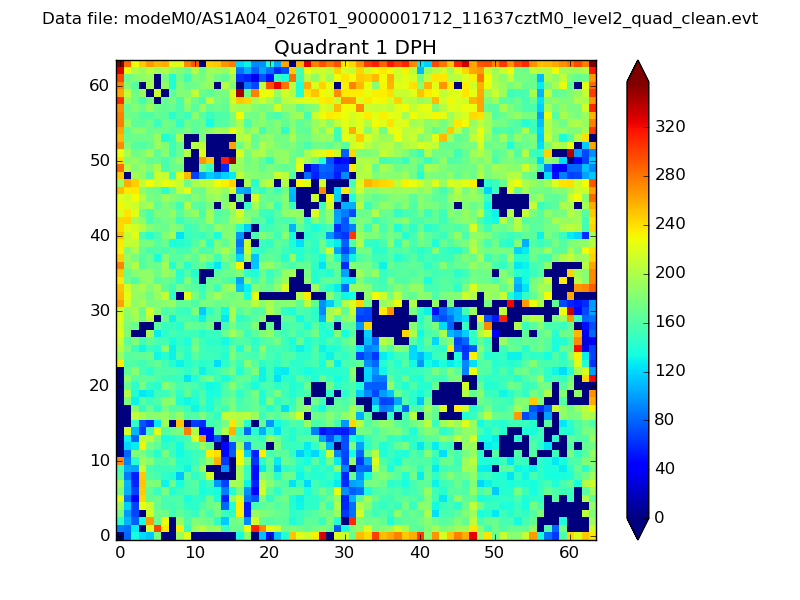 |
Quadrant B |
|---|---|---|---|
| Quadrant D | 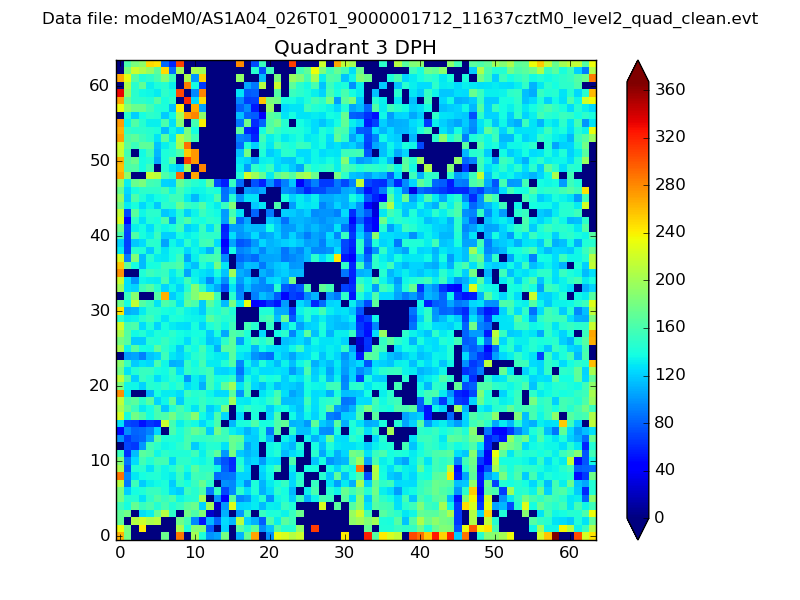 |
 |
Quadrant C |
| Plot type | Count rate plots | Images |
|---|---|---|
| Comparison with Poisson distribution Blue bars denote a histogram of data divided into 1 sec bins. Red curve is a Poisson curve with rate = median count rate of data. |
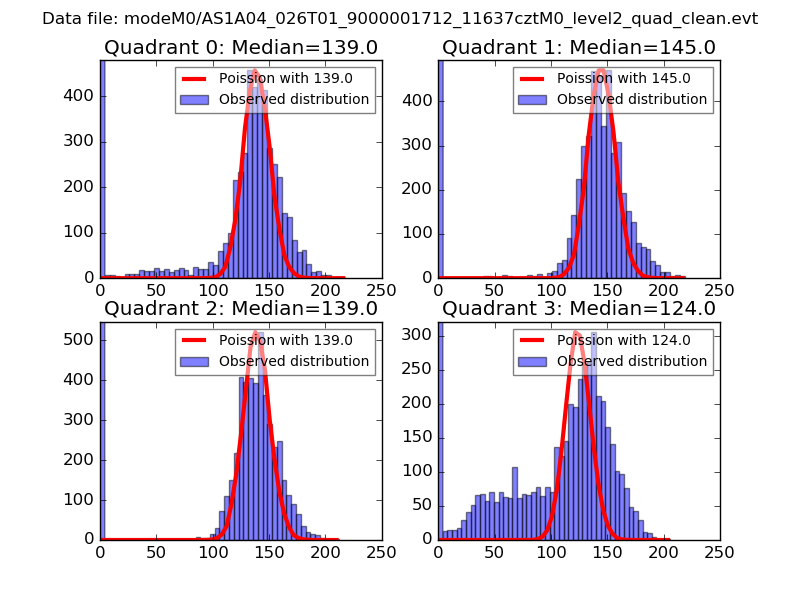 |
 |
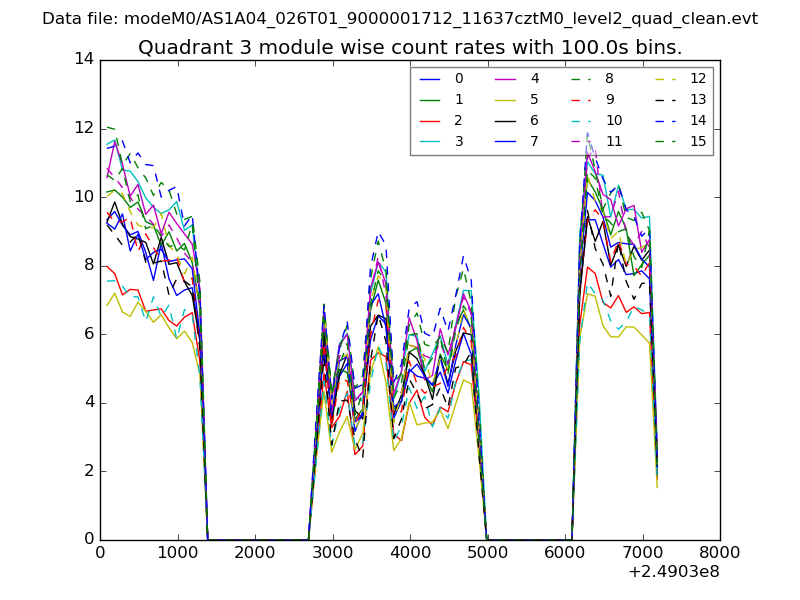
| Quadrant-wise count rates Data is divided into 100 sec bins |
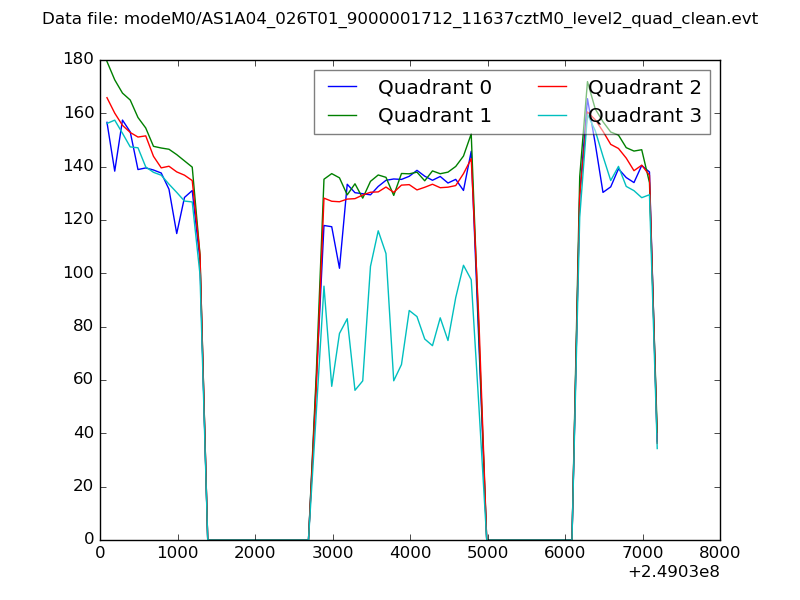 |
|
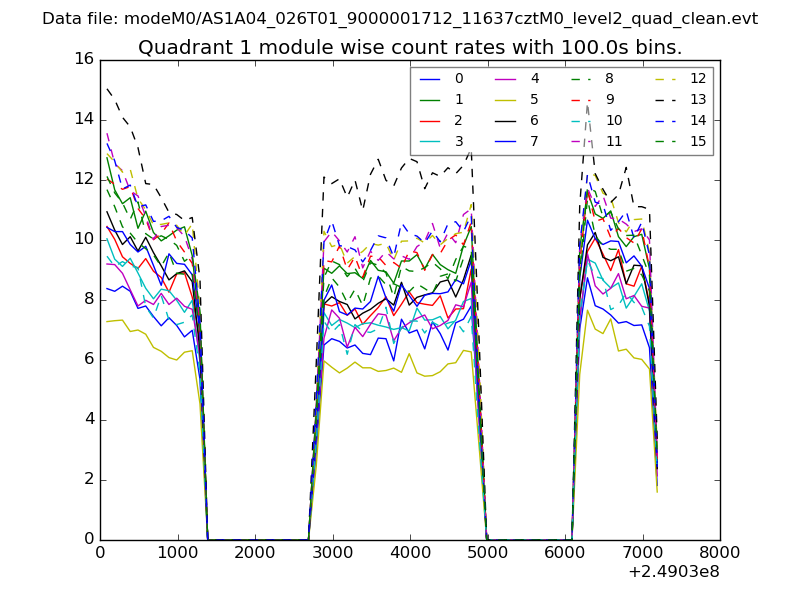
| Module-wise count rates for Quadrant A Data is divided into 100 sec bins |
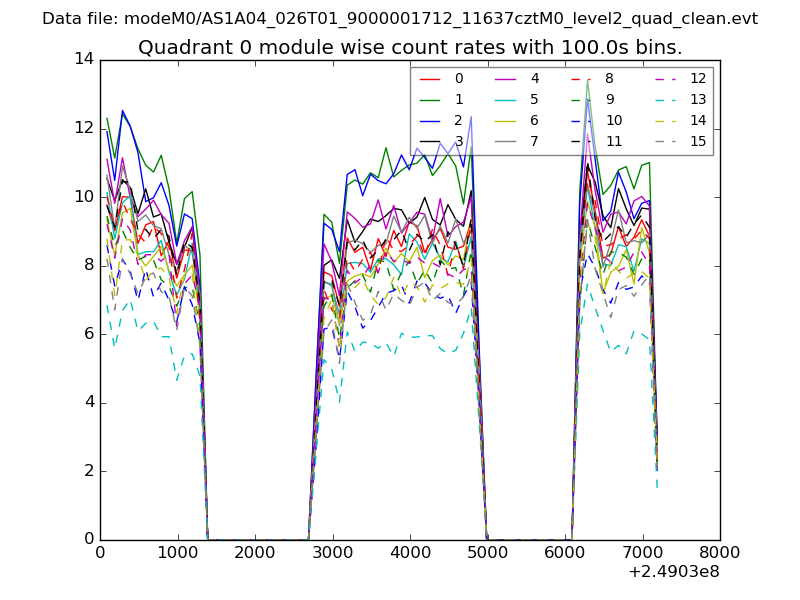 |
 |
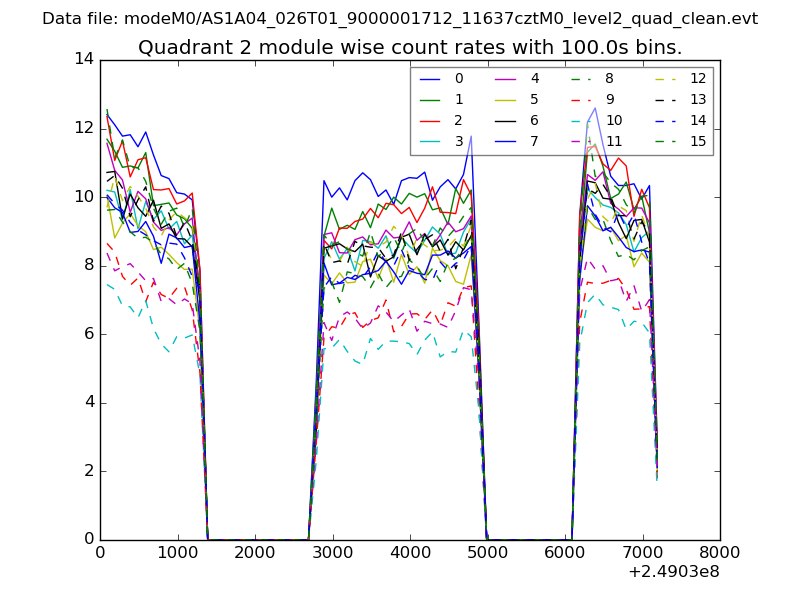
| Module-wise count rates for Quadrant B Data is divided into 100 sec bins |
 |
 |
| Module-wise count rates for Quadrant C Data is divided into 100 sec bins |
 |
 |
| Module-wise count rates for Quadrant D Data is divided into 100 sec bins |
 |
 |
| Parameter | Plot |
|---|---|
| CZT HV Monitor | 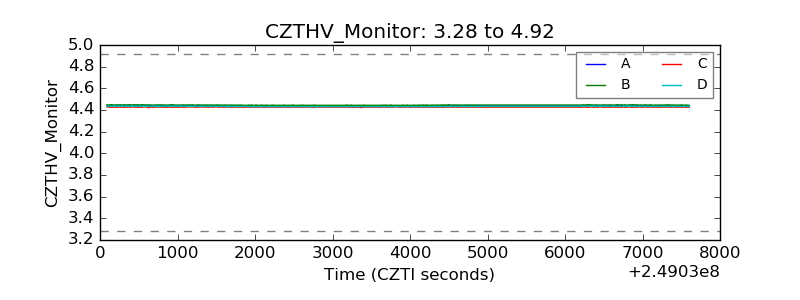 |
| D_VDD | 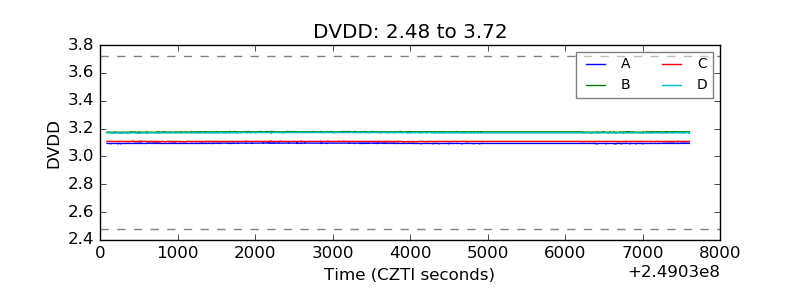 |
| Temperature 1 | 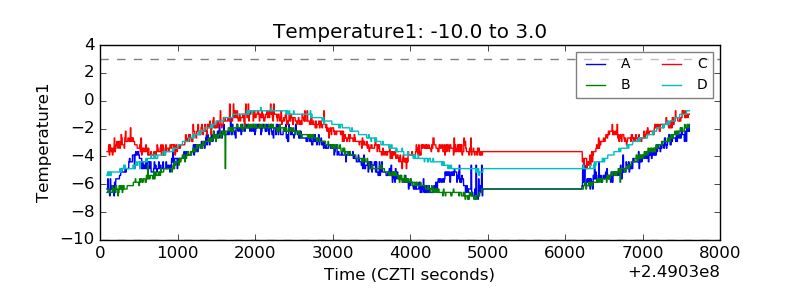 |
| Veto HV Monitor | 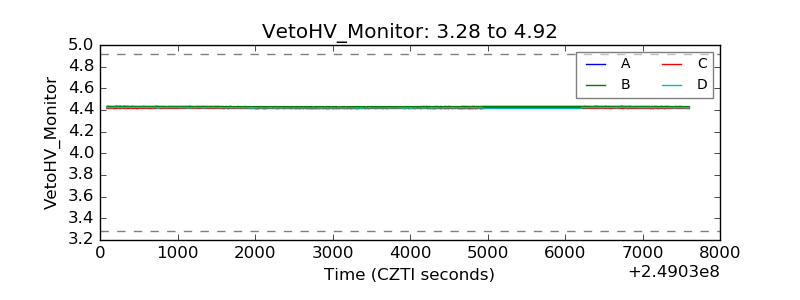 |
| Veto LLD | 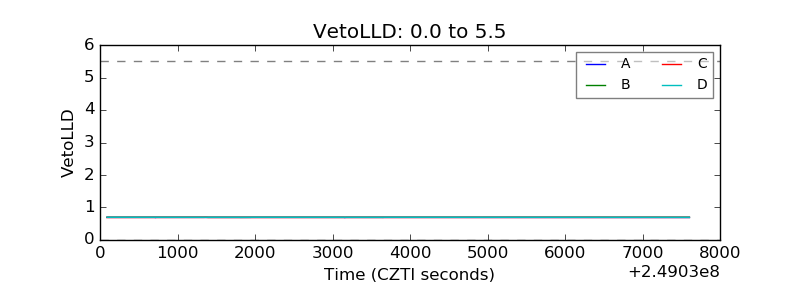 |
| Alpha Counter | 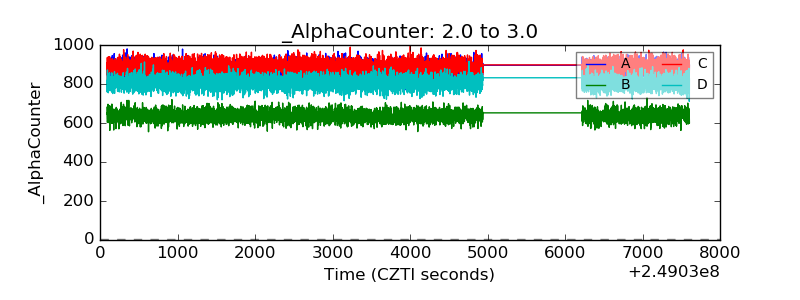 |
| _CPM_Rate | 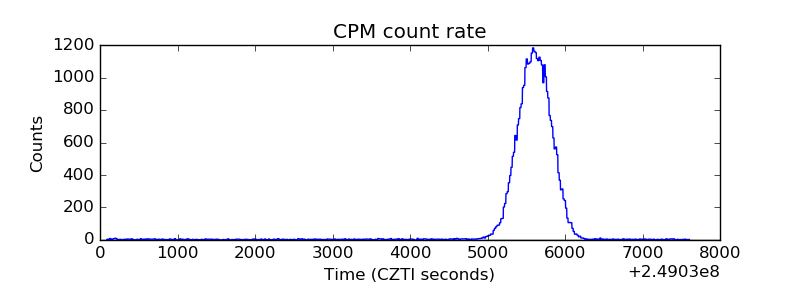 |
| CZT Counter | 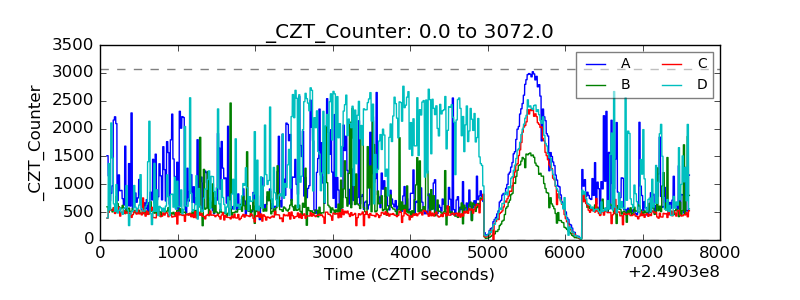 |
| +2.5 Volts monitor |  |
| +5 Volts monitor |  |
| _ROLL_ROT | 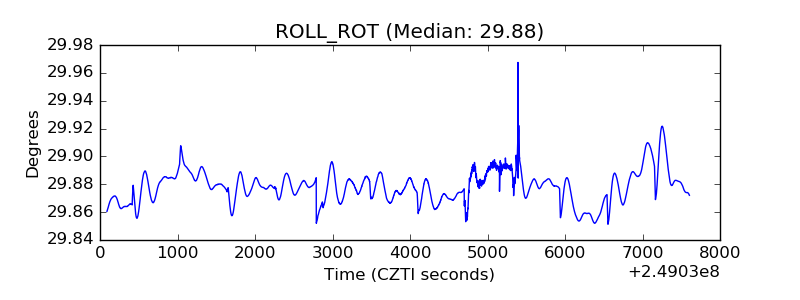 |
| _Roll_DEC | 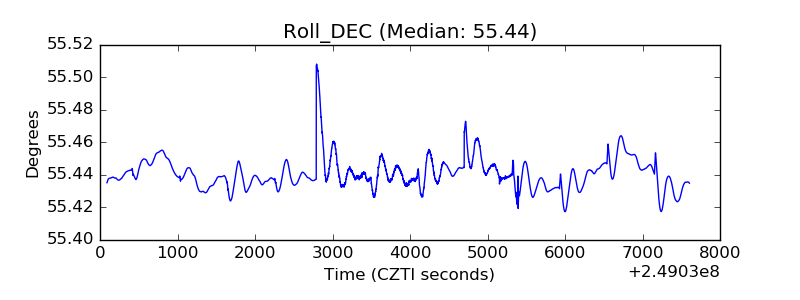 |
| _Roll_RA | 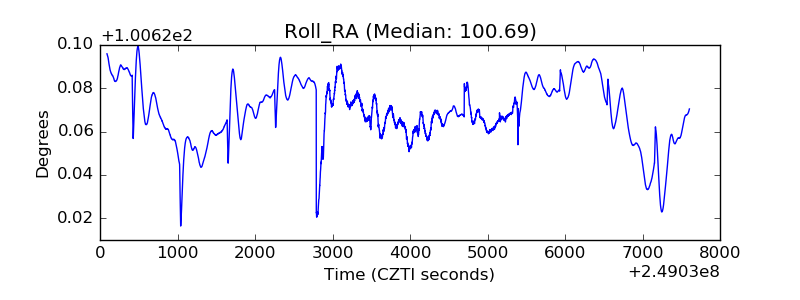 |
| Veto Counter | 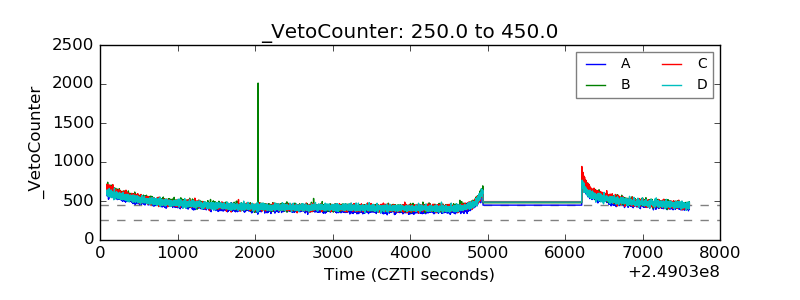 |