| Param | Original file | Final file |
|---|---|---|
| Filename | modeM0/AS1A04_026T01_9000001712_11638cztM0_level2.evt | modeM0/AS1A04_026T01_9000001712_11638cztM0_level2_quad_clean.evt |
| Size (bytes) | 726,442,560 | 86,074,560 |
| Size | 692.8 MB | 82.1 MB |
| Events in quadrant A | 6,320,548 | 538,750 |
| Events in quadrant B | 4,483,447 | 564,951 |
| Events in quadrant C | 3,077,817 | 549,805 |
| Events in quadrant D | 7,673,225 | 492,244 |
| Mode SS | |||
|---|---|---|---|
| Quadrant | BADHDUFLAG | Total packets | Discarded packets |
| A | 0 | 134 | 0 |
| B | 0 | 134 | 0 |
| C | 0 | 134 | 0 |
| D | 0 | 134 | 0 |
| Mode M0 | |||
|---|---|---|---|
| Quadrant | BADHDUFLAG | Total packets | Discarded packets |
| A | 0 | 23378 | 2 |
| B | 0 | 17393 | 1 |
| C | 0 | 13460 | 1 |
| D | 0 | 27396 | 1 |
| Mode M9 | |||
|---|---|---|---|
| Quadrant | BADHDUFLAG | Total packets | Discarded packets |
| A | 0 | 12 | 0 |
| B | 0 | 12 | 0 |
| C | 0 | 12 | 0 |
| D | 0 | 12 | 0 |
| Quadrant | Total seconds | Saturated seconds | Saturation percentage |
|---|---|---|---|
| A | 6599 | 1012 | 15.335657% |
| B | 6599 | 414 | 6.273678% |
| C | 6599 | 94 | 1.424458% |
| D | 6599 | 870 | 13.183816% |
Noise dominated data is calculated using 1-second bins in cleaned event files. If a bin has >2000 counts, and if more than 50% of those come from <1% of pixels, then it is considered to be noise-dominated and hence unusable.
| Quadrant | # 1 sec bins | Bins with >0 counts | Bins with >2000 counts | High rate bins dominated by noise | Noise dominated (total time) | Noise dominated (detector-on time) | Marked lightcurve |
|---|---|---|---|---|---|---|---|
| A | 7755 | 6601 | 511 | 511 | 6.59% | 7.74% | 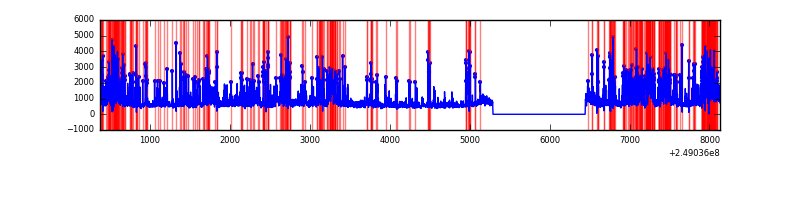 |
| B | 7755 | 6601 | 189 | 189 | 2.44% | 2.86% | 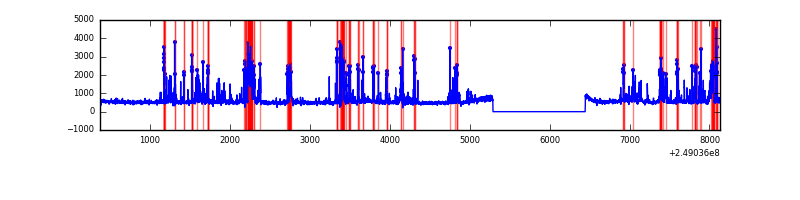 |
| C | 7755 | 6601 | 0 | 0 | 0.00% | 0.00% | 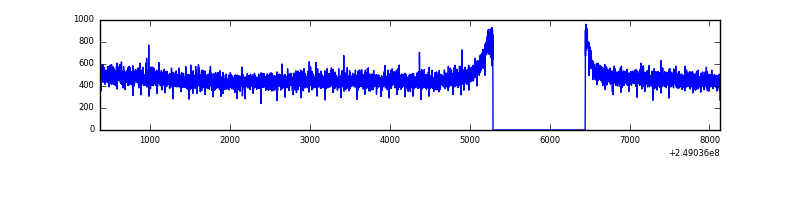 |
| D | 7755 | 6601 | 636 | 636 | 8.20% | 9.63% | 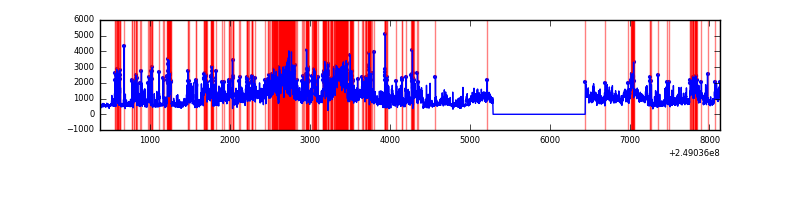 |
Top three noisy pixels from each quadrant. If the there are fewer than three noisy pixels in the level2.evt file, extra rows are filled as -1
| Pixel properties | Quadrant properties | ||||||
|---|---|---|---|---|---|---|---|
| Quadrant | DetID | PixID | Counts | Sigma | Mean | Median | Sigma |
| A | 8 | 5 | 2646634 | 16556.78 | 790 | 776 | 159.8 |
| A | 1 | 162 | 239609 | 1494.53 | 790 | 776 | 159.8 |
| A | 1 | 178 | 138438 | 861.44 | 790 | 776 | 159.8 |
| B | 4 | 239 | 1137933 | 7388.39 | 814 | 795 | 153.9 |
| B | 0 | 219 | 74886 | 481.4 | 814 | 795 | 153.9 |
| B | 15 | 204 | 54946 | 351.84 | 814 | 795 | 153.9 |
| C | 13 | 61 | 5959 | 28.91 | 788 | 791 | 178.8 |
| C | 3 | 202 | 2051 | 7.05 | 788 | 791 | 178.8 |
| C | 12 | 4 | 2022 | 6.89 | 788 | 791 | 178.8 |
| D | 13 | 152 | 3424222 | 18709.41 | 761 | 736 | 183.0 |
| D | 10 | 253 | 655604 | 3578.86 | 761 | 736 | 183.0 |
| D | 13 | 104 | 192220 | 1046.46 | 761 | 736 | 183.0 |
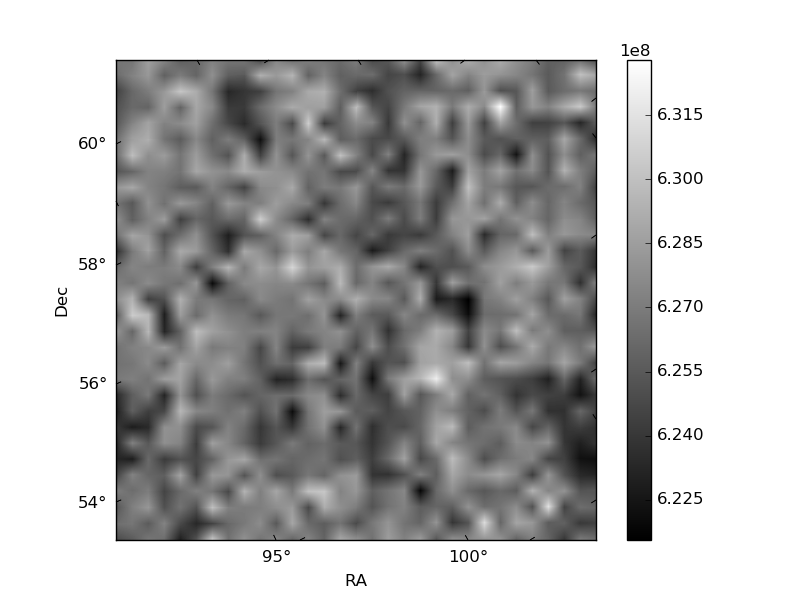
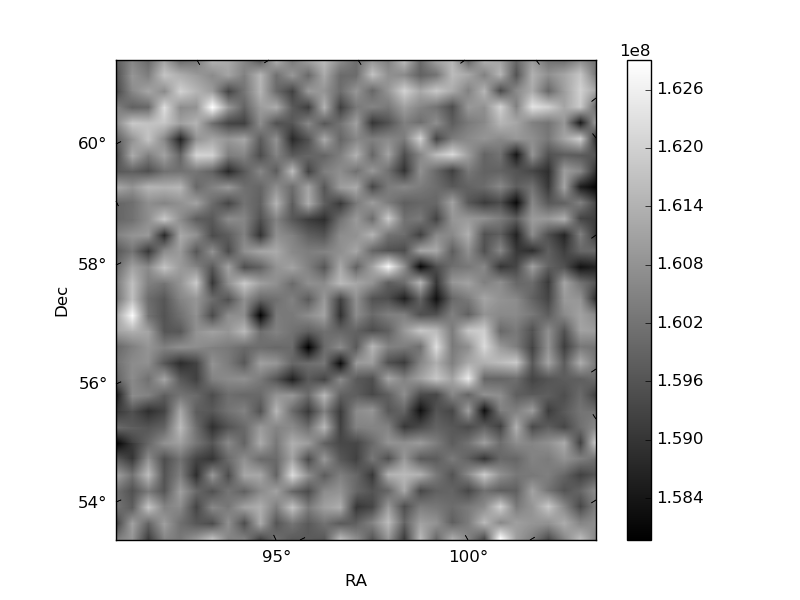
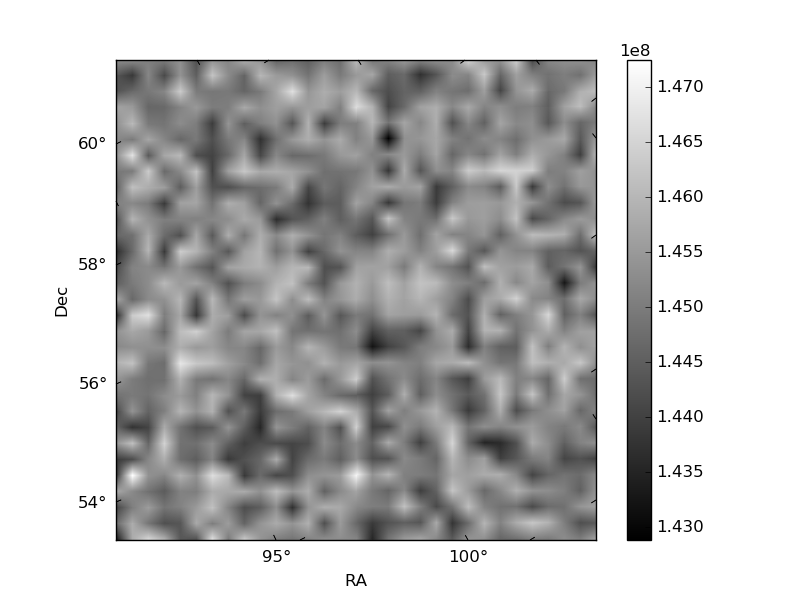
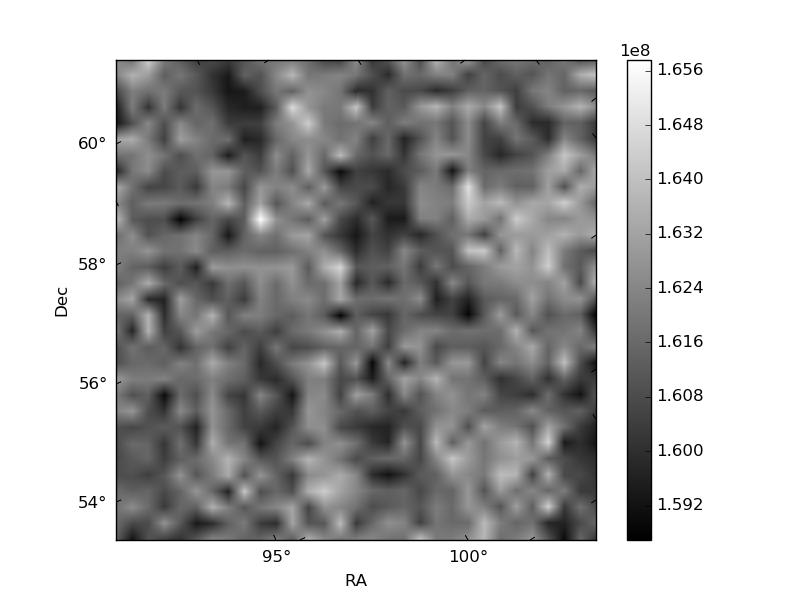
Histogram calculated using DETX and DETY for each event in the final _common_clean file
| Quadrant A | 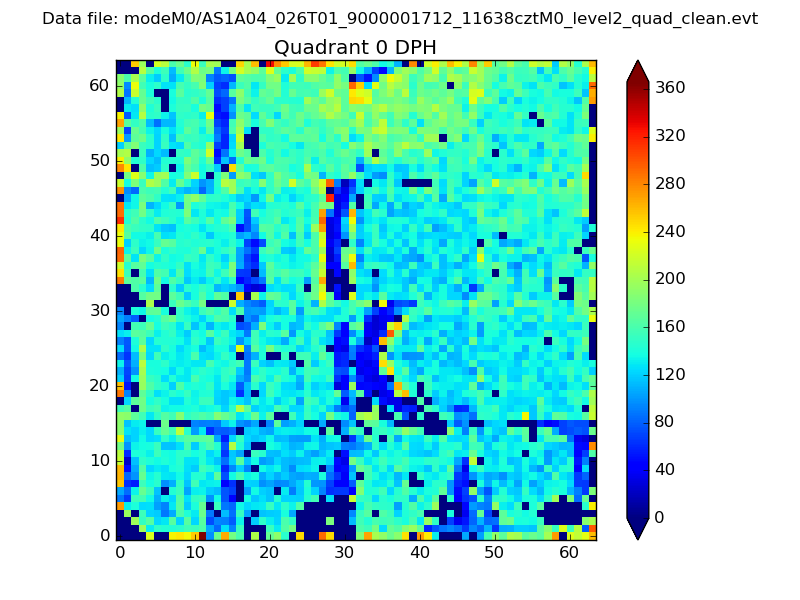 |
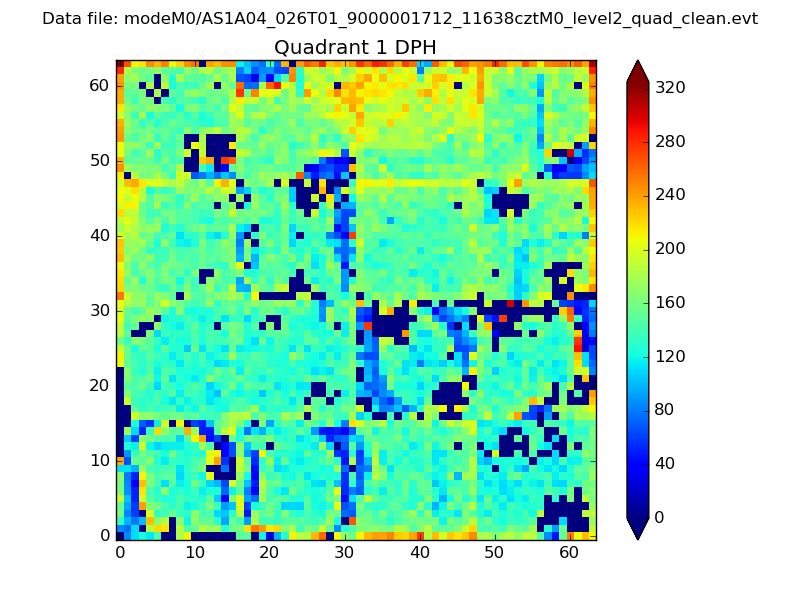 |
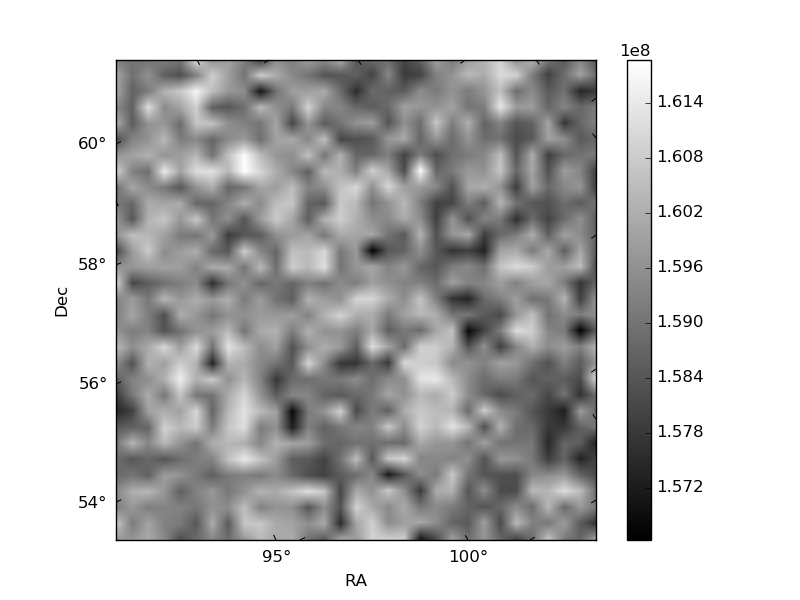
Quadrant B |
|---|---|---|---|
| Quadrant D | 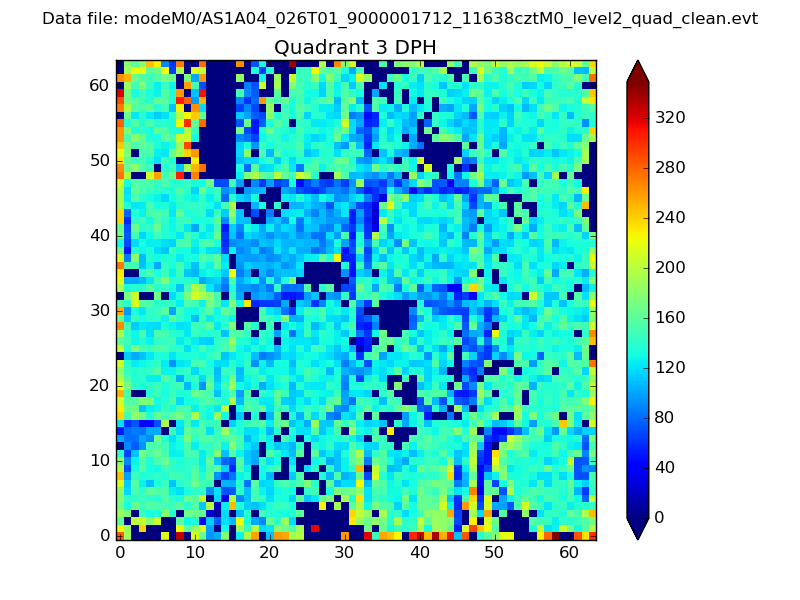 |
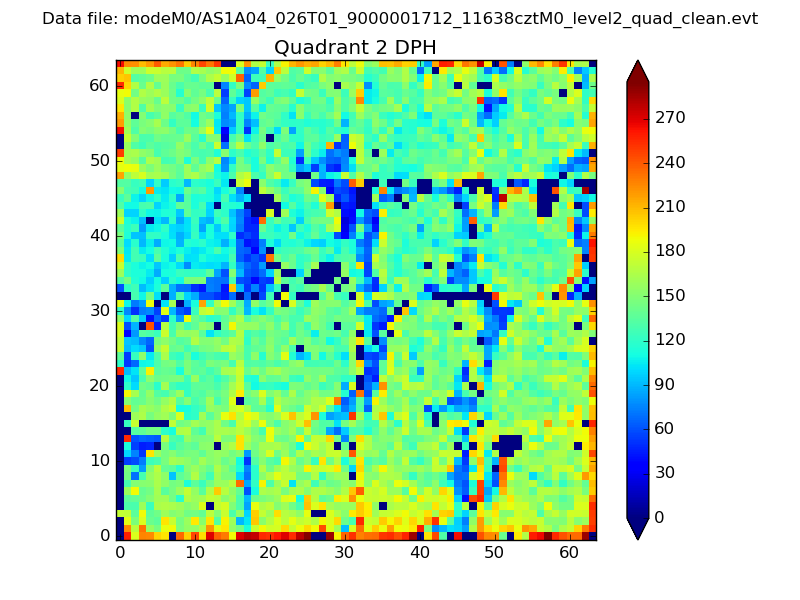 |
Quadrant C |
| Plot type | Count rate plots | Images |
|---|---|---|
| Comparison with Poisson distribution Blue bars denote a histogram of data divided into 1 sec bins. Red curve is a Poisson curve with rate = median count rate of data. |
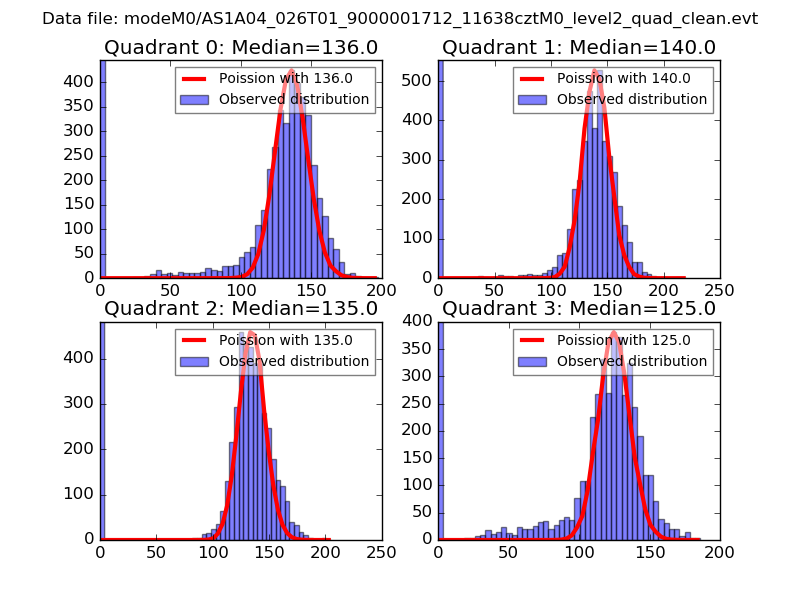 |
 |
| Quadrant-wise count rates Data is divided into 100 sec bins |
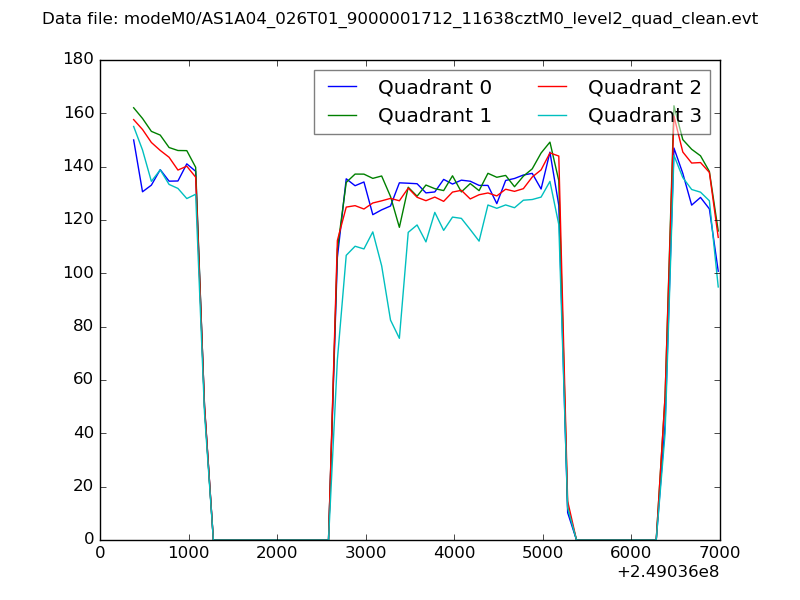 |
|
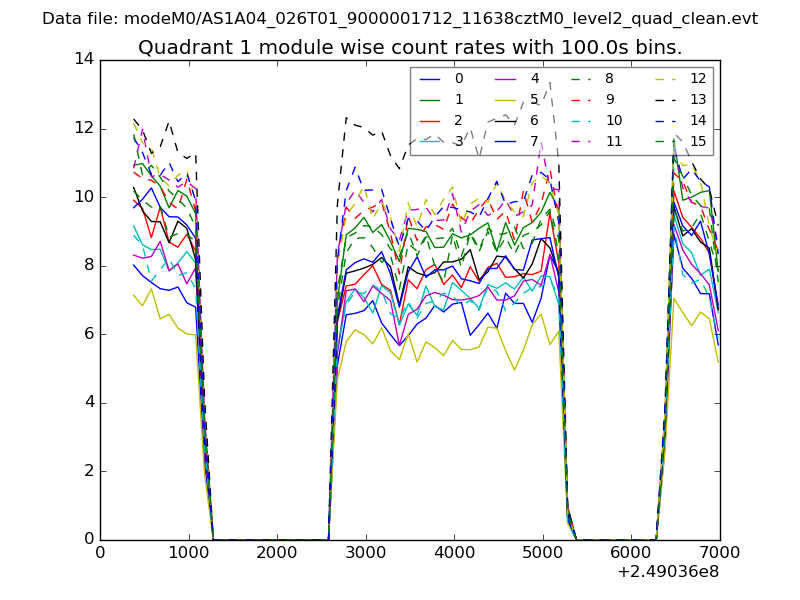
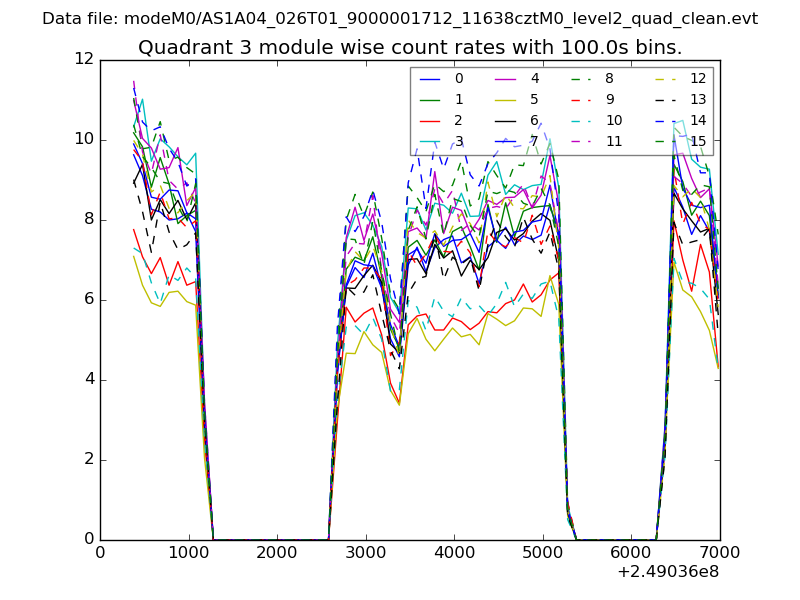
| Module-wise count rates for Quadrant A Data is divided into 100 sec bins |
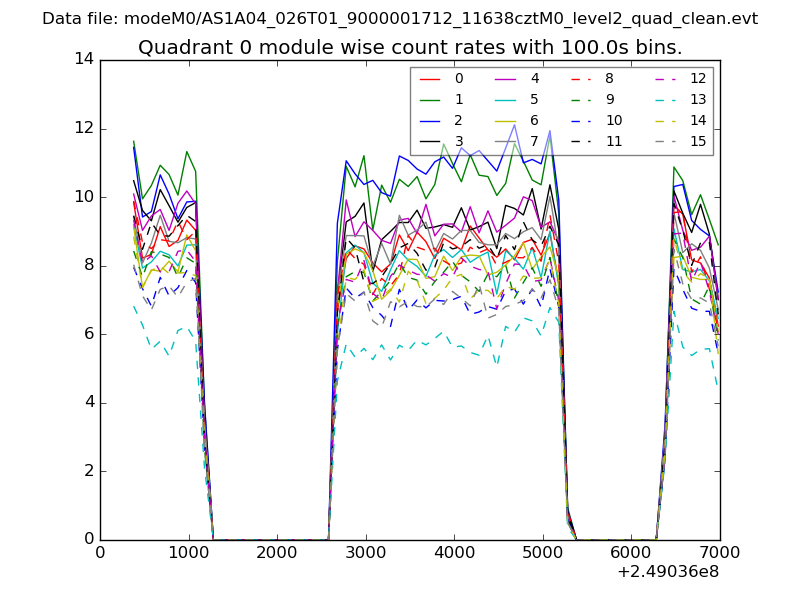 |
 |
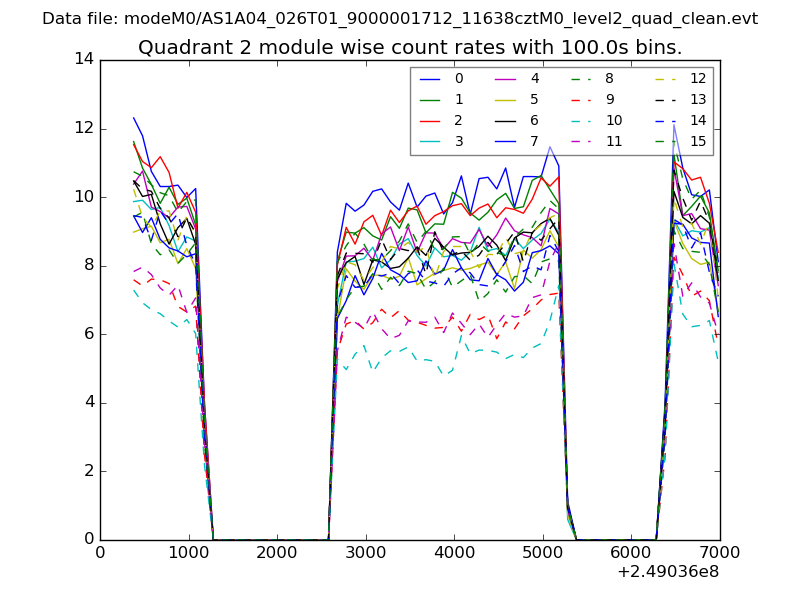
| Module-wise count rates for Quadrant B Data is divided into 100 sec bins |
 |
 |
| Module-wise count rates for Quadrant C Data is divided into 100 sec bins |
 |
 |
| Module-wise count rates for Quadrant D Data is divided into 100 sec bins |
 |
 |
| Parameter | Plot |
|---|---|
| CZT HV Monitor | 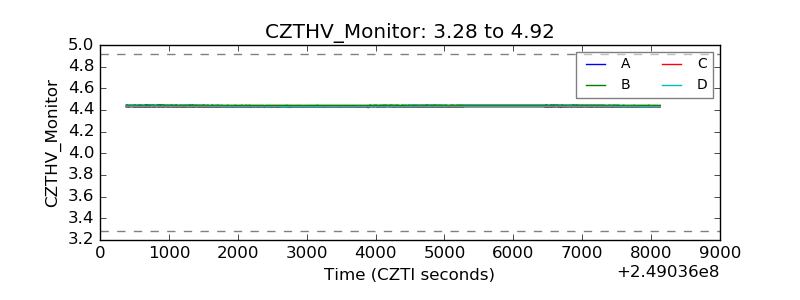 |
| D_VDD | 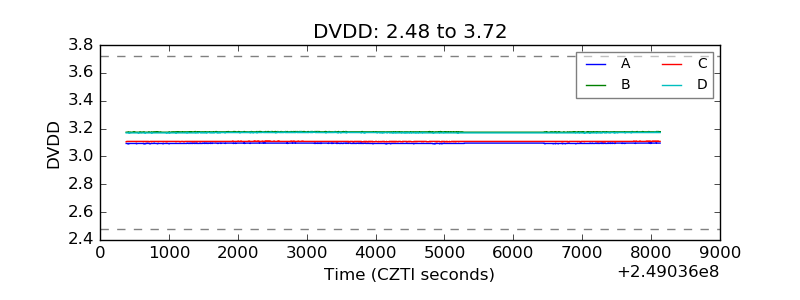 |
| Temperature 1 | 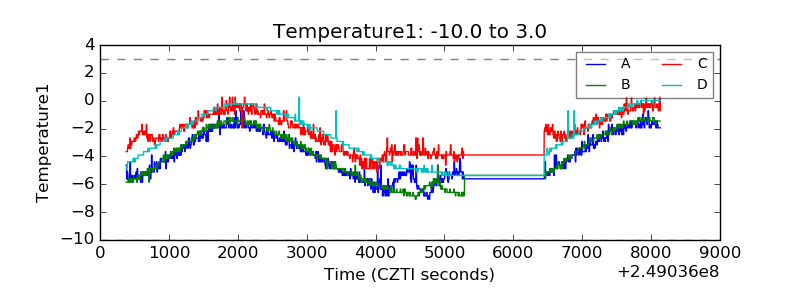 |
| Veto HV Monitor | 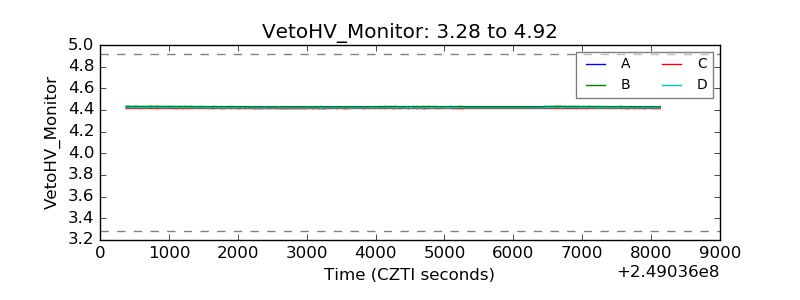 |
| Veto LLD | 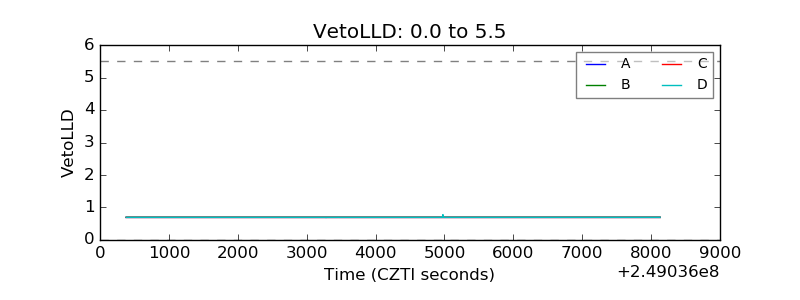 |
| Alpha Counter | 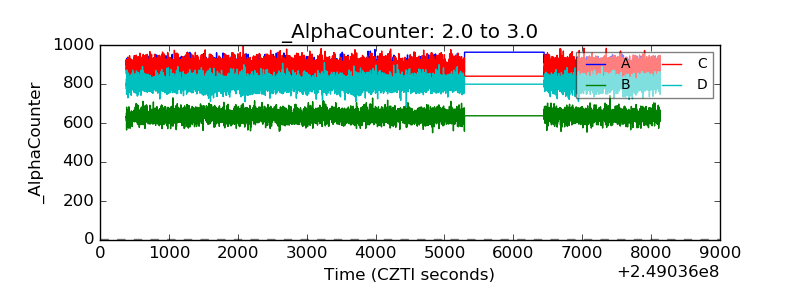 |
| _CPM_Rate | 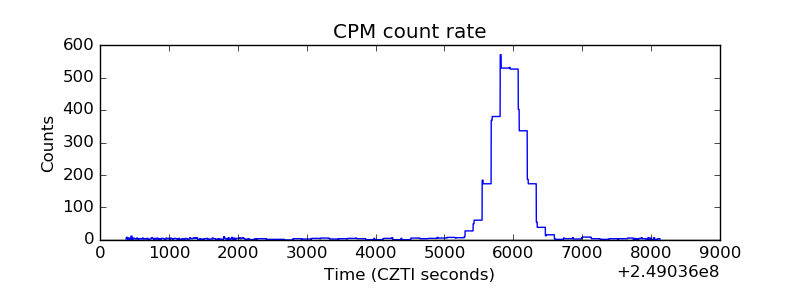 |
| CZT Counter | 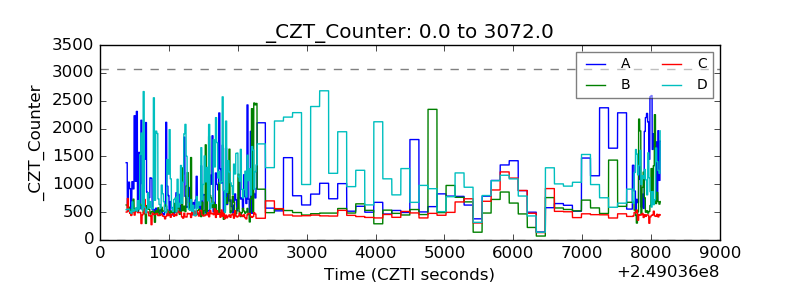 |
| +2.5 Volts monitor |  |
| +5 Volts monitor |  |
| _ROLL_ROT | 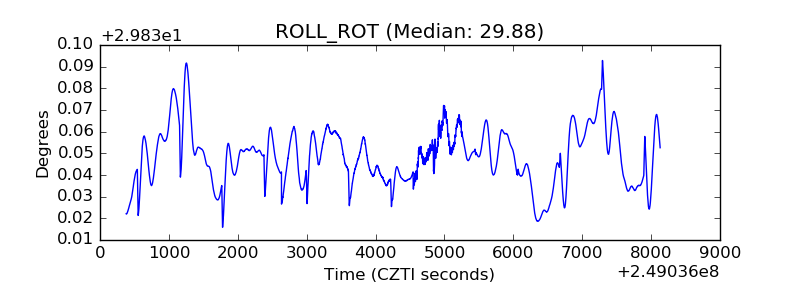 |
| _Roll_DEC | 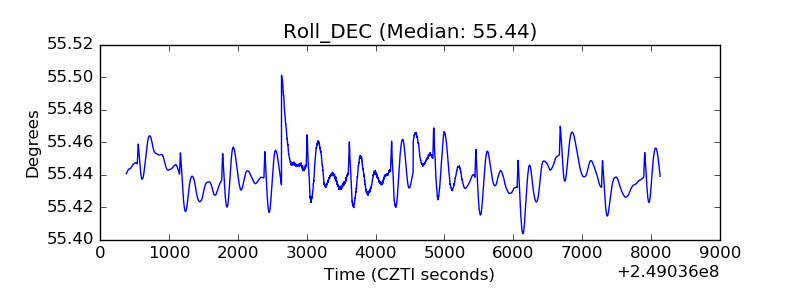 |
| _Roll_RA | 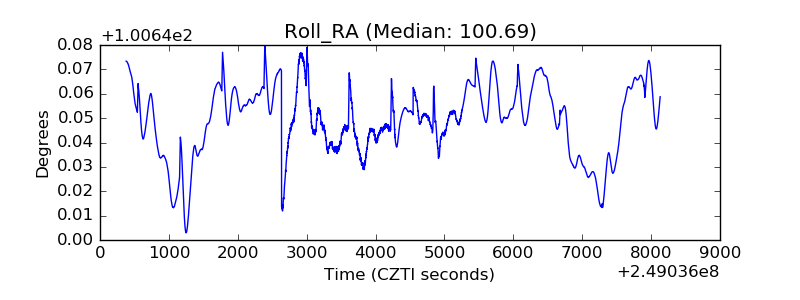 |
| Veto Counter | 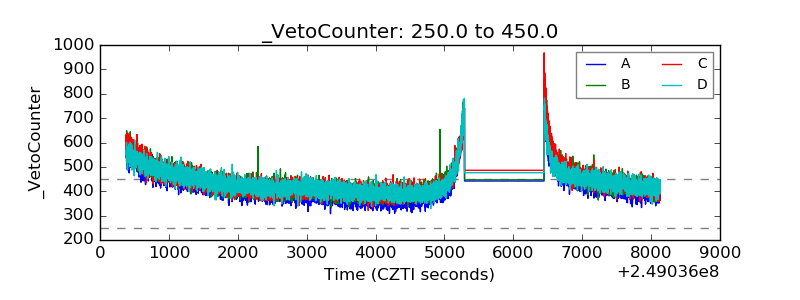 |