| Param | Original file | Final file |
|---|---|---|
| Filename | modeM0/AS1A04_026T01_9000001712_11639cztM0_level2.evt | modeM0/AS1A04_026T01_9000001712_11639cztM0_level2_quad_clean.evt |
| Size (bytes) | 749,329,920 | 71,475,840 |
| Size | 714.6 MB | 68.2 MB |
| Events in quadrant A | 8,124,929 | 389,587 |
| Events in quadrant B | 4,169,647 | 462,559 |
| Events in quadrant C | 2,912,183 | 448,834 |
| Events in quadrant D | 7,055,608 | 416,809 |
| Mode SS | |||
|---|---|---|---|
| Quadrant | BADHDUFLAG | Total packets | Discarded packets |
| A | 0 | 132 | 0 |
| B | 0 | 132 | 0 |
| C | 0 | 132 | 0 |
| D | 0 | 132 | 0 |
| Mode M0 | |||
|---|---|---|---|
| Quadrant | BADHDUFLAG | Total packets | Discarded packets |
| A | 0 | 28535 | 2 |
| B | 0 | 16393 | 1 |
| C | 0 | 13011 | 1 |
| D | 0 | 25468 | 1 |
| Mode M9 | |||
|---|---|---|---|
| Quadrant | BADHDUFLAG | Total packets | Discarded packets |
| A | 0 | 9 | 0 |
| B | 0 | 9 | 0 |
| C | 0 | 9 | 0 |
| D | 0 | 9 | 0 |
| Quadrant | Total seconds | Saturated seconds | Saturation percentage |
|---|---|---|---|
| A | 6380 | 1777 | 27.852665% |
| B | 6380 | 352 | 5.517241% |
| C | 6380 | 79 | 1.238245% |
| D | 6380 | 674 | 10.564263% |
Noise dominated data is calculated using 1-second bins in cleaned event files. If a bin has >2000 counts, and if more than 50% of those come from <1% of pixels, then it is considered to be noise-dominated and hence unusable.
| Quadrant | # 1 sec bins | Bins with >0 counts | Bins with >2000 counts | High rate bins dominated by noise | Noise dominated (total time) | Noise dominated (detector-on time) | Marked lightcurve |
|---|---|---|---|---|---|---|---|
| A | 7336 | 6382 | 1298 | 1298 | 17.69% | 20.34% | 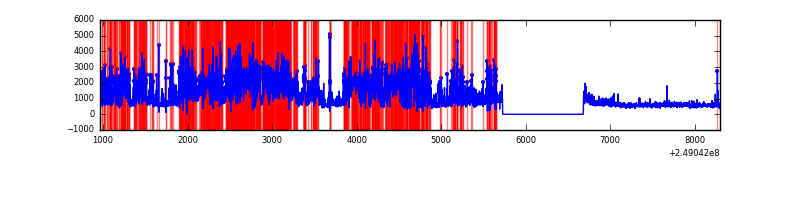 |
| B | 7336 | 6382 | 138 | 138 | 1.88% | 2.16% |  |
| C | 7336 | 6382 | 0 | 0 | 0.00% | 0.00% |  |
| D | 7336 | 6382 | 525 | 525 | 7.16% | 8.23% | 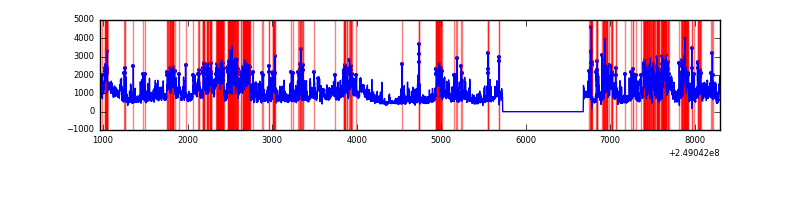 |
Top three noisy pixels from each quadrant. If the there are fewer than three noisy pixels in the level2.evt file, extra rows are filled as -1
| Pixel properties | Quadrant properties | ||||||
|---|---|---|---|---|---|---|---|
| Quadrant | DetID | PixID | Counts | Sigma | Mean | Median | Sigma |
| A | 8 | 5 | 4974306 | 34836.66 | 701 | 688 | 142.8 |
| A | 1 | 162 | 167840 | 1170.78 | 701 | 688 | 142.8 |
| A | 1 | 178 | 94837 | 659.45 | 701 | 688 | 142.8 |
| B | 4 | 239 | 988148 | 6759.99 | 766 | 751 | 146.1 |
| B | 15 | 204 | 86736 | 588.68 | 766 | 751 | 146.1 |
| B | 0 | 219 | 64643 | 437.42 | 766 | 751 | 146.1 |
| C | 13 | 61 | 5598 | 28.15 | 745 | 746 | 172.4 |
| C | 8 | 128 | 4395 | 21.17 | 745 | 746 | 172.4 |
| C | 8 | 112 | 2672 | 11.17 | 745 | 746 | 172.4 |
| D | 13 | 152 | 2751364 | 15825.76 | 724 | 701 | 173.8 |
| D | 13 | 104 | 586439 | 3370.01 | 724 | 701 | 173.8 |
| D | 1 | 52 | 487568 | 2801.16 | 724 | 701 | 173.8 |
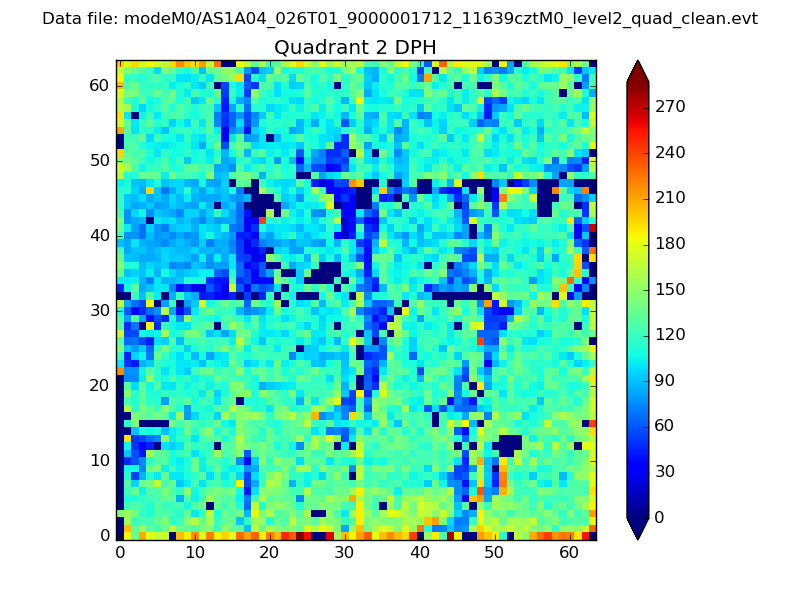
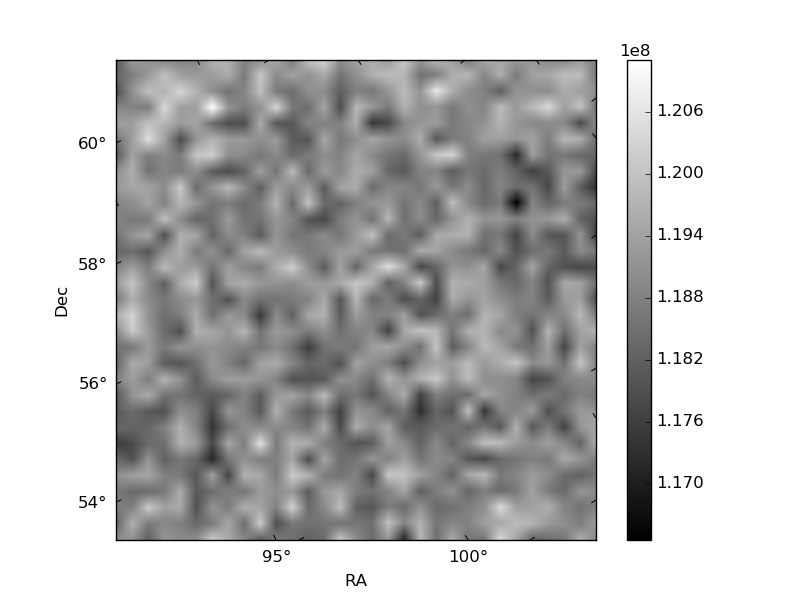
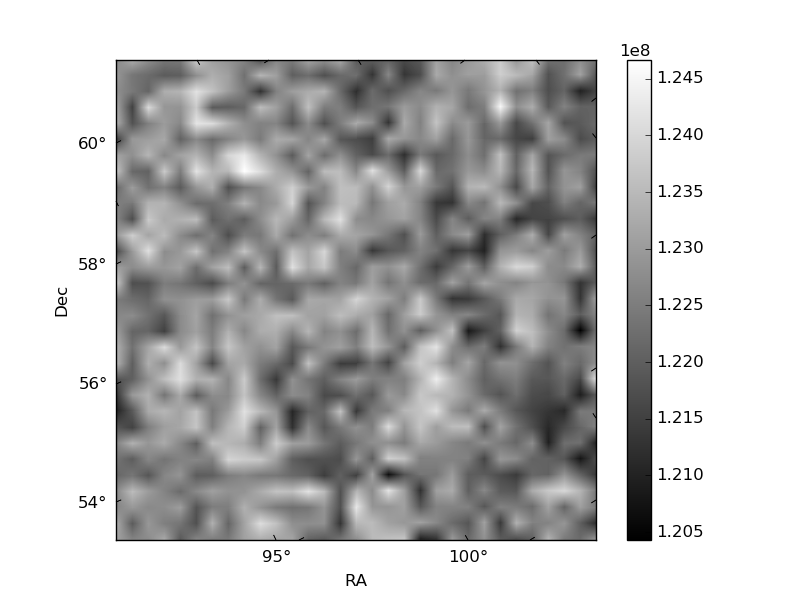
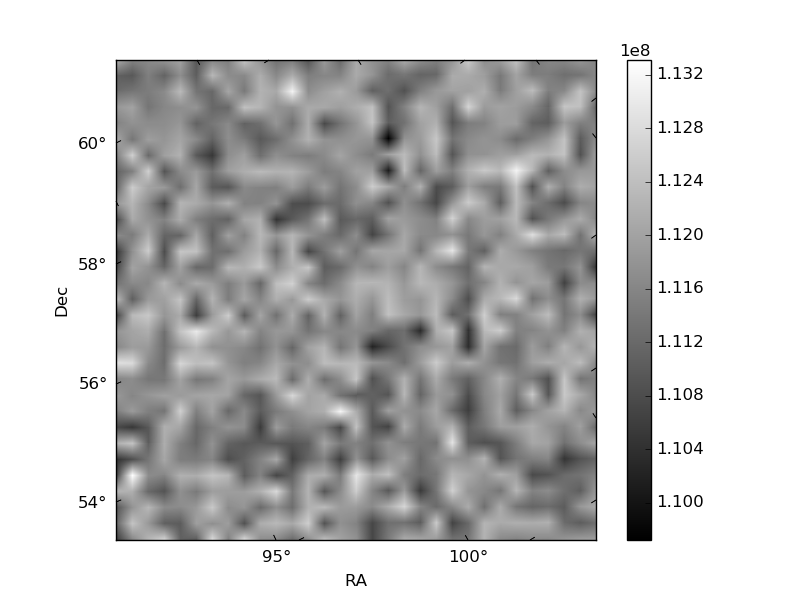
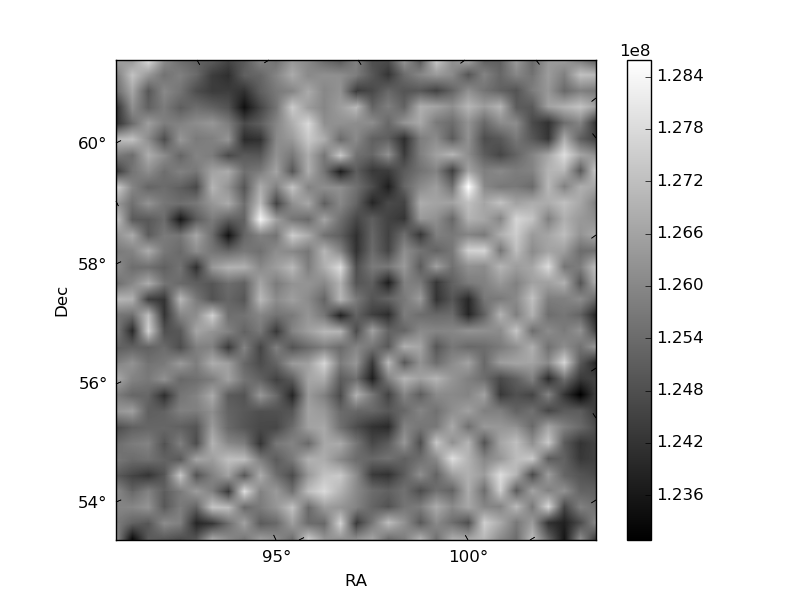
Histogram calculated using DETX and DETY for each event in the final _common_clean file
| Quadrant A | 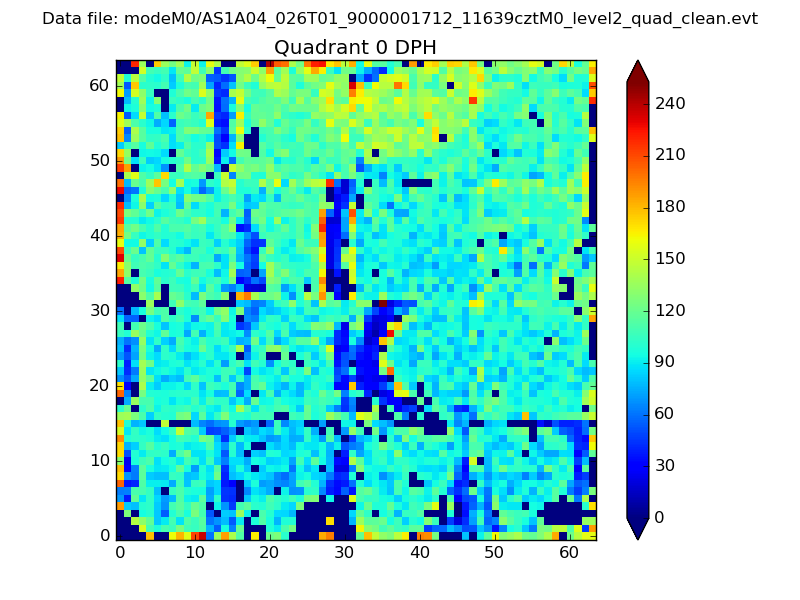 |
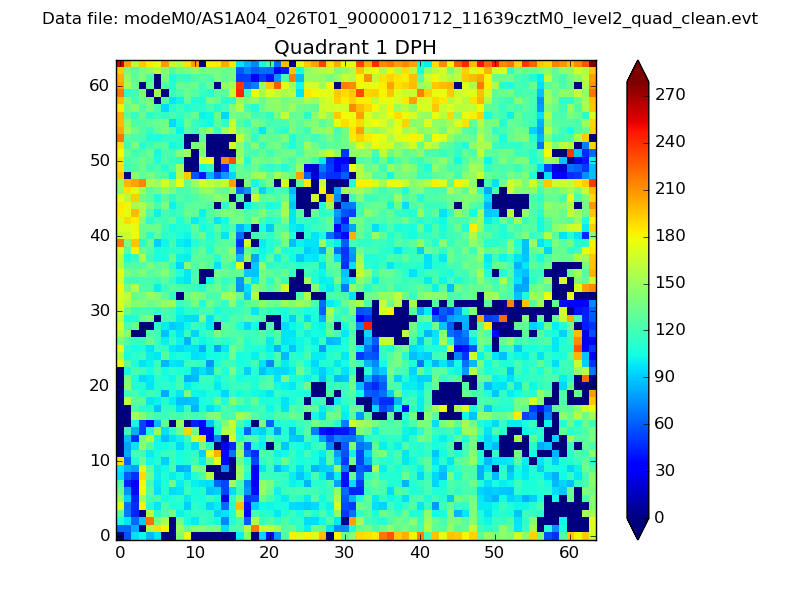 |
Quadrant B |
|---|---|---|---|
| Quadrant D | 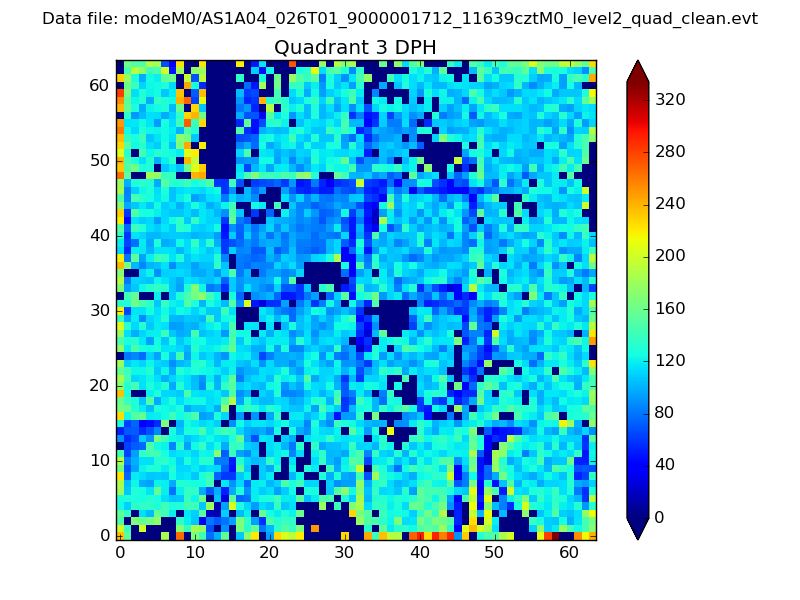 |
 |
Quadrant C |
| Plot type | Count rate plots | Images |
|---|---|---|
| Comparison with Poisson distribution Blue bars denote a histogram of data divided into 1 sec bins. Red curve is a Poisson curve with rate = median count rate of data. |
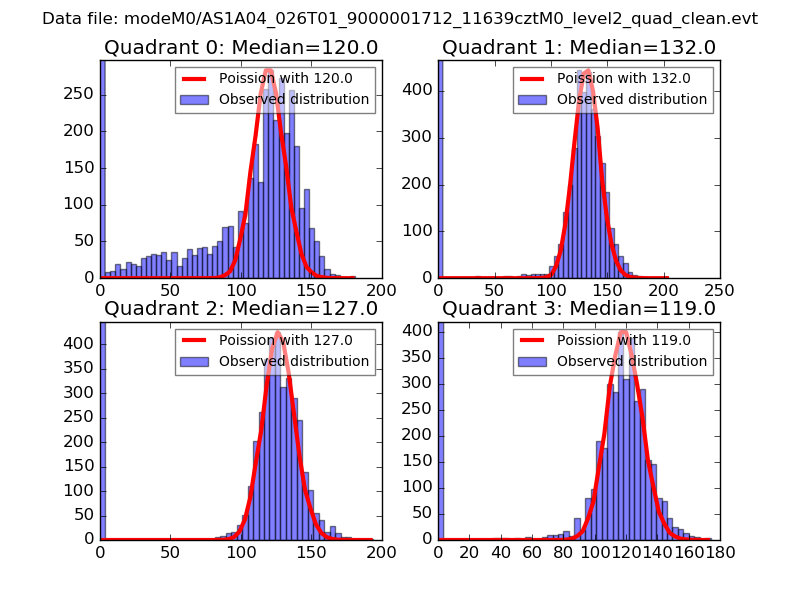 |
 |
| Quadrant-wise count rates Data is divided into 100 sec bins |
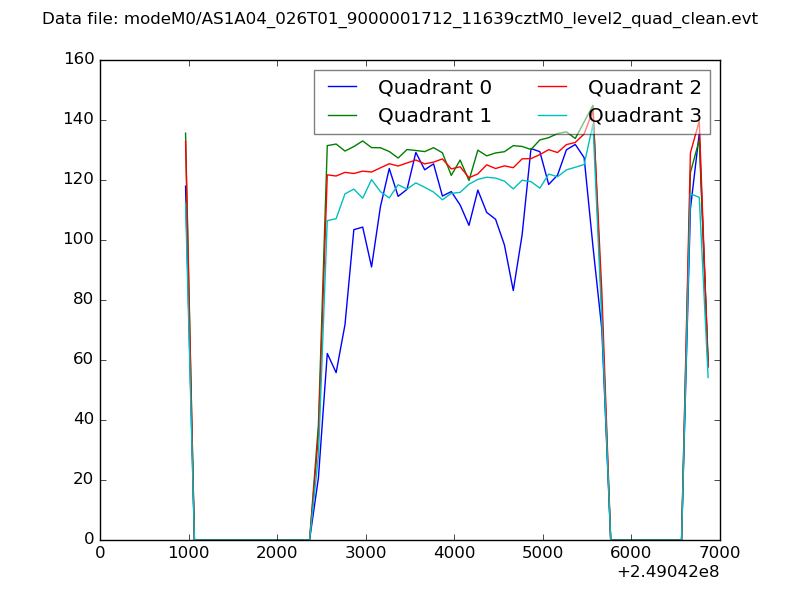 |
|
| Module-wise count rates for Quadrant A Data is divided into 100 sec bins |
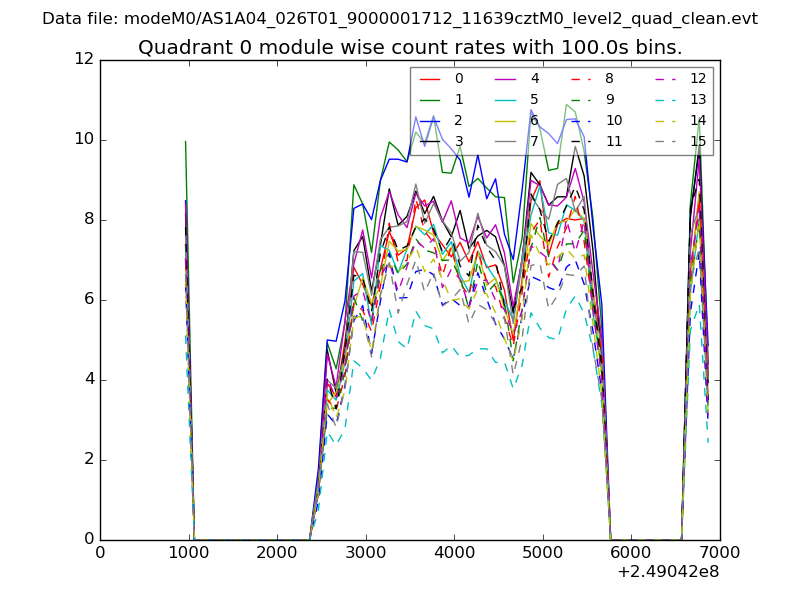 |
 |
| Module-wise count rates for Quadrant B Data is divided into 100 sec bins |
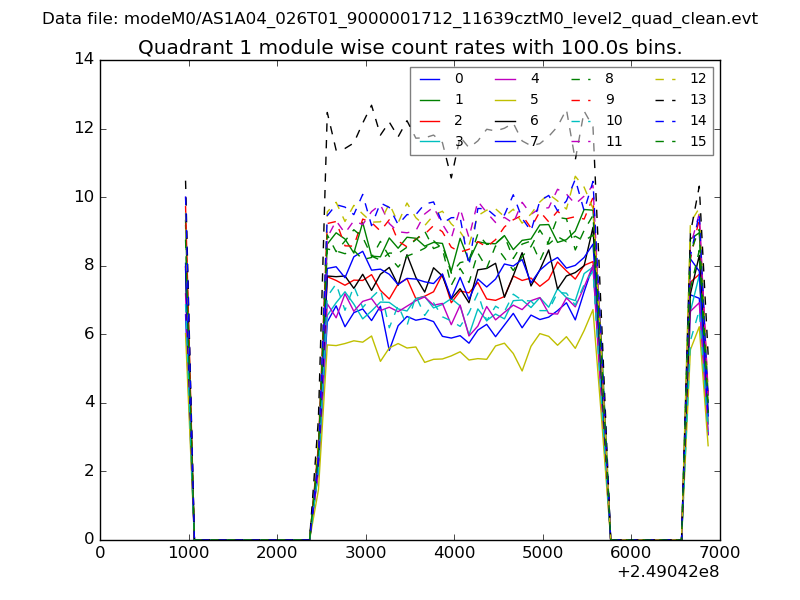 |
 |
| Module-wise count rates for Quadrant C Data is divided into 100 sec bins |
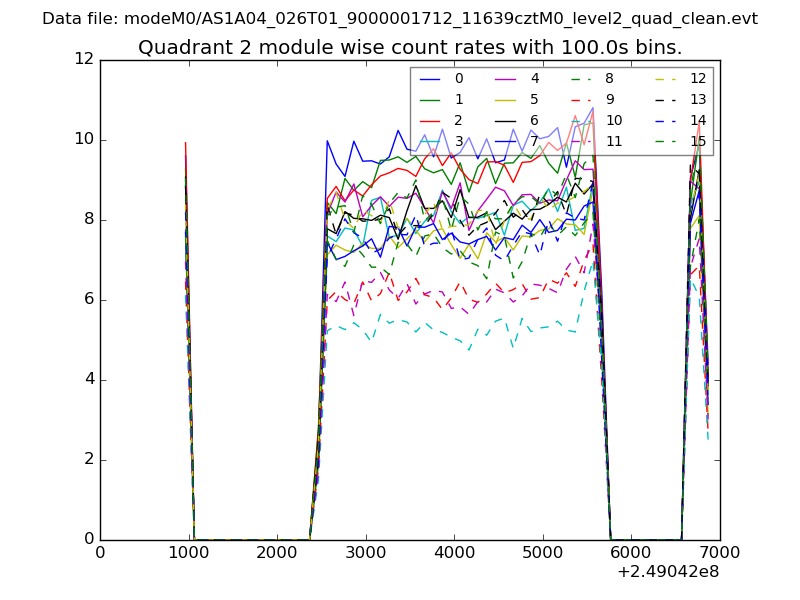 |
 |
| Module-wise count rates for Quadrant D Data is divided into 100 sec bins |
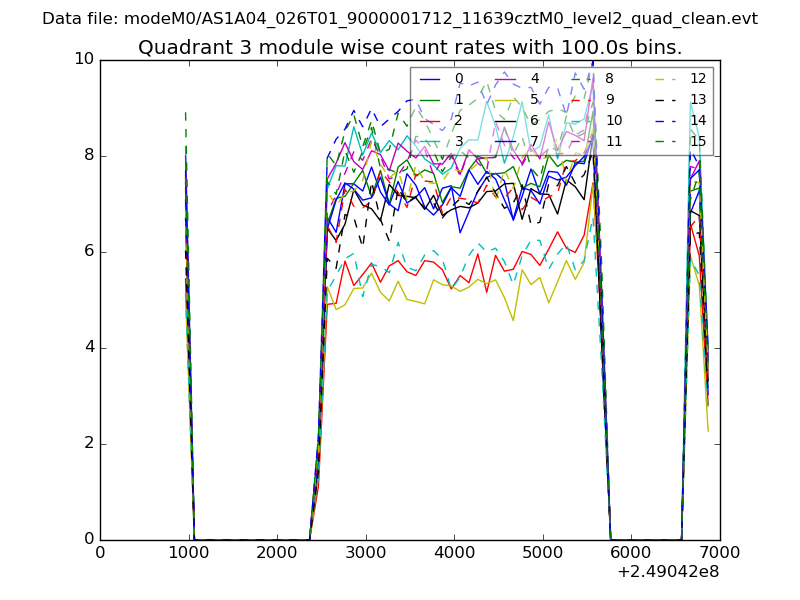 |
 |
| Parameter | Plot |
|---|---|
| CZT HV Monitor | 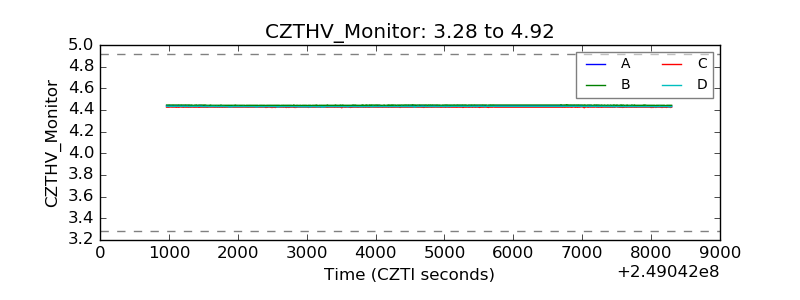 |
| D_VDD | 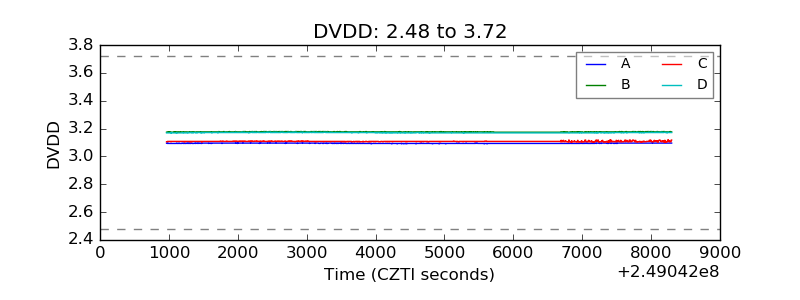 |
| Temperature 1 | 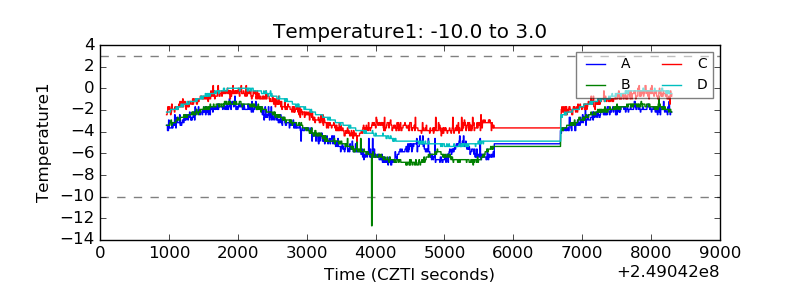 |
| Veto HV Monitor | 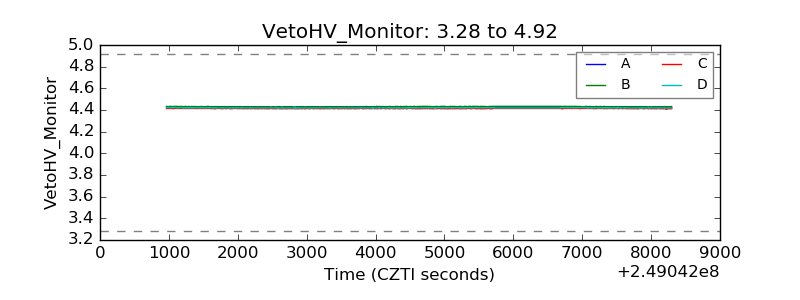 |
| Veto LLD |  |
| Alpha Counter | 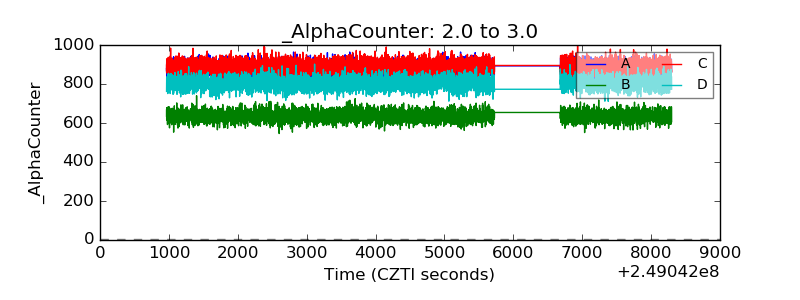 |
| _CPM_Rate | 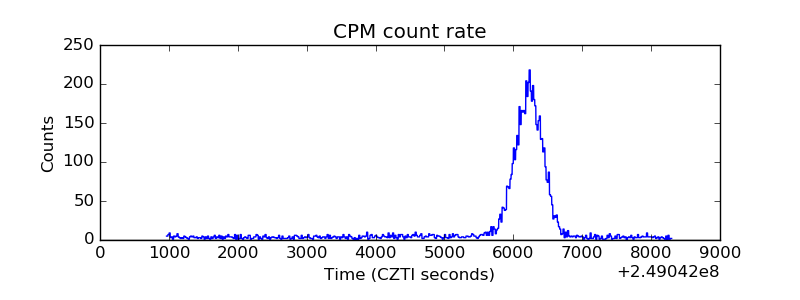 |
| CZT Counter | 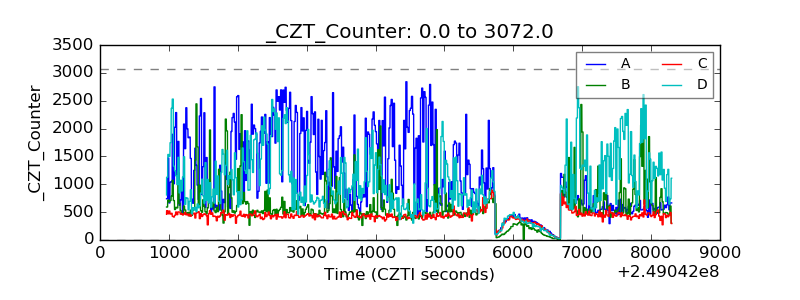 |
| +2.5 Volts monitor |  |
| +5 Volts monitor |  |
| _ROLL_ROT | 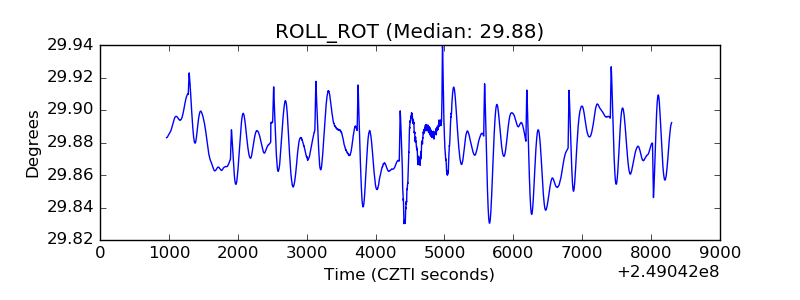 |
| _Roll_DEC | 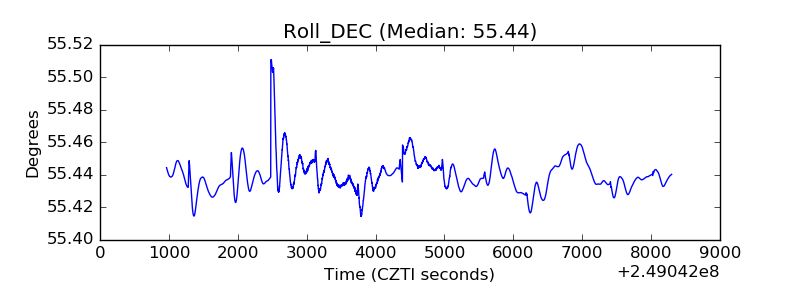 |
| _Roll_RA | 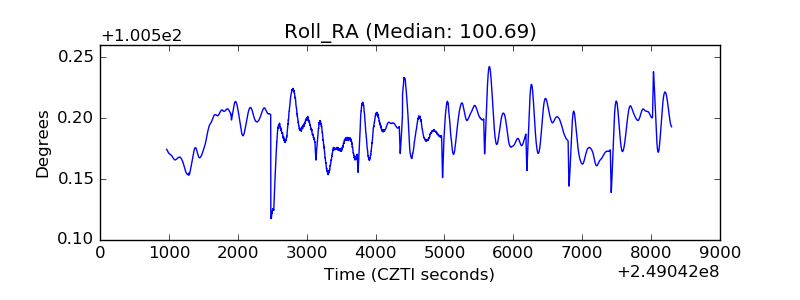 |
| Veto Counter | 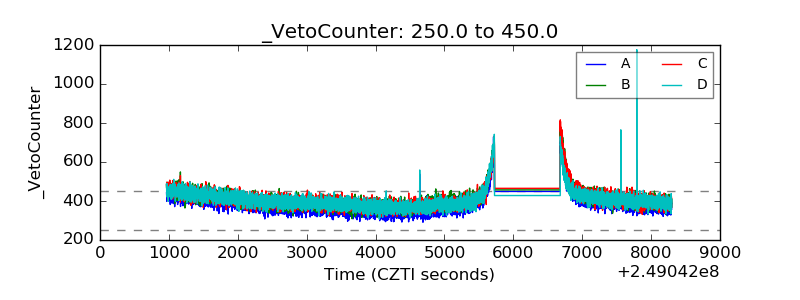 |