| Param | Original file | Final file |
|---|---|---|
| Filename | modeM0/AS1A04_026T01_9000001712_11640cztM0_level2.evt | modeM0/AS1A04_026T01_9000001712_11640cztM0_level2_quad_clean.evt |
| Size (bytes) | 318,309,120 | 34,493,760 |
| Size | 303.6 MB | 32.9 MB |
| Events in quadrant A | 1,976,121 | 212,974 |
| Events in quadrant B | 2,148,651 | 213,859 |
| Events in quadrant C | 1,432,407 | 205,534 |
| Events in quadrant D | 3,866,930 | 186,227 |
| Mode SS | |||
|---|---|---|---|
| Quadrant | BADHDUFLAG | Total packets | Discarded packets |
| A | 0 | 64 | 0 |
| B | 0 | 64 | 0 |
| C | 0 | 64 | 0 |
| D | 0 | 64 | 0 |
| Mode M0 | |||
|---|---|---|---|
| Quadrant | BADHDUFLAG | Total packets | Discarded packets |
| A | 0 | 8052 | 1 |
| B | 0 | 8366 | 1 |
| C | 0 | 6431 | 1 |
| D | 0 | 13709 | 1 |
| Quadrant | Total seconds | Saturated seconds | Saturation percentage |
|---|---|---|---|
| A | 3165 | 76 | 2.401264% |
| B | 3165 | 173 | 5.466035% |
| C | 3165 | 22 | 0.695103% |
| D | 3166 | 477 | 15.066330% |
Noise dominated data is calculated using 1-second bins in cleaned event files. If a bin has >2000 counts, and if more than 50% of those come from <1% of pixels, then it is considered to be noise-dominated and hence unusable.
| Quadrant | # 1 sec bins | Bins with >0 counts | Bins with >2000 counts | High rate bins dominated by noise | Noise dominated (total time) | Noise dominated (detector-on time) | Marked lightcurve |
|---|---|---|---|---|---|---|---|
| A | 3166 | 3166 | 6 | 6 | 0.19% | 0.19% | 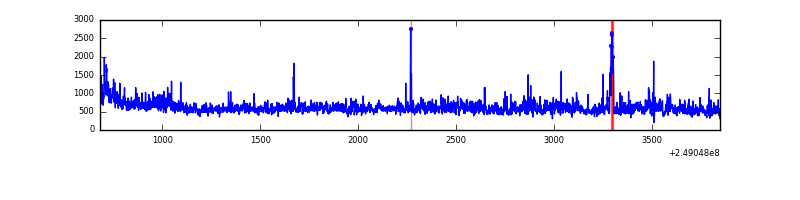 |
| B | 3166 | 3166 | 79 | 79 | 2.50% | 2.50% | 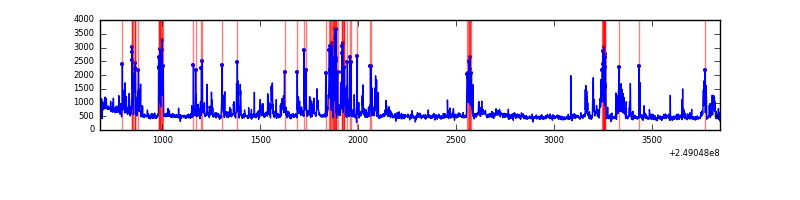 |
| C | 3166 | 3166 | 0 | 0 | 0.00% | 0.00% | 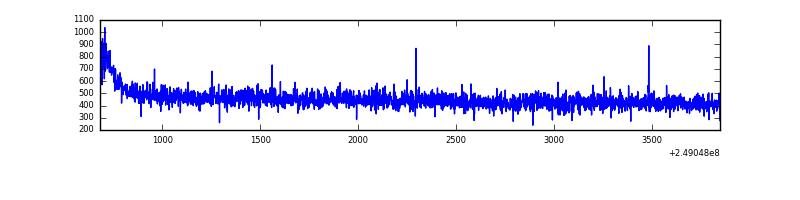 |
| D | 3167 | 3167 | 413 | 413 | 13.04% | 13.04% | 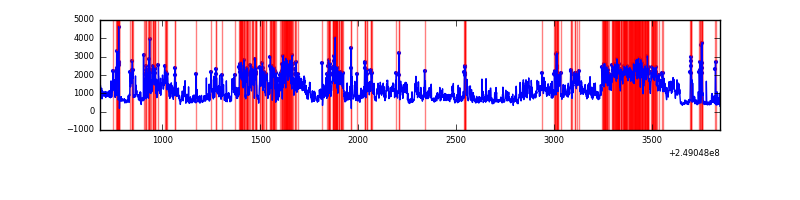 |
Top three noisy pixels from each quadrant. If the there are fewer than three noisy pixels in the level2.evt file, extra rows are filled as -1
| Pixel properties | Quadrant properties | ||||||
|---|---|---|---|---|---|---|---|
| Quadrant | DetID | PixID | Counts | Sigma | Mean | Median | Sigma |
| A | 1 | 162 | 150916 | 1935.97 | 378 | 371 | 77.8 |
| A | 1 | 178 | 89144 | 1141.6 | 378 | 371 | 77.8 |
| A | 8 | 5 | 80928 | 1035.94 | 378 | 371 | 77.8 |
| B | 4 | 239 | 573528 | 7948.64 | 373 | 367 | 72.1 |
| B | 15 | 204 | 45310 | 623.27 | 373 | 367 | 72.1 |
| B | 0 | 219 | 35380 | 485.56 | 373 | 367 | 72.1 |
| C | 8 | 128 | 5951 | 65.62 | 363 | 364 | 85.1 |
| C | 8 | 112 | 3574 | 37.7 | 363 | 364 | 85.1 |
| C | 13 | 61 | 2737 | 27.87 | 363 | 364 | 85.1 |
| D | 13 | 152 | 1486053 | 17364.7 | 352 | 340 | 85.6 |
| D | 13 | 104 | 376339 | 4394.59 | 352 | 340 | 85.6 |
| D | 1 | 52 | 334882 | 3910.05 | 352 | 340 | 85.6 |
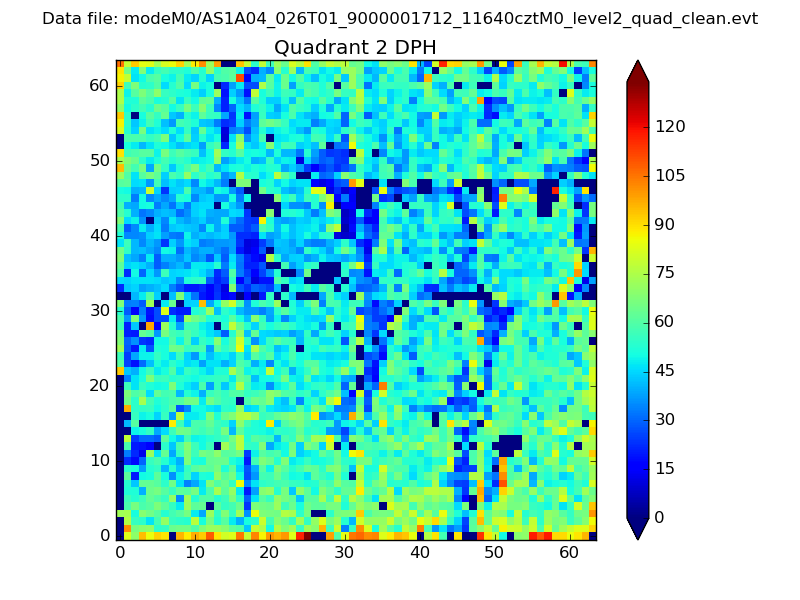
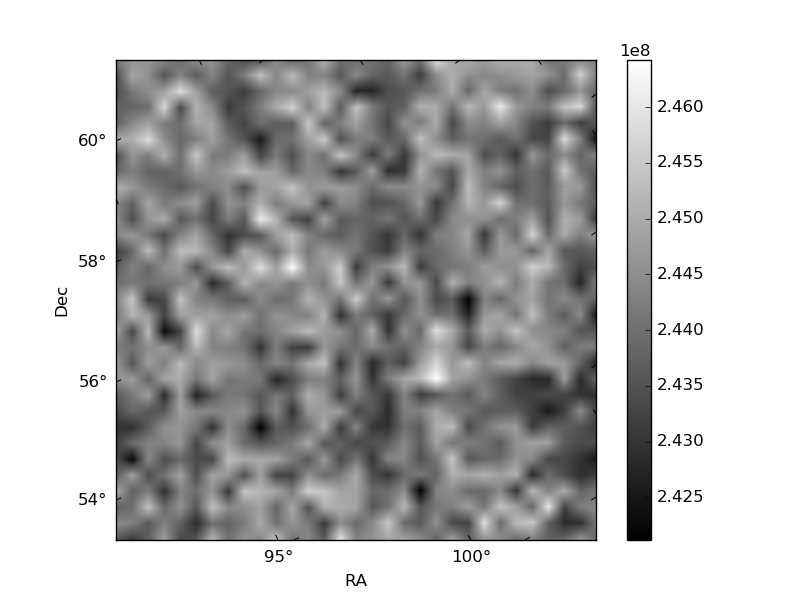
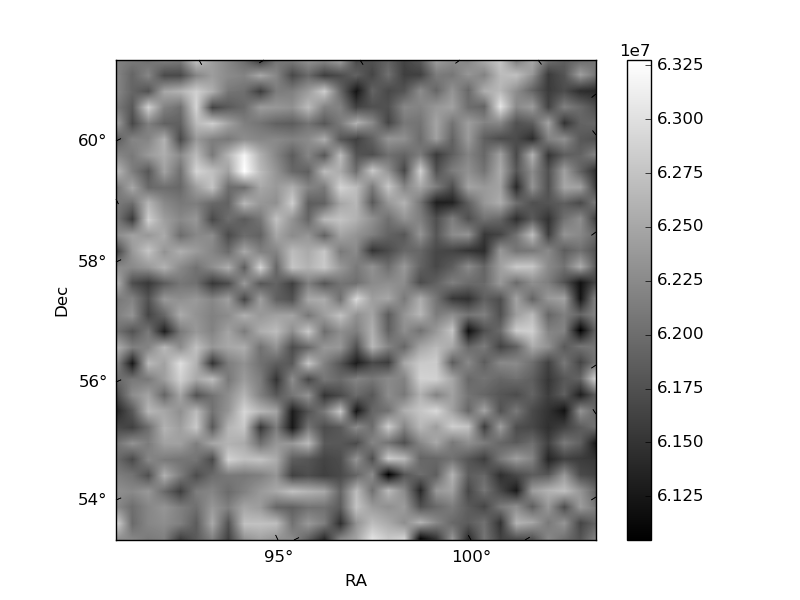
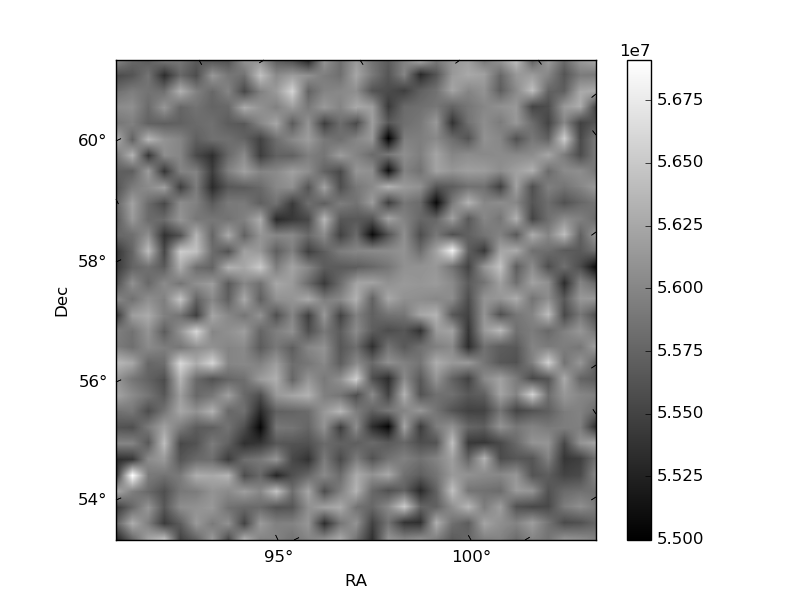
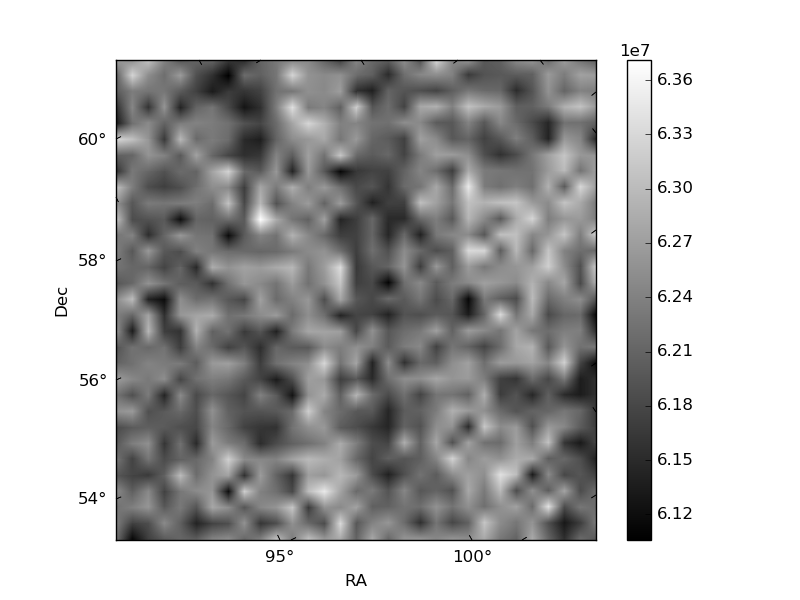
Histogram calculated using DETX and DETY for each event in the final _common_clean file
| Quadrant A | 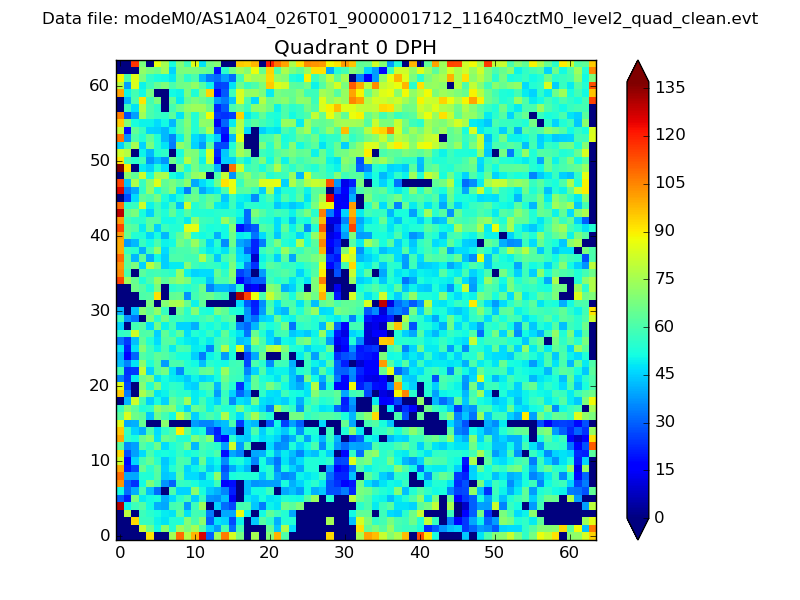 |
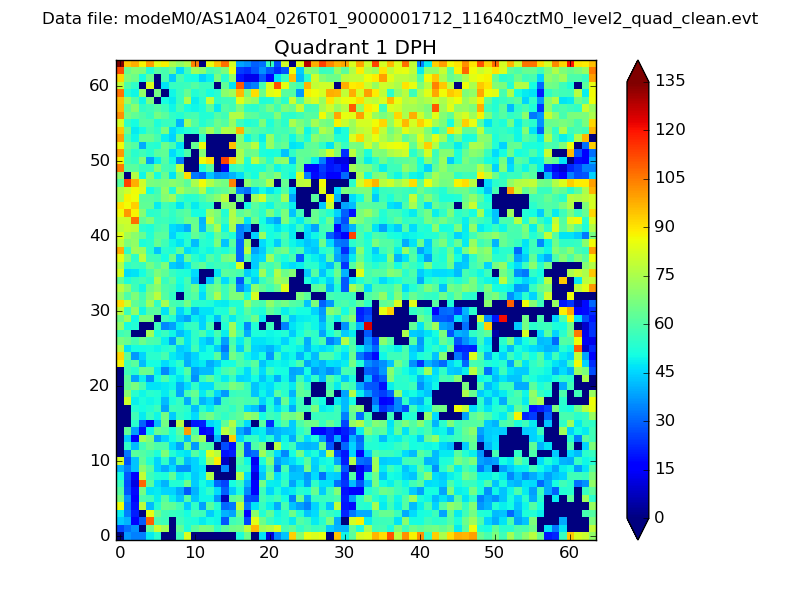 |
Quadrant B |
|---|---|---|---|
| Quadrant D | 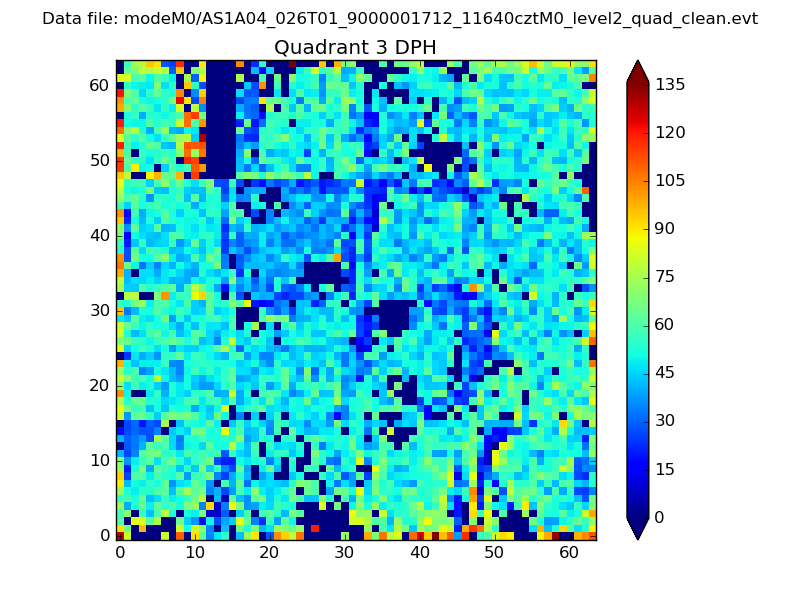 |
 |
Quadrant C |
| Plot type | Count rate plots | Images |
|---|---|---|
| Comparison with Poisson distribution Blue bars denote a histogram of data divided into 1 sec bins. Red curve is a Poisson curve with rate = median count rate of data. |
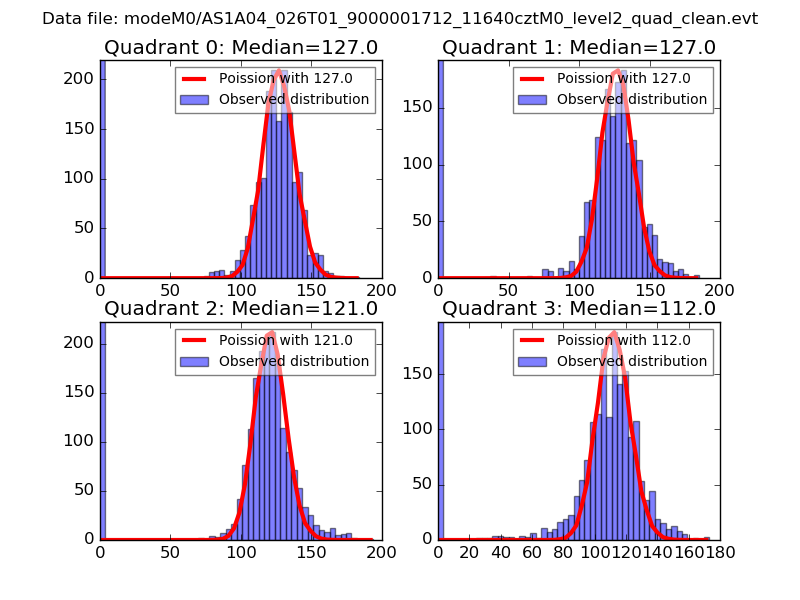 |
 |
| Quadrant-wise count rates Data is divided into 100 sec bins |
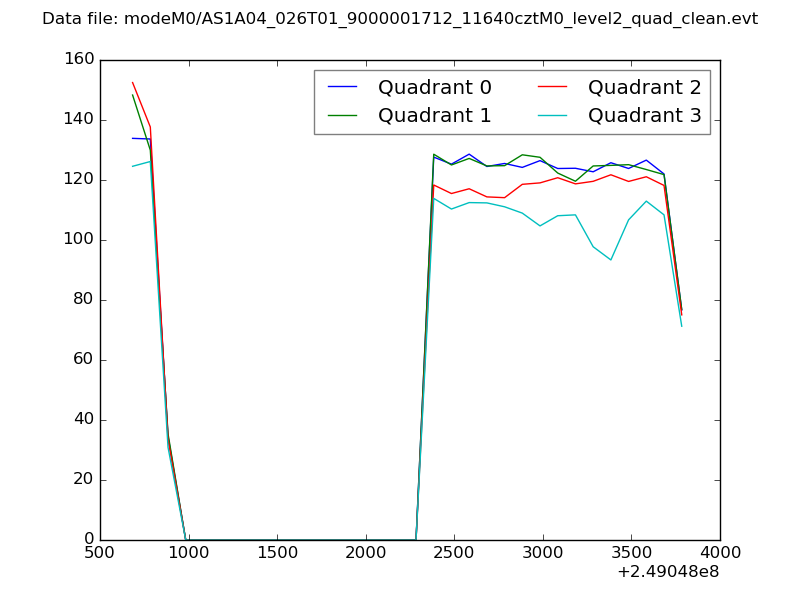 |
|
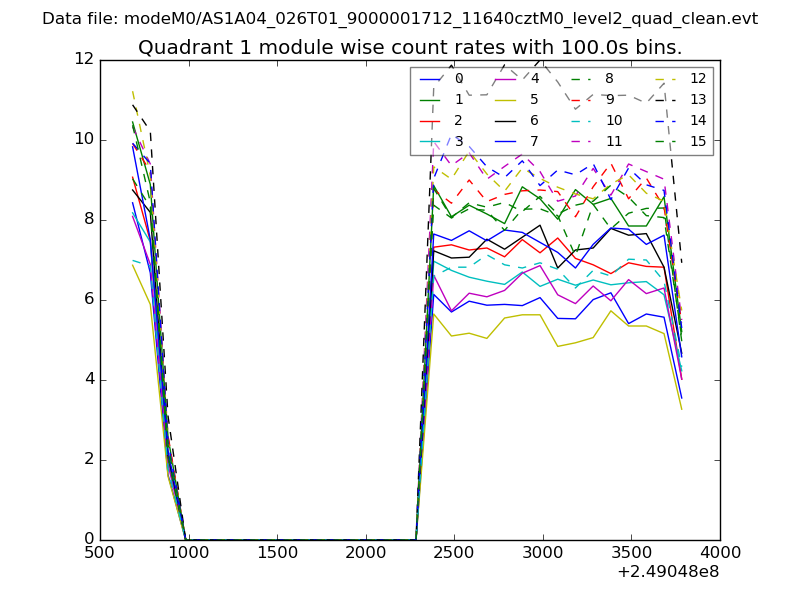
| Module-wise count rates for Quadrant A Data is divided into 100 sec bins |
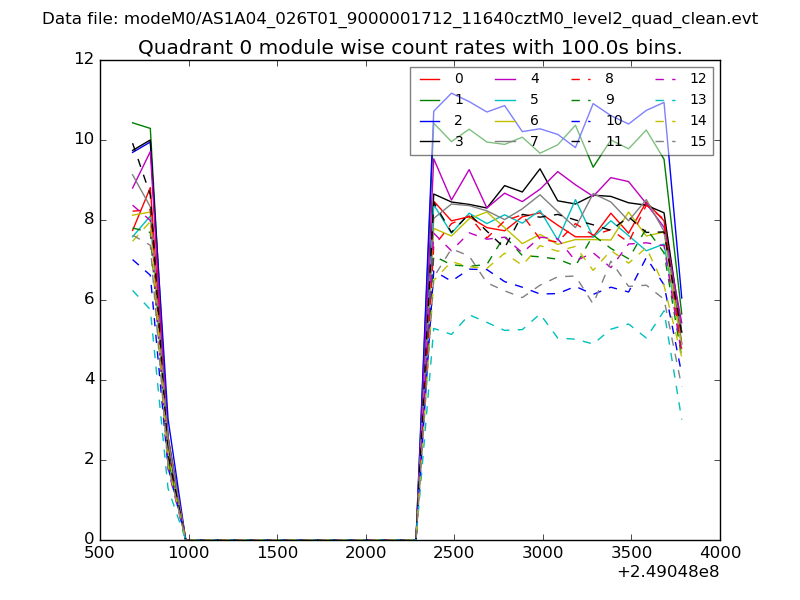 |
 |
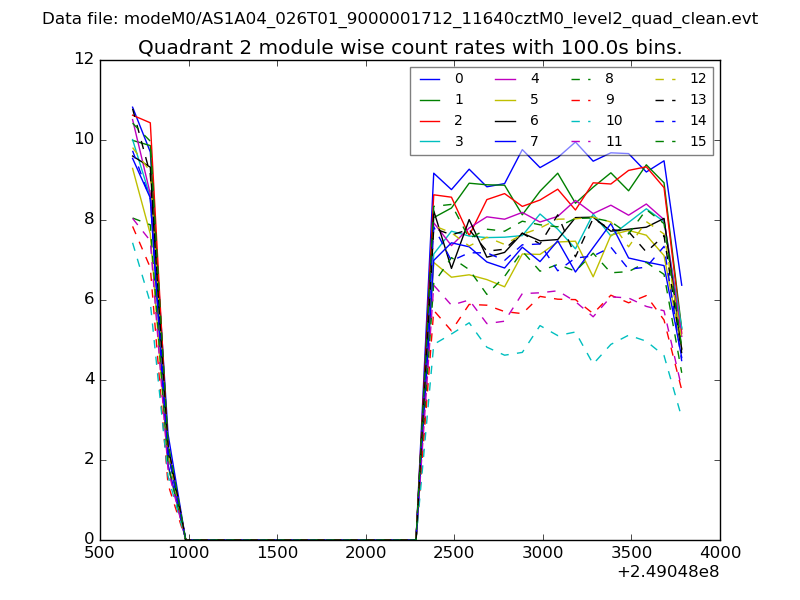
| Module-wise count rates for Quadrant B Data is divided into 100 sec bins |
 |
 |
| Module-wise count rates for Quadrant C Data is divided into 100 sec bins |
 |
 |
| Module-wise count rates for Quadrant D Data is divided into 100 sec bins |
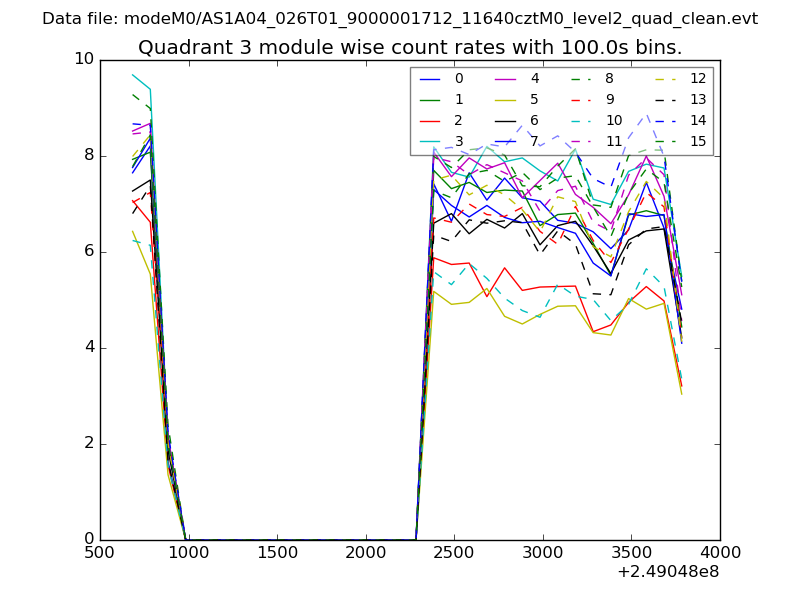 |
 |
| Parameter | Plot |
|---|---|
| CZT HV Monitor | 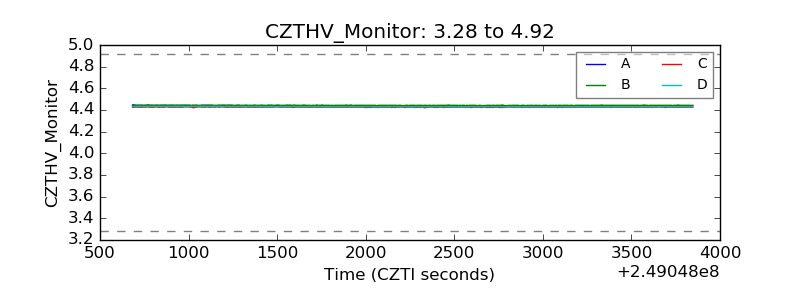 |
| D_VDD | 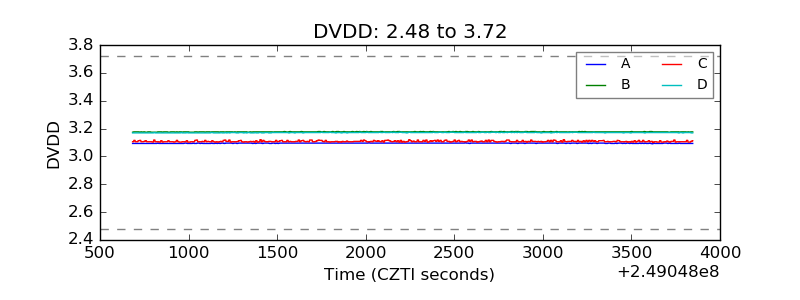 |
| Temperature 1 | 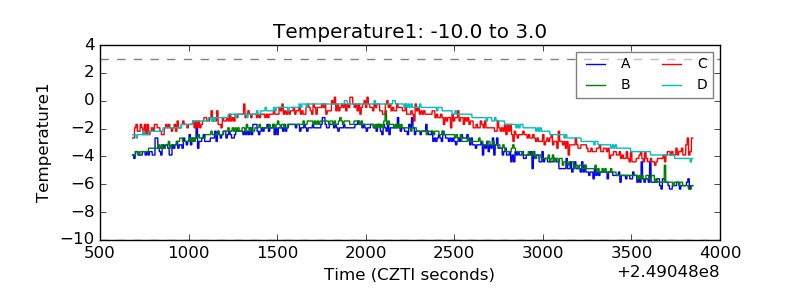 |
| Veto HV Monitor | 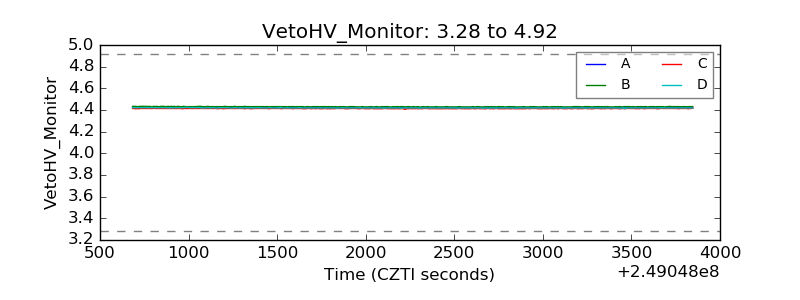 |
| Veto LLD | 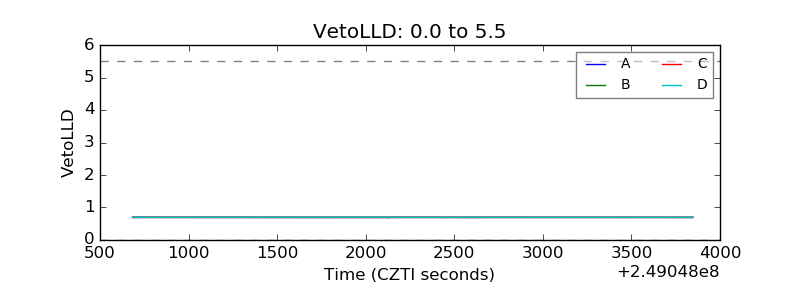 |
| Alpha Counter | 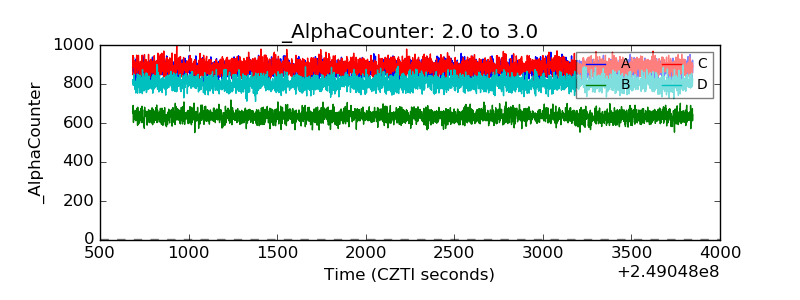 |
| _CPM_Rate | 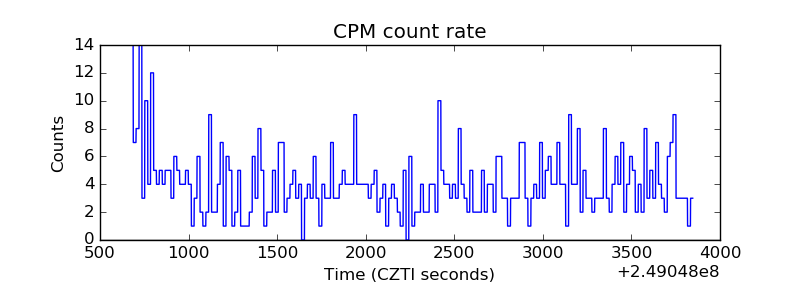 |
| CZT Counter | 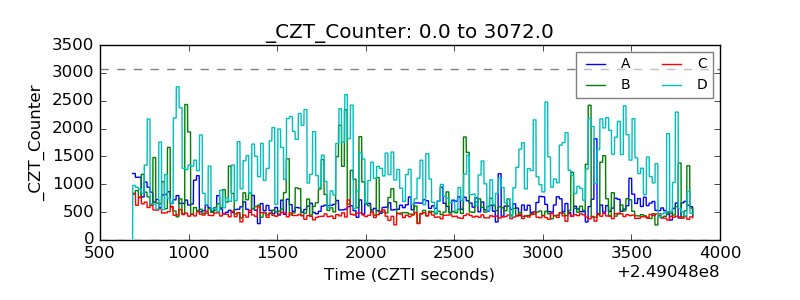 |
| +2.5 Volts monitor | 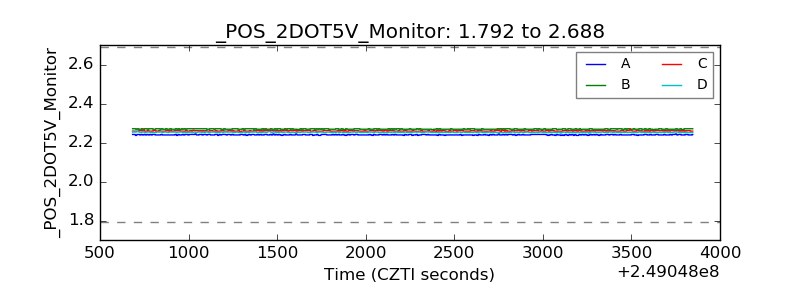 |
| +5 Volts monitor | 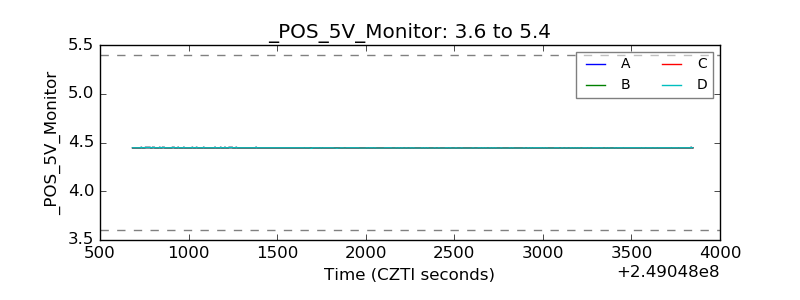 |
| _ROLL_ROT | 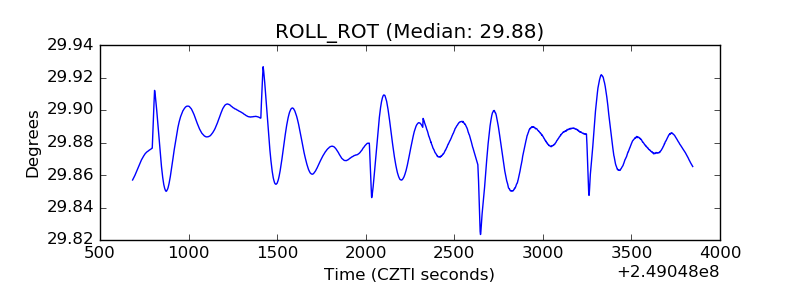 |
| _Roll_DEC | 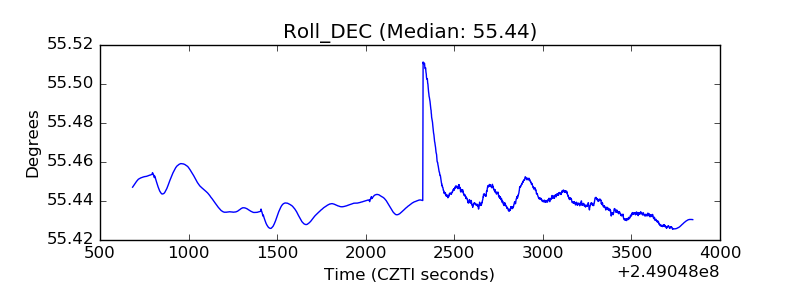 |
| _Roll_RA | 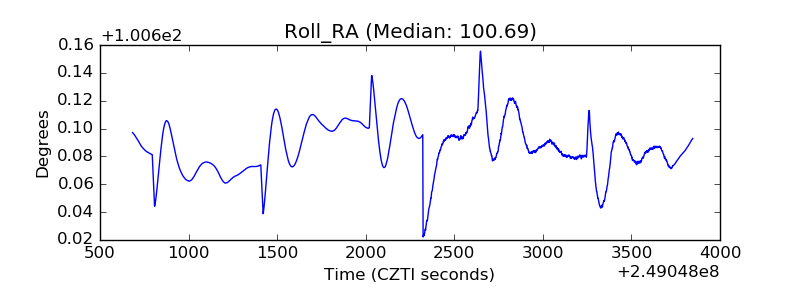 |
| Veto Counter | 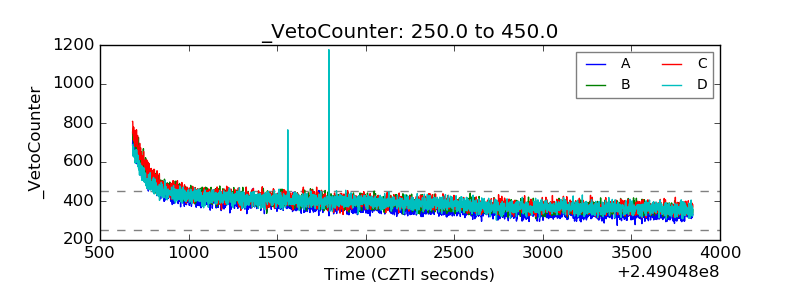 |