| Param | Original file | Final file |
|---|---|---|
| Filename | modeM0/AS1A04_026T04_9000001714cztM0_level2.fits | modeM0/AS1A04_026T04_9000001714cztM0_level2_quad_clean.evt |
| Size (bytes) | 198,483,840 | 282,487,680 |
| Size | 189.3 MB | 269.4 MB |
| Events in quadrant A | 1,189,880 | 1,892,195 |
| Events in quadrant B | 1,137,438 | 1,837,572 |
| Events in quadrant C | 1,178,656 | 1,772,637 |
| Events in quadrant D | 973,758 | 1,523,292 |
| Mode M9 | |||
|---|---|---|---|
| Quadrant | BADHDUFLAG | Total packets | Discarded packets |
| A | 0 | 17 | 0 |
| B | 0 | 17 | 0 |
| C | 0 | 17 | 0 |
| D | 0 | 17 | 0 |
| Mode SS | |||
|---|---|---|---|
| Quadrant | BADHDUFLAG | Total packets | Discarded packets |
| A | 0 | 452 | 0 |
| B | 0 | 452 | 0 |
| C | 0 | 452 | 0 |
| D | 0 | 452 | 0 |
| Mode M0 | |||
|---|---|---|---|
| Quadrant | BADHDUFLAG | Total packets | Discarded packets |
| A | 0 | 57759 | 0 |
| B | 0 | 55099 | 0 |
| C | 0 | 45237 | 0 |
| D | 0 | 69456 | 0 |
| Quadrant | Total seconds | Saturated seconds | Saturation percentage |
|---|---|---|---|
| A | 22228 | 631 | 2.838762% |
| B | 22228 | 1083 | 4.872233% |
| C | 22228 | 161 | 0.724312% |
| D | 22228 | 1991 | 8.957171% |
Noise dominated data is calculated using 1-second bins in cleaned event files. If a bin has >2000 counts, and if more than 50% of those come from <1% of pixels, then it is considered to be noise-dominated and hence unusable.
| Quadrant | # 1 sec bins | Bins with >0 counts | Bins with >2000 counts | High rate bins dominated by noise | Noise dominated (total time) | Noise dominated (detector-on time) | Marked lightcurve |
|---|---|---|---|---|---|---|---|
| A | 23828 | 22228 | 0 | 0 | 0.00% | 0.00% |  |
| B | 23828 | 22219 | 0 | 0 | 0.00% | 0.00% |  |
| C | 23828 | 22228 | 0 | 0 | 0.00% | 0.00% |  |
| D | 23828 | 22181 | 0 | 0 | 0.00% | 0.00% | 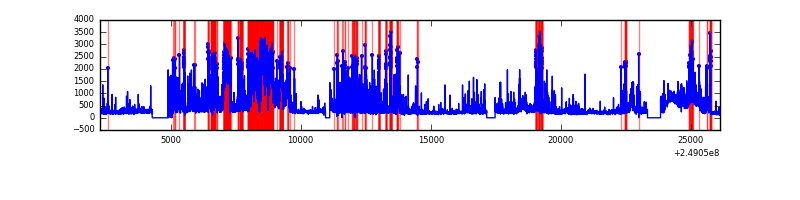 |
Top three noisy pixels from each quadrant. If the there are fewer than three noisy pixels in the level2.evt file, extra rows are filled as -1
| Pixel properties | Quadrant properties | ||||||
|---|---|---|---|---|---|---|---|
| Quadrant | DetID | PixID | Counts | Sigma | Mean | Median | Sigma |
| A | 14 | 188 | 1180 | 11.19 | 309 | 289 | 79.6 |
| A | 0 | 29 | 1174 | 11.12 | 309 | 289 | 79.6 |
| A | 14 | 204 | 994 | 8.86 | 309 | 289 | 79.6 |
| B | 2 | 9 | 922 | 10.55 | 299 | 285 | 60.4 |
| B | 14 | 254 | 805 | 8.62 | 299 | 285 | 60.4 |
| B | 5 | 128 | 741 | 7.56 | 299 | 285 | 60.4 |
| C | 12 | 241 | 861 | 6.97 | 311 | 289 | 82.1 |
| C | 2 | 191 | 838 | 6.69 | 311 | 289 | 82.1 |
| C | 3 | 126 | 825 | 6.53 | 311 | 289 | 82.1 |
| D | 7 | 5 | 762 | 6.66 | 278 | 252 | 76.5 |
| D | 3 | 14 | 726 | 6.19 | 278 | 252 | 76.5 |
| D | 6 | 231 | 719 | 6.1 | 278 | 252 | 76.5 |
Histogram calculated using DETX and DETY for each event in the final _common_clean file
| Quadrant A |  |
 |
Quadrant B |
|---|---|---|---|
| Quadrant D |  |
 |
Quadrant C |
| Plot type | Count rate plots | Images |
|---|---|---|
| Comparison with Poisson distribution Blue bars denote a histogram of data divided into 1 sec bins. Red curve is a Poisson curve with rate = median count rate of data. |
 |
 |
| Quadrant-wise count rates Data is divided into 100 sec bins |
 |
|
| Module-wise count rates for Quadrant A Data is divided into 100 sec bins |
 |
 |
| Module-wise count rates for Quadrant B Data is divided into 100 sec bins |
 |
 |
| Module-wise count rates for Quadrant C Data is divided into 100 sec bins |
 |
 |
| Module-wise count rates for Quadrant D Data is divided into 100 sec bins |
 |
 |
| Parameter | Plot |
|---|---|
| CZT HV Monitor |  |
| D_VDD |  |
| Temperature 1 |  |
| Veto HV Monitor |  |
| Veto LLD |  |
| Alpha Counter |  |
| _CPM_Rate |  |
| CZT Counter |  |
| +2.5 Volts monitor |  |
| +5 Volts monitor |  |
| _ROLL_ROT |  |
| _Roll_DEC |  |
| _Roll_RA | 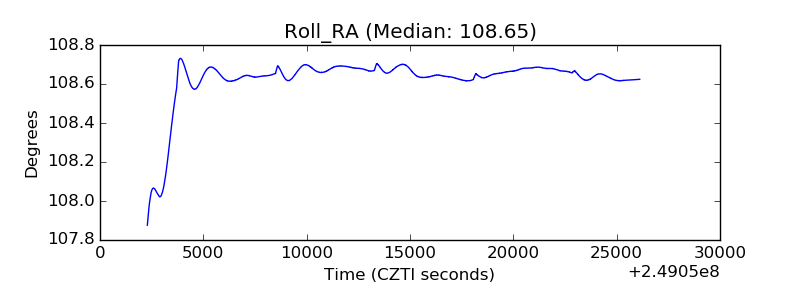 |
| Veto Counter |  |