| Param | Original file | Final file |
|---|---|---|
| Filename | modeM0/AS1A04_026T04_9000001714_11640cztM0_level2.evt | modeM0/AS1A04_026T04_9000001714_11640cztM0_level2_quad_clean.evt |
| Size (bytes) | 295,960,320 | 67,152,960 |
| Size | 282.2 MB | 64.0 MB |
| Events in quadrant A | 2,348,874 | 456,042 |
| Events in quadrant B | 2,136,023 | 462,239 |
| Events in quadrant C | 1,643,251 | 448,514 |
| Events in quadrant D | 2,587,415 | 409,947 |
| Mode M9 | |||
|---|---|---|---|
| Quadrant | BADHDUFLAG | Total packets | Discarded packets |
| A | 0 | 7 | 0 |
| B | 0 | 7 | 0 |
| C | 0 | 7 | 0 |
| D | 0 | 7 | 0 |
| Mode SS | |||
|---|---|---|---|
| Quadrant | BADHDUFLAG | Total packets | Discarded packets |
| A | 0 | 74 | 0 |
| B | 0 | 74 | 0 |
| C | 0 | 74 | 0 |
| D | 0 | 74 | 0 |
| Mode M0 | |||
|---|---|---|---|
| Quadrant | BADHDUFLAG | Total packets | Discarded packets |
| A | 0 | 9510 | 2 |
| B | 0 | 8723 | 1 |
| C | 0 | 7439 | 1 |
| D | 0 | 10234 | 1 |
| Quadrant | Total seconds | Saturated seconds | Saturation percentage |
|---|---|---|---|
| A | 3625 | 173 | 4.772414% |
| B | 3625 | 188 | 5.186207% |
| C | 3625 | 55 | 1.517241% |
| D | 3625 | 285 | 7.862069% |
Noise dominated data is calculated using 1-second bins in cleaned event files. If a bin has >2000 counts, and if more than 50% of those come from <1% of pixels, then it is considered to be noise-dominated and hence unusable.
| Quadrant | # 1 sec bins | Bins with >0 counts | Bins with >2000 counts | High rate bins dominated by noise | Noise dominated (total time) | Noise dominated (detector-on time) | Marked lightcurve |
|---|---|---|---|---|---|---|---|
| A | 4231 | 3627 | 13 | 13 | 0.31% | 0.36% | 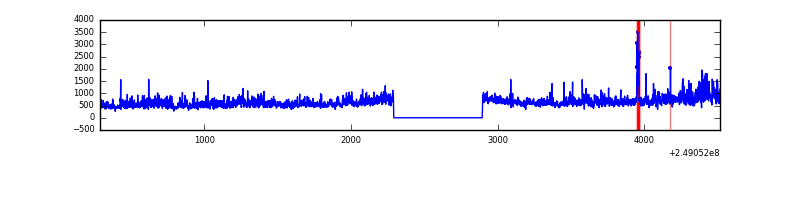 |
| B | 4231 | 3627 | 45 | 45 | 1.06% | 1.24% |  |
| C | 4231 | 3627 | 1 | 1 | 0.02% | 0.03% | 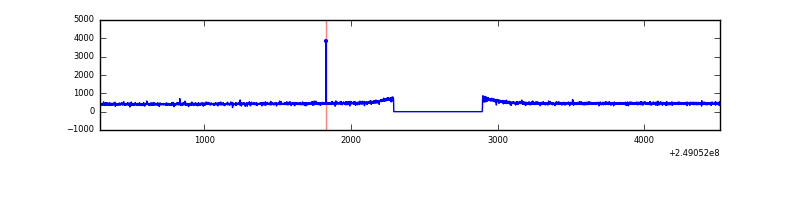 |
| D | 4231 | 3627 | 174 | 174 | 4.11% | 4.80% |  |
Top three noisy pixels from each quadrant. If the there are fewer than three noisy pixels in the level2.evt file, extra rows are filled as -1
| Pixel properties | Quadrant properties | ||||||
|---|---|---|---|---|---|---|---|
| Quadrant | DetID | PixID | Counts | Sigma | Mean | Median | Sigma |
| A | 1 | 162 | 189610 | 2120.39 | 435 | 424 | 89.2 |
| A | 8 | 5 | 136926 | 1529.91 | 435 | 424 | 89.2 |
| A | 1 | 178 | 111905 | 1249.48 | 435 | 424 | 89.2 |
| B | 4 | 239 | 334800 | 3959.02 | 434 | 421 | 84.5 |
| B | 0 | 219 | 41491 | 486.27 | 434 | 421 | 84.5 |
| B | 15 | 204 | 25757 | 299.98 | 434 | 421 | 84.5 |
| C | 12 | 4 | 4438 | 40.89 | 418 | 418 | 98.3 |
| C | 8 | 128 | 3338 | 29.7 | 418 | 418 | 98.3 |
| C | 13 | 61 | 3157 | 27.86 | 418 | 418 | 98.3 |
| D | 1 | 52 | 767465 | 8119.23 | 391 | 378 | 94.5 |
| D | 8 | 195 | 91468 | 964.14 | 391 | 378 | 94.5 |
| D | 5 | 222 | 76799 | 808.88 | 391 | 378 | 94.5 |
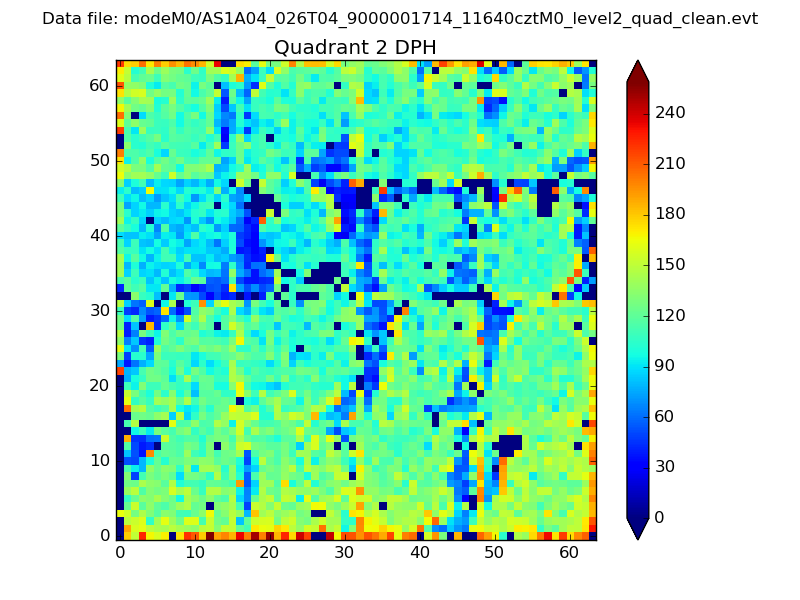
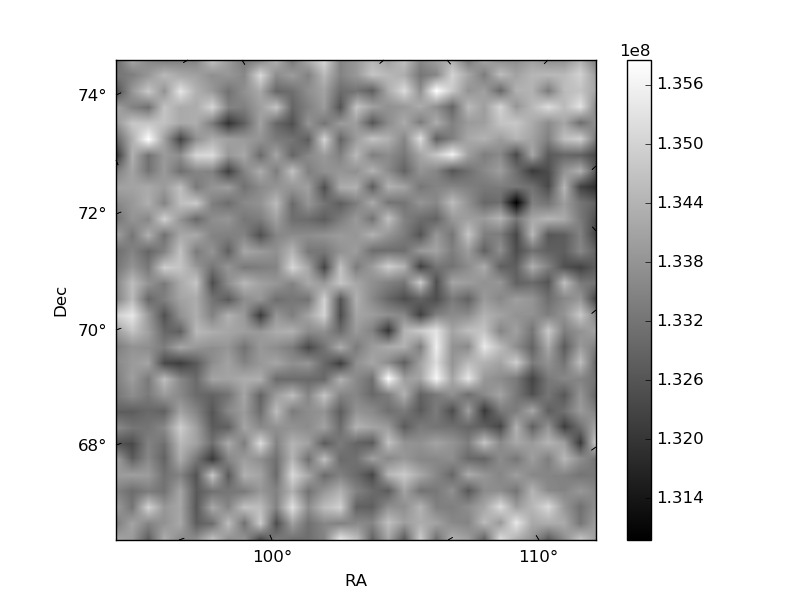
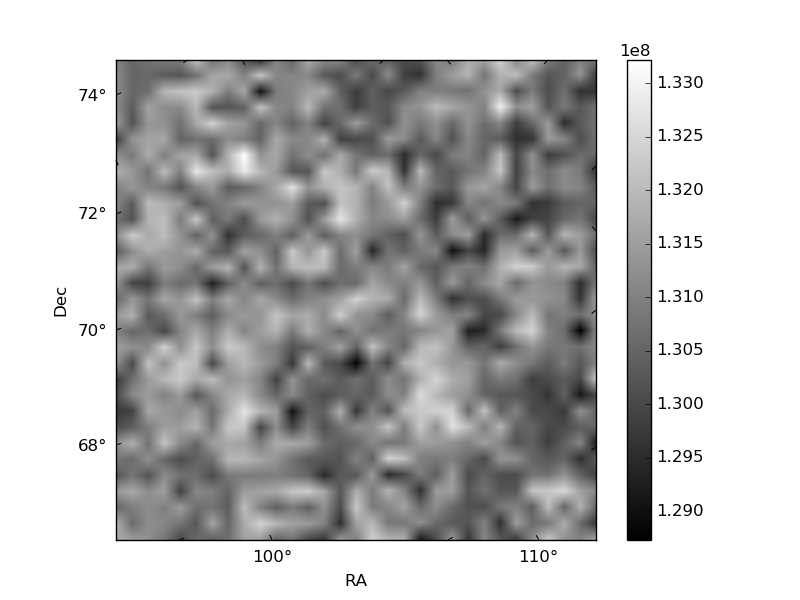
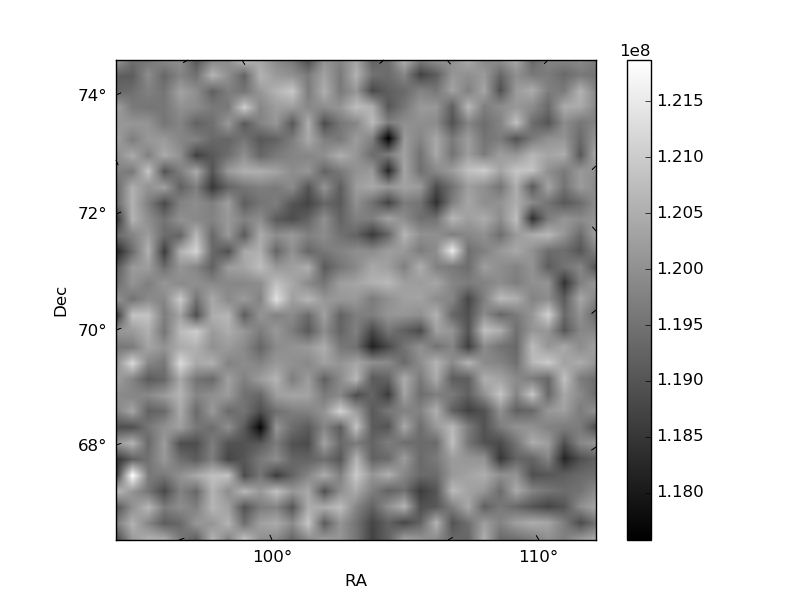
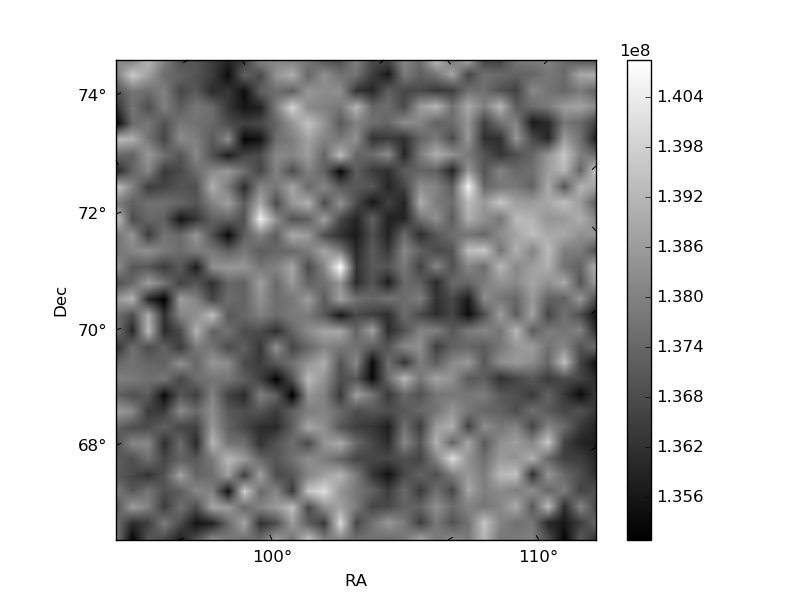
Histogram calculated using DETX and DETY for each event in the final _common_clean file
| Quadrant A | 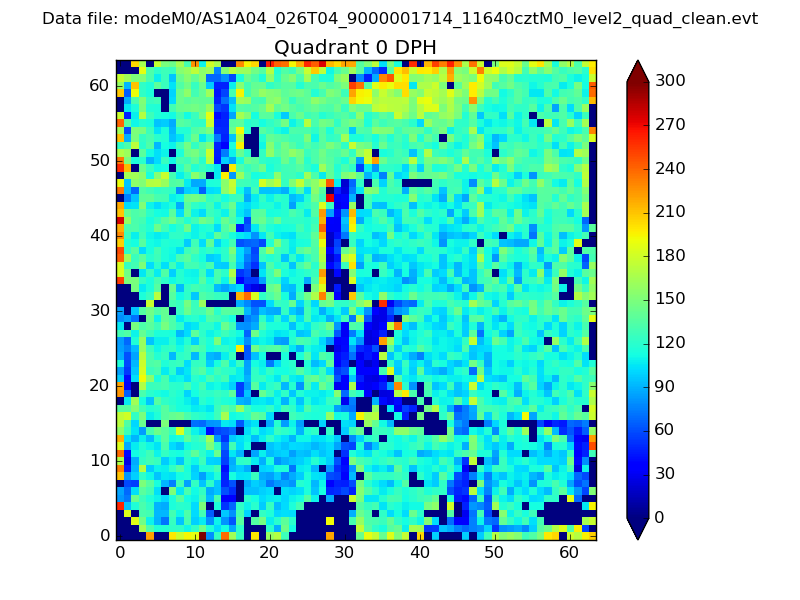 |
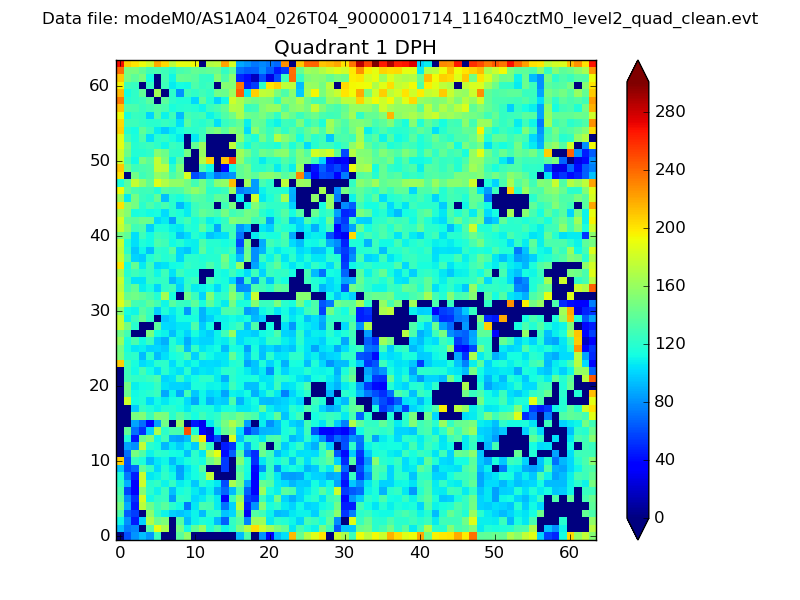 |
Quadrant B |
|---|---|---|---|
| Quadrant D | 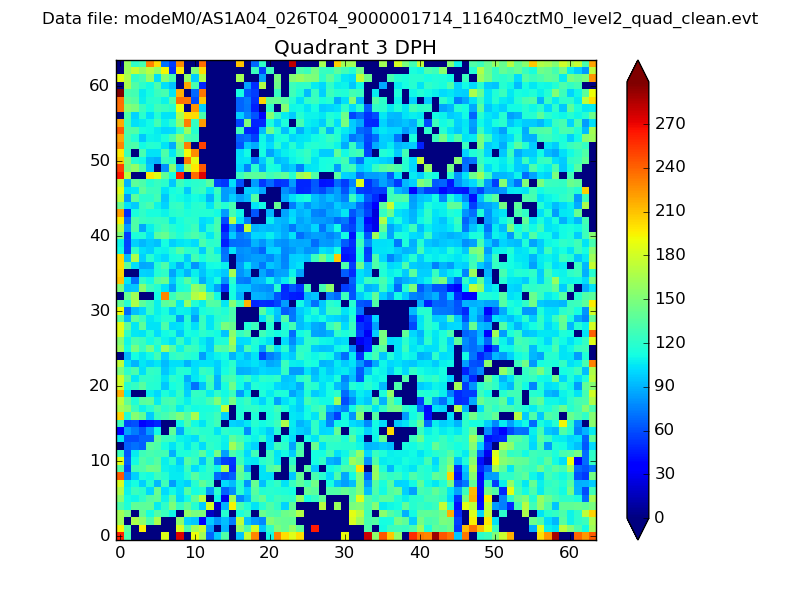 |
 |
Quadrant C |
| Plot type | Count rate plots | Images |
|---|---|---|
| Comparison with Poisson distribution Blue bars denote a histogram of data divided into 1 sec bins. Red curve is a Poisson curve with rate = median count rate of data. |
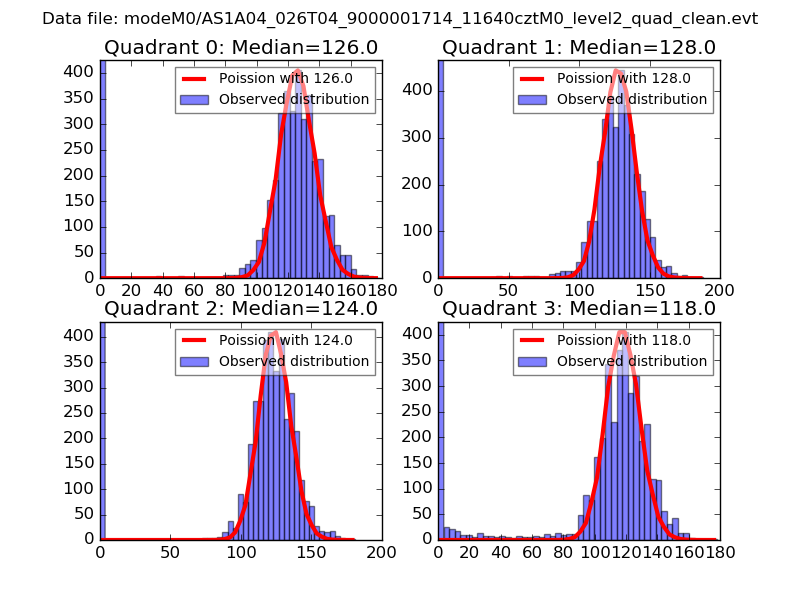 |
 |
| Quadrant-wise count rates Data is divided into 100 sec bins |
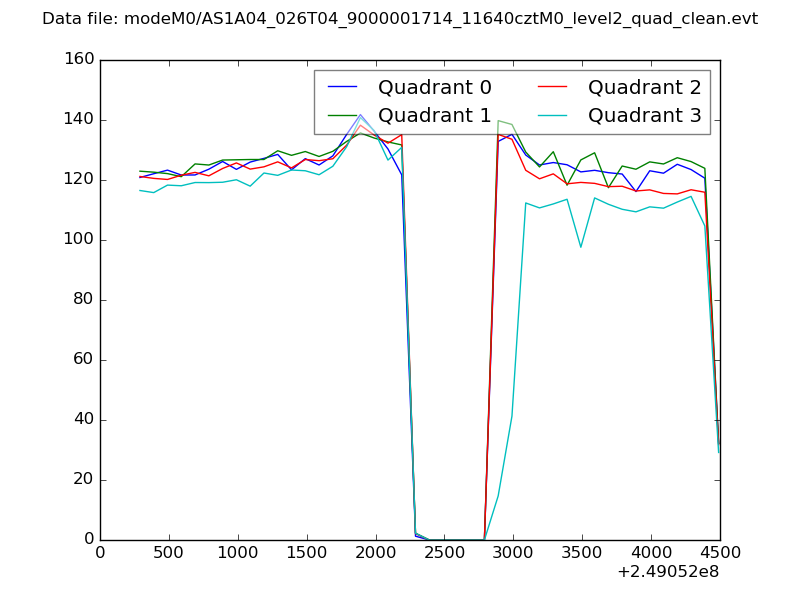 |
|
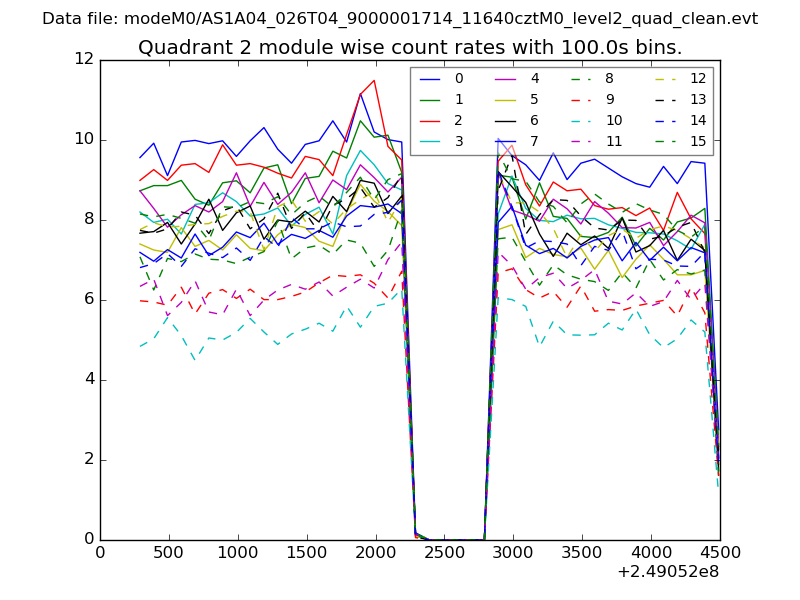
| Module-wise count rates for Quadrant A Data is divided into 100 sec bins |
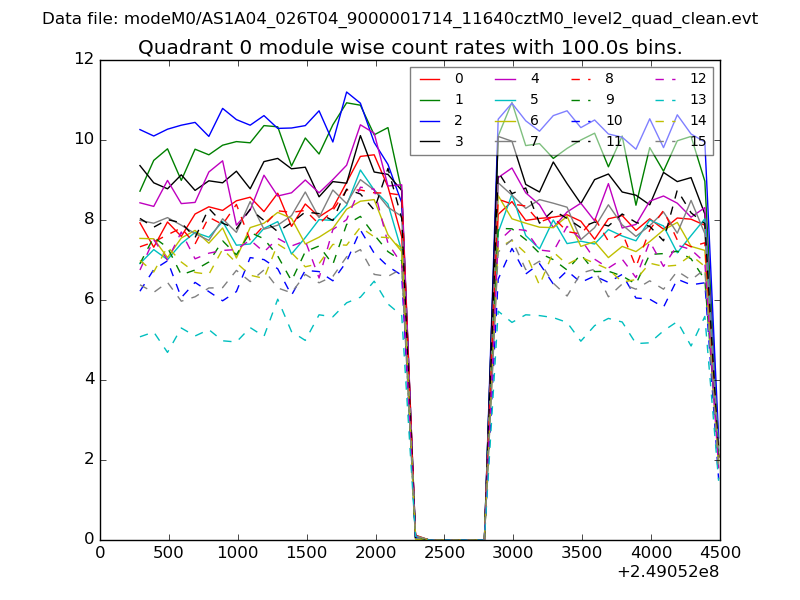 |
 |
| Module-wise count rates for Quadrant B Data is divided into 100 sec bins |
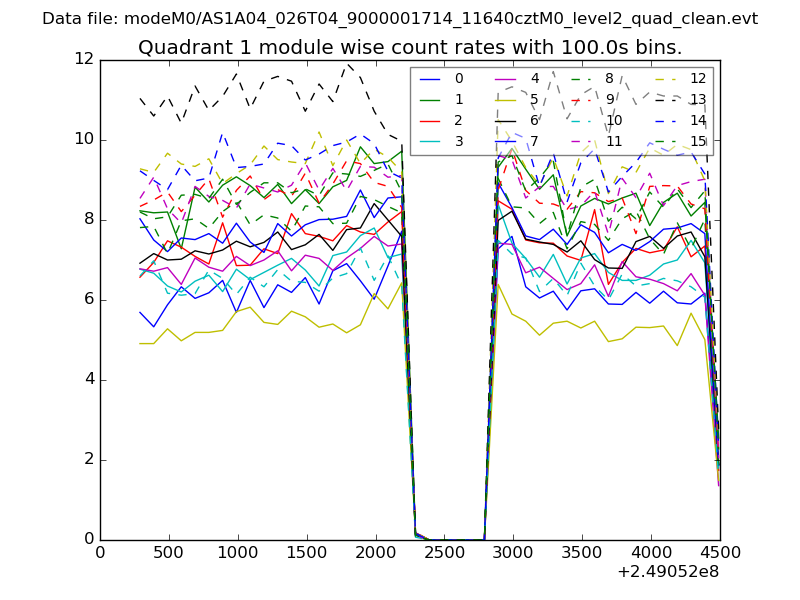 |
 |
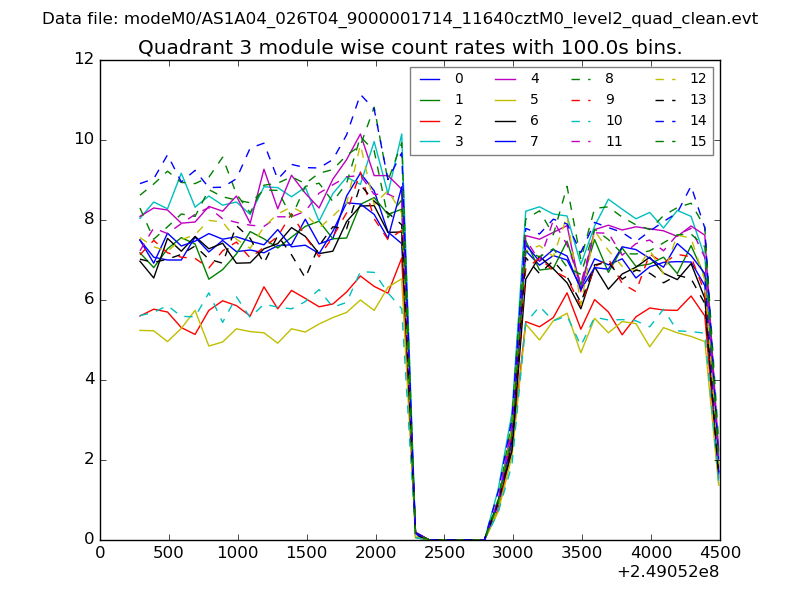
| Module-wise count rates for Quadrant C Data is divided into 100 sec bins |
 |
 |
| Module-wise count rates for Quadrant D Data is divided into 100 sec bins |
 |
 |
| Parameter | Plot |
|---|---|
| CZT HV Monitor | 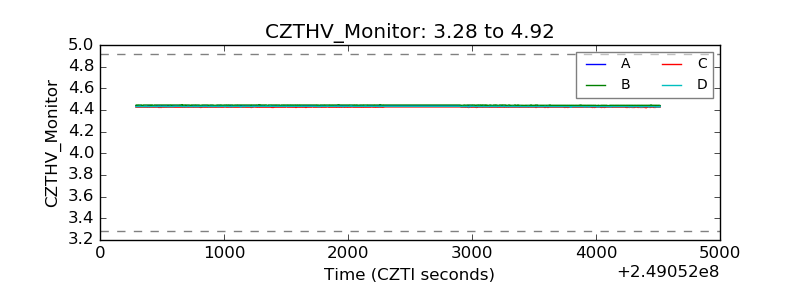 |
| D_VDD | 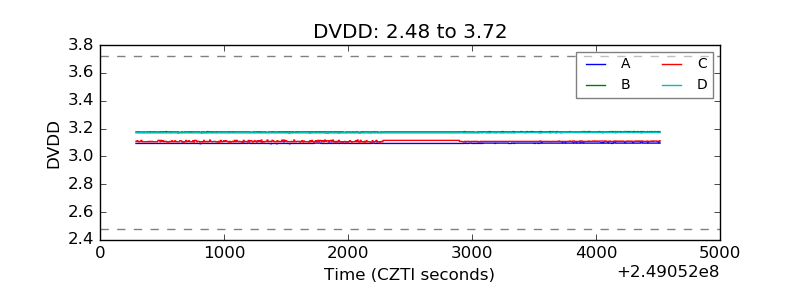 |
| Temperature 1 | 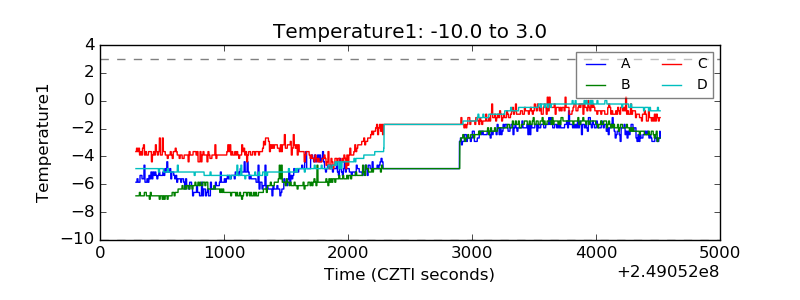 |
| Veto HV Monitor | 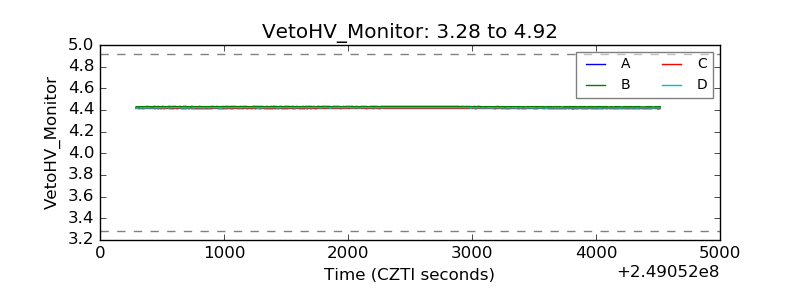 |
| Veto LLD | 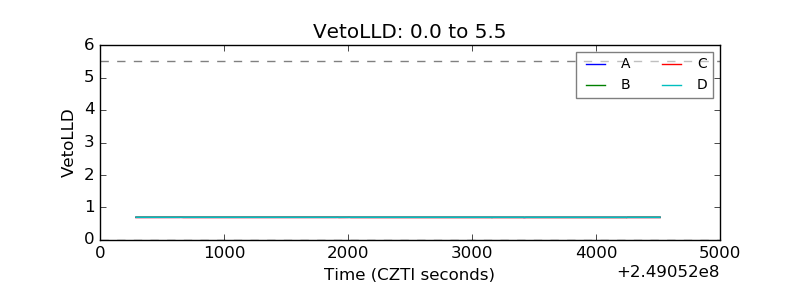 |
| Alpha Counter | 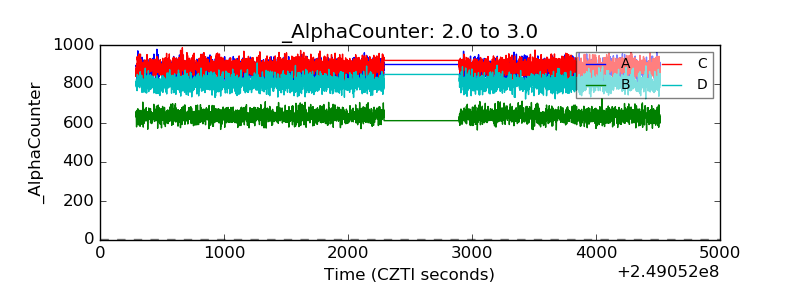 |
| _CPM_Rate | 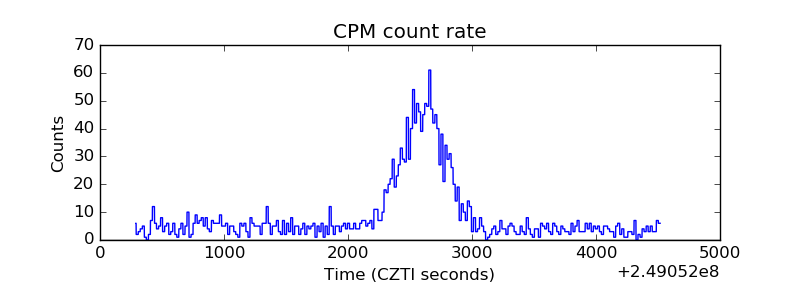 |
| CZT Counter | 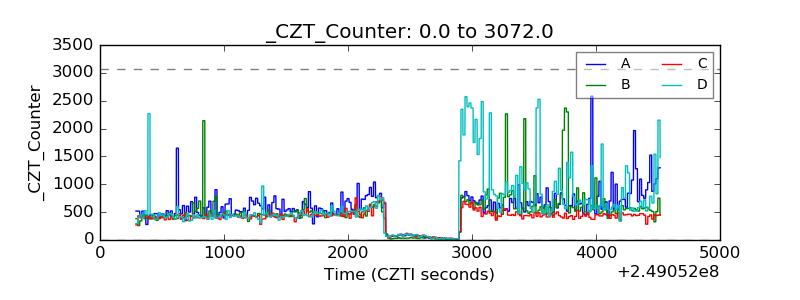 |
| +2.5 Volts monitor |  |
| +5 Volts monitor |  |
| _ROLL_ROT | 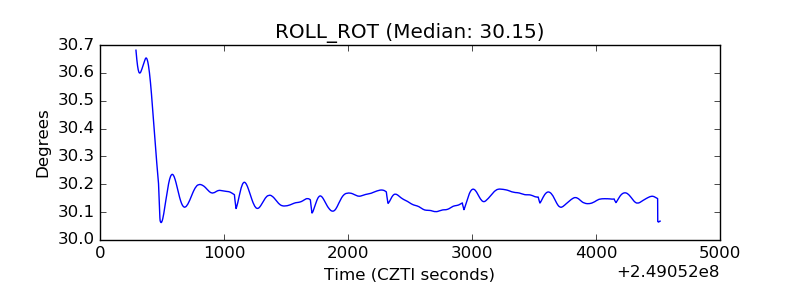 |
| _Roll_DEC | 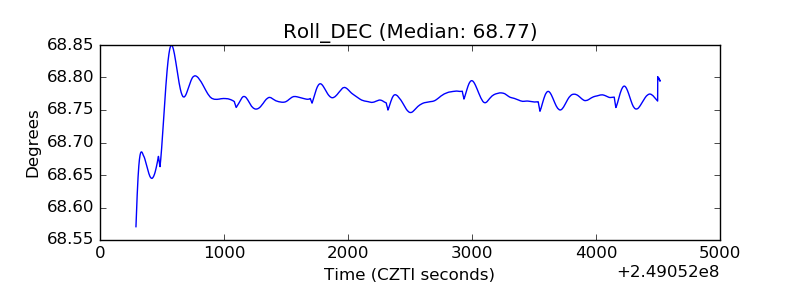 |
| _Roll_RA | 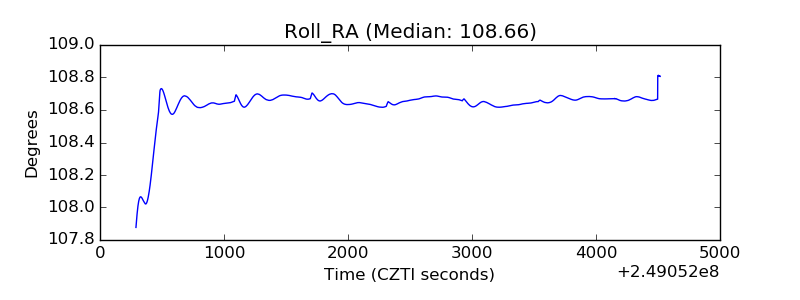 |
| Veto Counter | 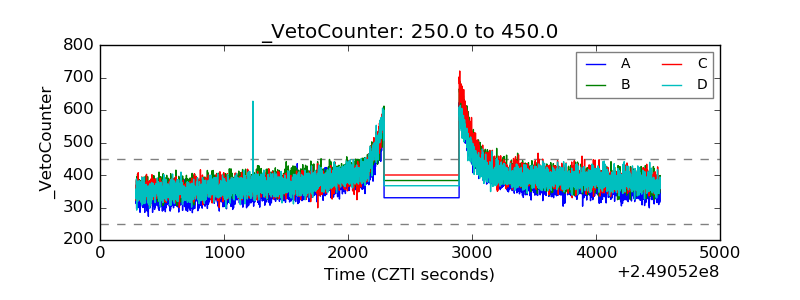 |