| Param | Original file | Final file |
|---|---|---|
| Filename | modeM0/AS1A04_026T04_9000001714_11641cztM0_level2.evt | modeM0/AS1A04_026T04_9000001714_11641cztM0_level2_quad_clean.evt |
| Size (bytes) | 687,608,640 | 129,384,000 |
| Size | 655.8 MB | 123.4 MB |
| Events in quadrant A | 4,573,350 | 888,445 |
| Events in quadrant B | 4,452,615 | 892,561 |
| Events in quadrant C | 3,191,840 | 864,683 |
| Events in quadrant D | 8,118,868 | 770,432 |
| Mode M9 | |||
|---|---|---|---|
| Quadrant | BADHDUFLAG | Total packets | Discarded packets |
| A | 0 | 2 | 0 |
| B | 0 | 2 | 0 |
| C | 0 | 2 | 0 |
| D | 0 | 2 | 0 |
| Mode SS | |||
|---|---|---|---|
| Quadrant | BADHDUFLAG | Total packets | Discarded packets |
| A | 0 | 146 | 0 |
| B | 0 | 146 | 0 |
| C | 0 | 146 | 0 |
| D | 0 | 146 | 0 |
| Mode M0 | |||
|---|---|---|---|
| Quadrant | BADHDUFLAG | Total packets | Discarded packets |
| A | 0 | 18600 | 2 |
| B | 0 | 17997 | 1 |
| C | 0 | 14712 | 1 |
| D | 0 | 28994 | 1 |
| Quadrant | Total seconds | Saturated seconds | Saturation percentage |
|---|---|---|---|
| A | 7209 | 202 | 2.802053% |
| B | 7209 | 365 | 5.063116% |
| C | 7209 | 84 | 1.165210% |
| D | 7209 | 1297 | 17.991400% |
Noise dominated data is calculated using 1-second bins in cleaned event files. If a bin has >2000 counts, and if more than 50% of those come from <1% of pixels, then it is considered to be noise-dominated and hence unusable.
| Quadrant | # 1 sec bins | Bins with >0 counts | Bins with >2000 counts | High rate bins dominated by noise | Noise dominated (total time) | Noise dominated (detector-on time) | Marked lightcurve |
|---|---|---|---|---|---|---|---|
| A | 7375 | 7211 | 17 | 17 | 0.23% | 0.24% |  |
| B | 7375 | 7211 | 125 | 125 | 1.69% | 1.73% |  |
| C | 7375 | 7211 | 0 | 0 | 0.00% | 0.00% | 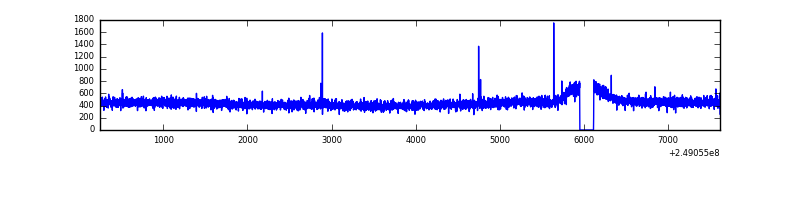 |
| D | 7375 | 7211 | 1278 | 1278 | 17.33% | 17.72% |  |
Top three noisy pixels from each quadrant. If the there are fewer than three noisy pixels in the level2.evt file, extra rows are filled as -1
| Pixel properties | Quadrant properties | ||||||
|---|---|---|---|---|---|---|---|
| Quadrant | DetID | PixID | Counts | Sigma | Mean | Median | Sigma |
| A | 1 | 162 | 339643 | 1963.04 | 845 | 826 | 172.6 |
| A | 8 | 5 | 335280 | 1937.76 | 845 | 826 | 172.6 |
| A | 1 | 178 | 206702 | 1192.8 | 845 | 826 | 172.6 |
| B | 4 | 239 | 940744 | 5819.8 | 837 | 815 | 161.5 |
| B | 0 | 219 | 107833 | 662.63 | 837 | 815 | 161.5 |
| B | 15 | 204 | 87883 | 539.1 | 837 | 815 | 161.5 |
| C | 14 | 234 | 7220 | 33.82 | 815 | 818 | 189.3 |
| C | 13 | 61 | 6049 | 27.63 | 815 | 818 | 189.3 |
| C | 8 | 128 | 3373 | 13.5 | 815 | 818 | 189.3 |
| D | 1 | 52 | 3281033 | 17722.84 | 774 | 750 | 185.1 |
| D | 10 | 253 | 487747 | 2631.17 | 774 | 750 | 185.1 |
| D | 8 | 195 | 353976 | 1908.42 | 774 | 750 | 185.1 |
Histogram calculated using DETX and DETY for each event in the final _common_clean file
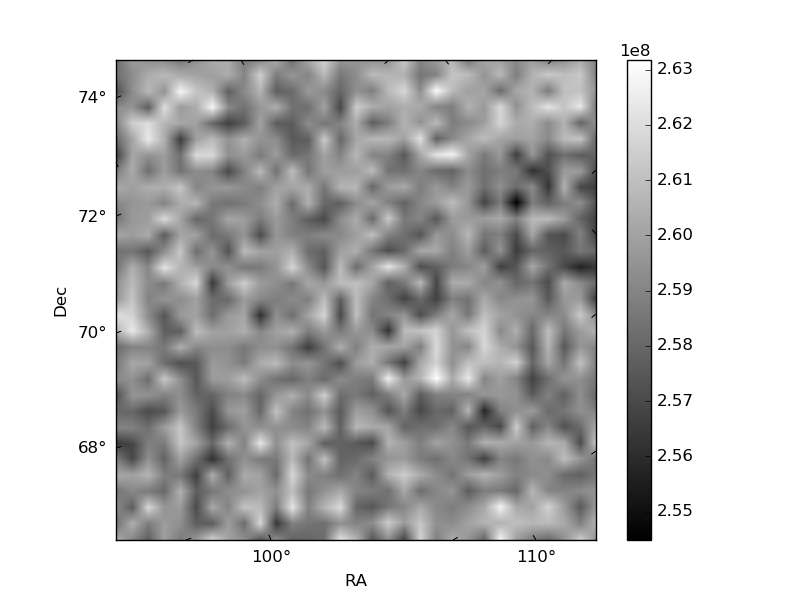
| Quadrant A | 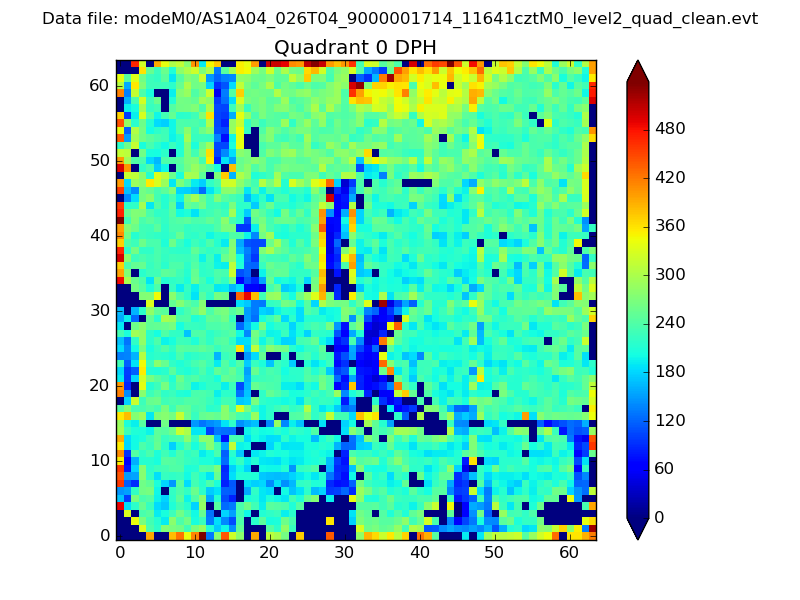 |
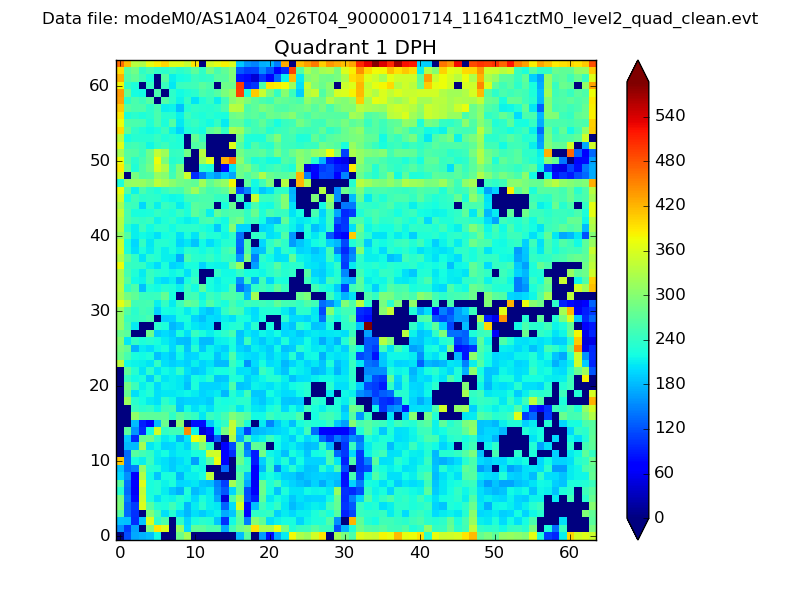 |
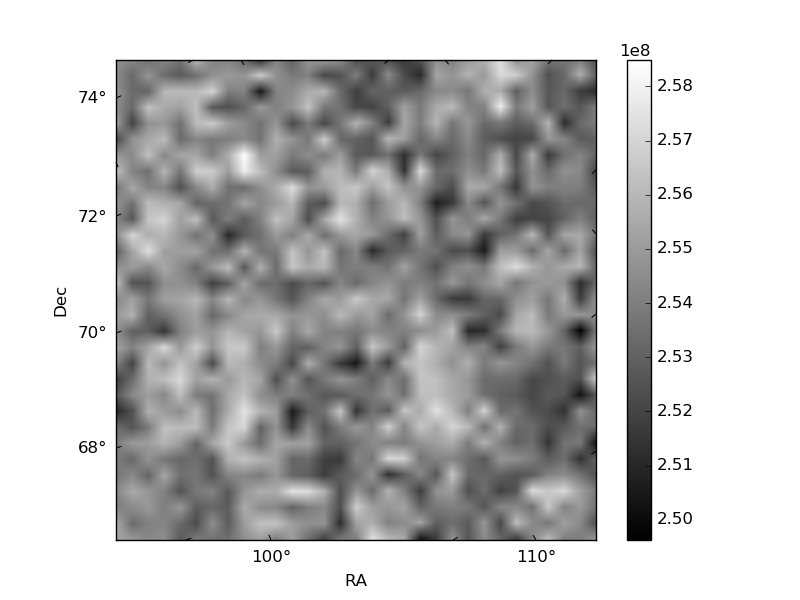
Quadrant B |
|---|---|---|---|
| Quadrant D | 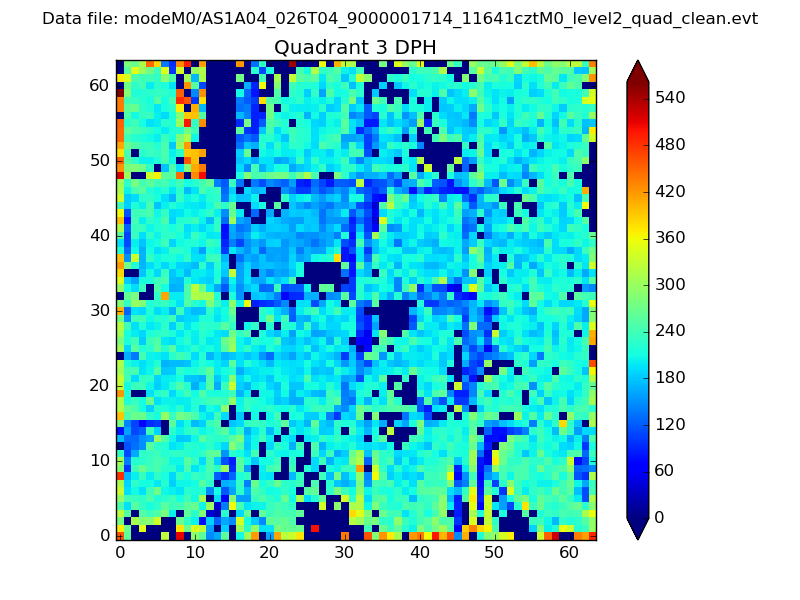 |
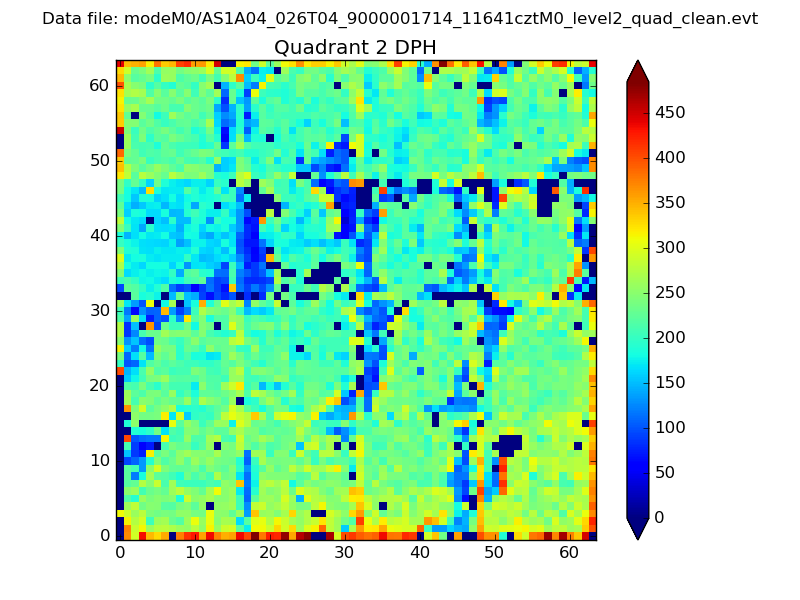 |
Quadrant C |
| Plot type | Count rate plots | Images |
|---|---|---|
| Comparison with Poisson distribution Blue bars denote a histogram of data divided into 1 sec bins. Red curve is a Poisson curve with rate = median count rate of data. |
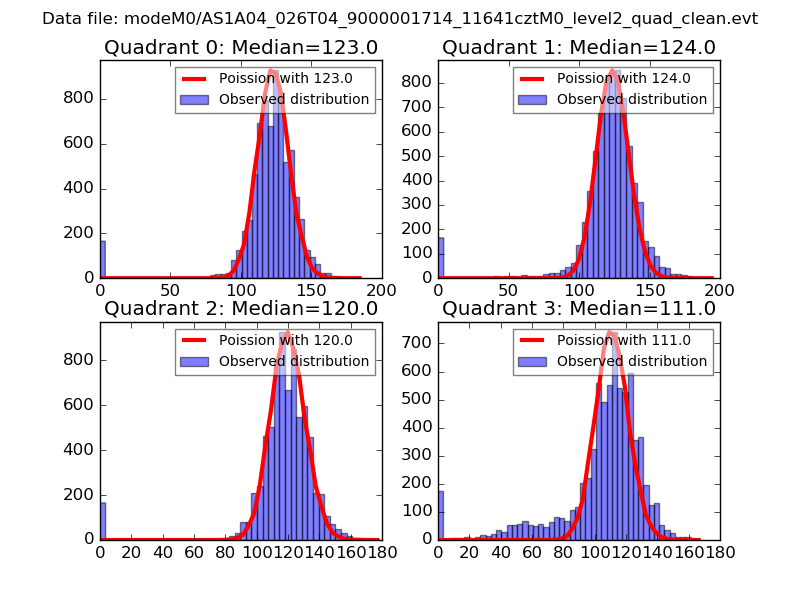 |
 |
| Quadrant-wise count rates Data is divided into 100 sec bins |
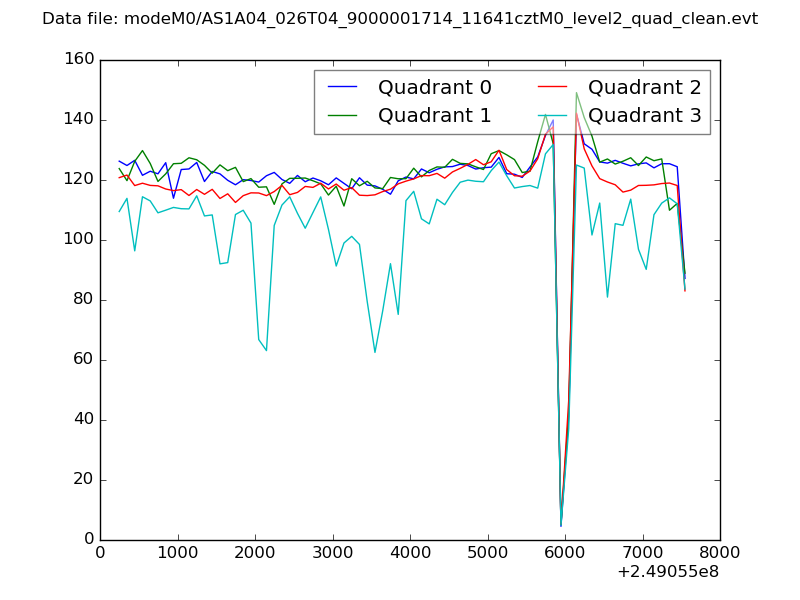 |
|
| Module-wise count rates for Quadrant A Data is divided into 100 sec bins |
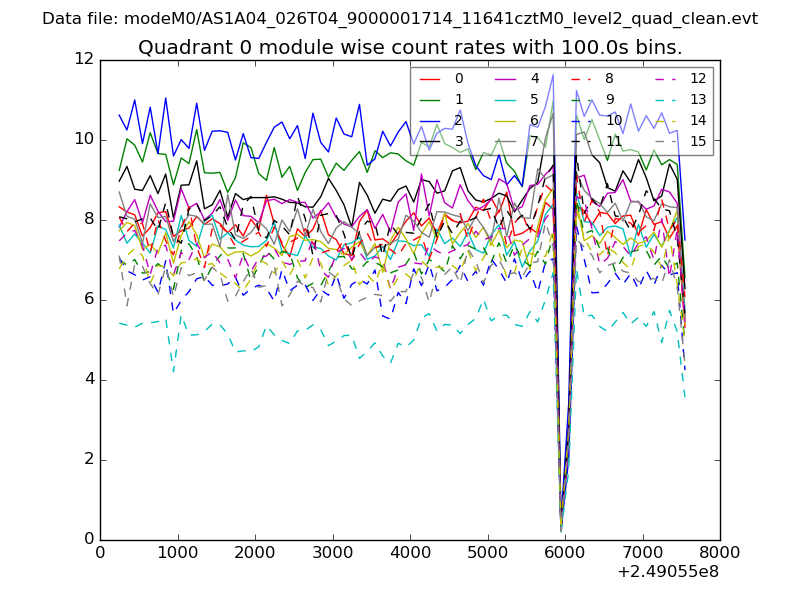 |
 |
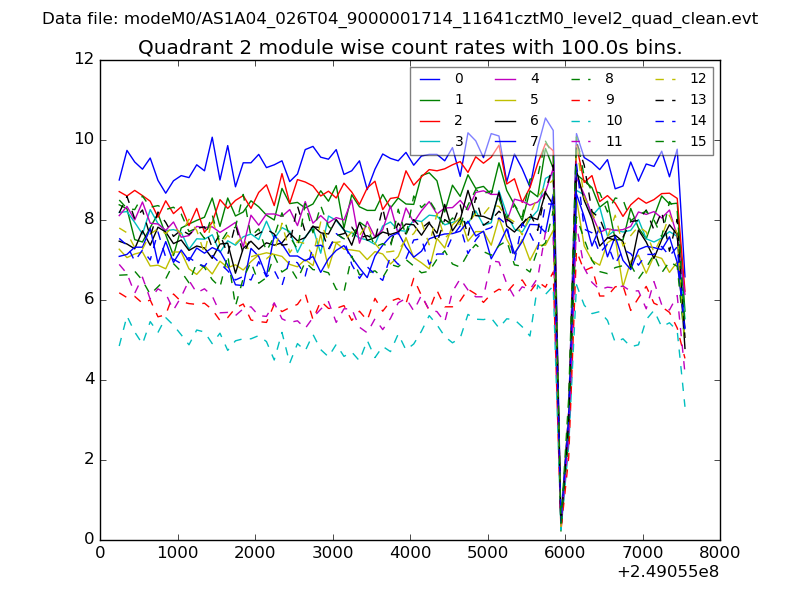
| Module-wise count rates for Quadrant B Data is divided into 100 sec bins |
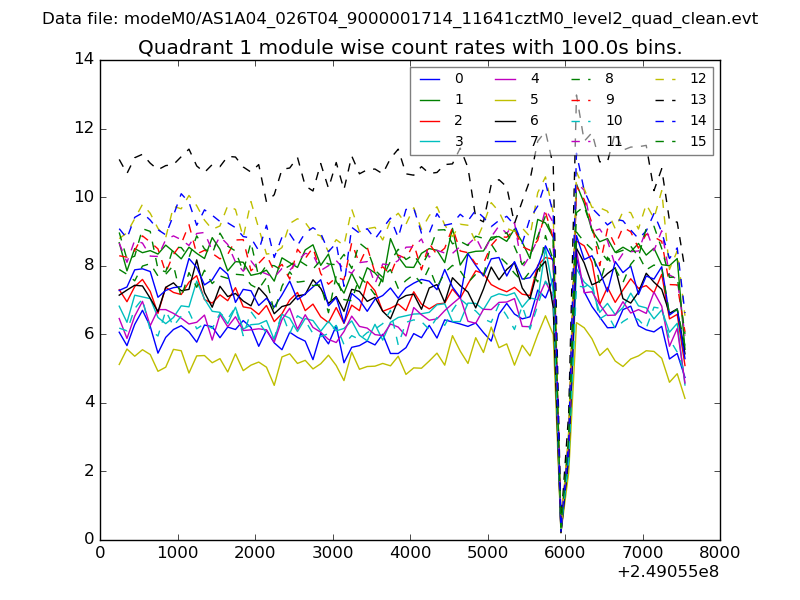 |
 |
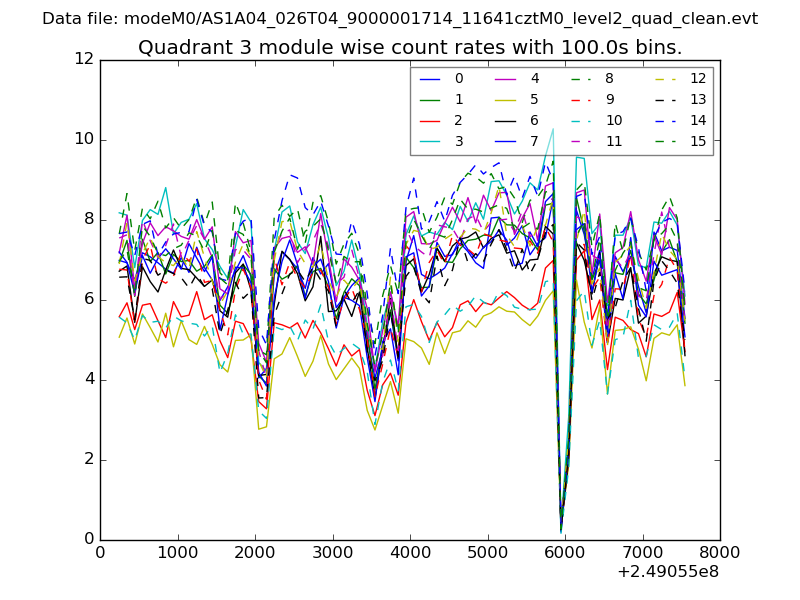
| Module-wise count rates for Quadrant C Data is divided into 100 sec bins |
 |
 |
| Module-wise count rates for Quadrant D Data is divided into 100 sec bins |
 |
 |
| Parameter | Plot |
|---|---|
| CZT HV Monitor | 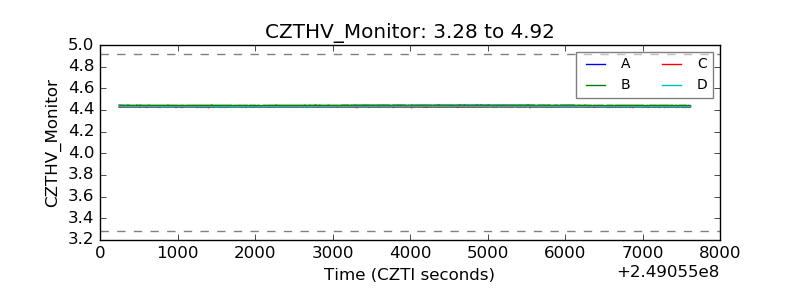 |
| D_VDD | 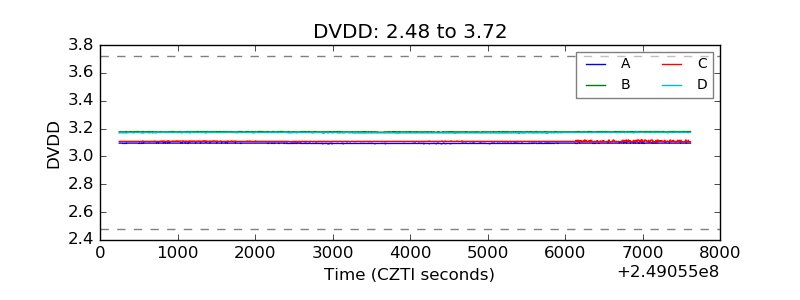 |
| Temperature 1 | 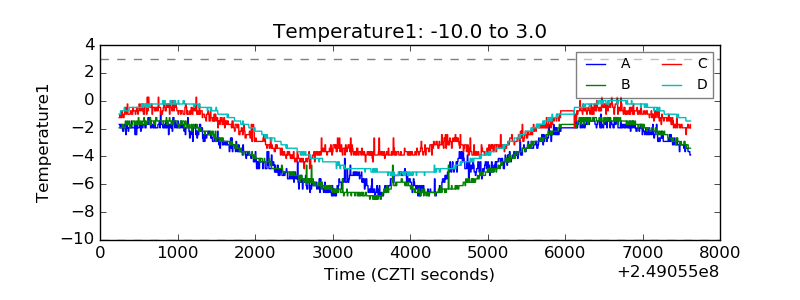 |
| Veto HV Monitor | 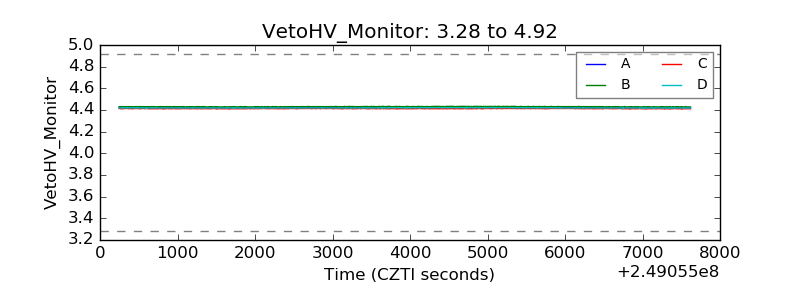 |
| Veto LLD | 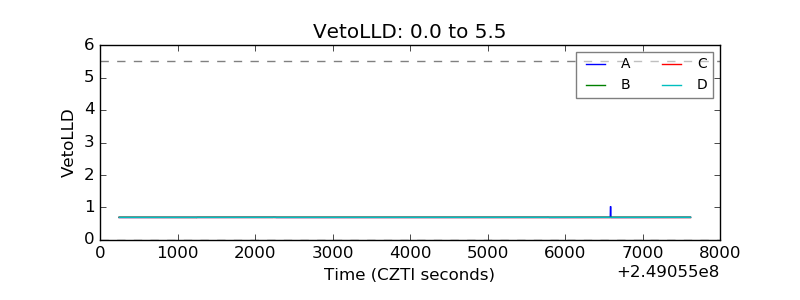 |
| Alpha Counter | 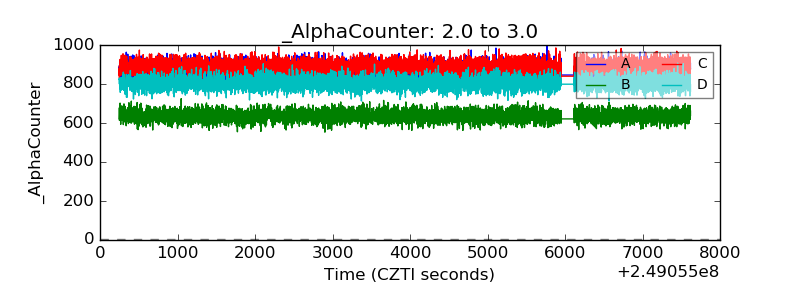 |
| _CPM_Rate | 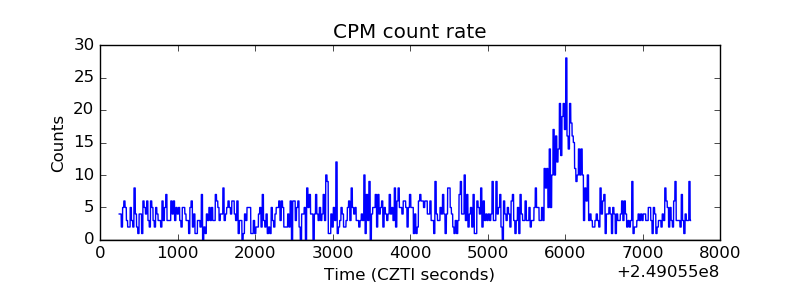 |
| CZT Counter | 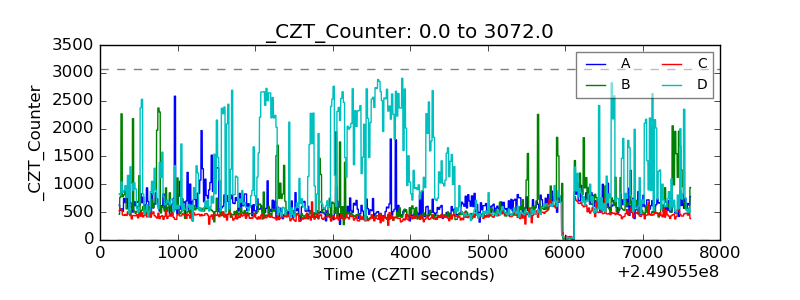 |
| +2.5 Volts monitor |  |
| +5 Volts monitor | 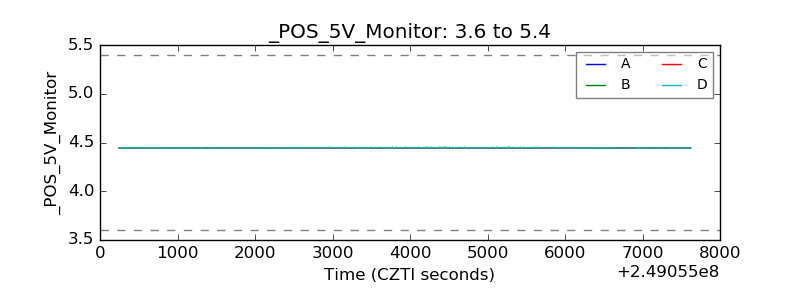 |
| _ROLL_ROT | 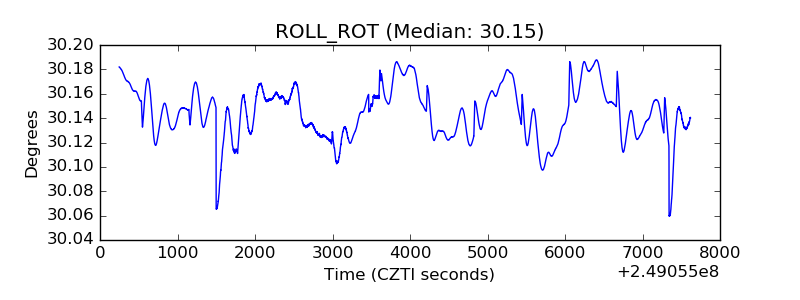 |
| _Roll_DEC | 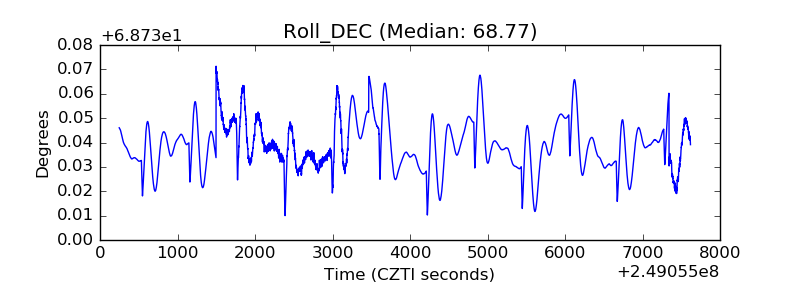 |
| _Roll_RA | 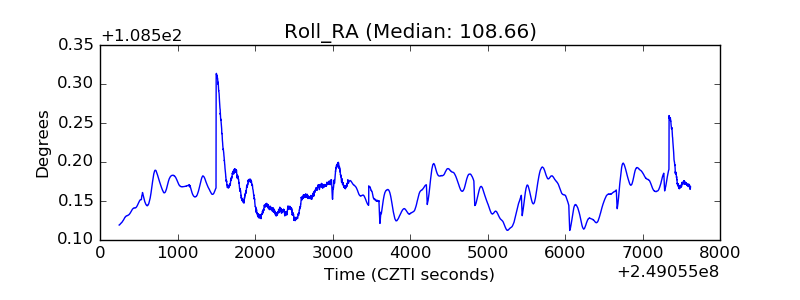 |
| Veto Counter | 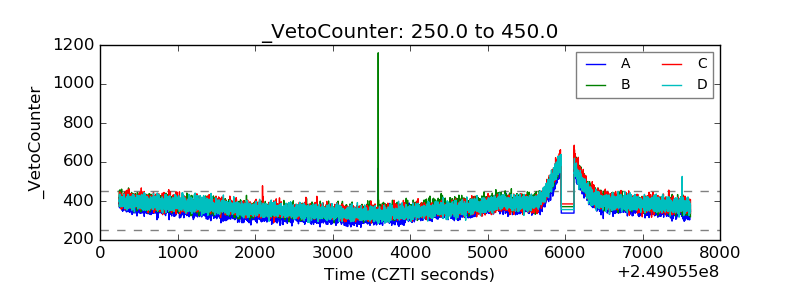 |