| Param | Original file | Final file |
|---|---|---|
| Filename | modeM0/AS1A04_026T04_9000001714_11643cztM0_level2.evt | modeM0/AS1A04_026T04_9000001714_11643cztM0_level2_quad_clean.evt |
| Size (bytes) | 504,195,840 | 109,431,360 |
| Size | 480.8 MB | 104.4 MB |
| Events in quadrant A | 4,509,121 | 733,724 |
| Events in quadrant B | 3,730,340 | 735,398 |
| Events in quadrant C | 2,665,763 | 724,365 |
| Events in quadrant D | 3,949,632 | 693,701 |
| Mode M9 | |||
|---|---|---|---|
| Quadrant | BADHDUFLAG | Total packets | Discarded packets |
| A | 0 | 5 | 0 |
| B | 0 | 5 | 0 |
| C | 0 | 5 | 0 |
| D | 0 | 5 | 0 |
| Mode SS | |||
|---|---|---|---|
| Quadrant | BADHDUFLAG | Total packets | Discarded packets |
| A | 0 | 124 | 0 |
| B | 0 | 124 | 0 |
| C | 0 | 124 | 0 |
| D | 0 | 124 | 0 |
| Mode M0 | |||
|---|---|---|---|
| Quadrant | BADHDUFLAG | Total packets | Discarded packets |
| A | 0 | 17703 | 2 |
| B | 0 | 15263 | 1 |
| C | 0 | 12372 | 1 |
| D | 0 | 16000 | 1 |
| Quadrant | Total seconds | Saturated seconds | Saturation percentage |
|---|---|---|---|
| A | 6115 | 222 | 3.630417% |
| B | 6115 | 273 | 4.464432% |
| C | 6115 | 11 | 0.179886% |
| D | 6115 | 168 | 2.747343% |
Noise dominated data is calculated using 1-second bins in cleaned event files. If a bin has >2000 counts, and if more than 50% of those come from <1% of pixels, then it is considered to be noise-dominated and hence unusable.
| Quadrant | # 1 sec bins | Bins with >0 counts | Bins with >2000 counts | High rate bins dominated by noise | Noise dominated (total time) | Noise dominated (detector-on time) | Marked lightcurve |
|---|---|---|---|---|---|---|---|
| A | 6621 | 6117 | 53 | 53 | 0.80% | 0.87% | 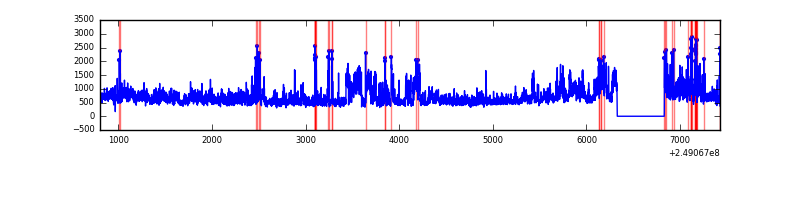 |
| B | 6621 | 6117 | 117 | 117 | 1.77% | 1.91% | 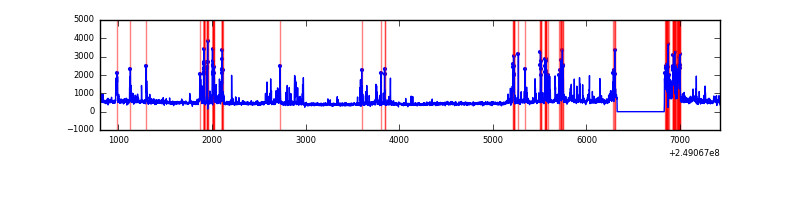 |
| C | 6621 | 6117 | 2 | 2 | 0.03% | 0.03% | 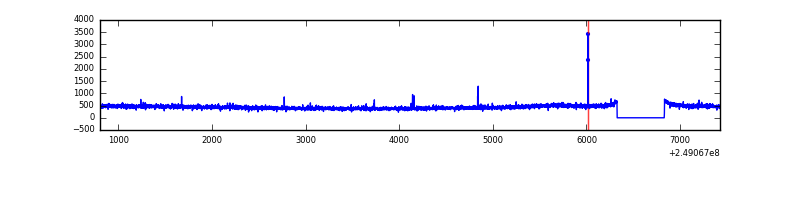 |
| D | 6621 | 6117 | 102 | 102 | 1.54% | 1.67% | 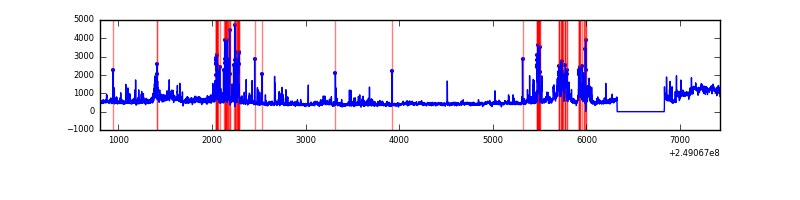 |
Top three noisy pixels from each quadrant. If the there are fewer than three noisy pixels in the level2.evt file, extra rows are filled as -1
| Pixel properties | Quadrant properties | ||||||
|---|---|---|---|---|---|---|---|
| Quadrant | DetID | PixID | Counts | Sigma | Mean | Median | Sigma |
| A | 8 | 5 | 938403 | 6502.97 | 700 | 684 | 144.2 |
| A | 1 | 162 | 304310 | 2105.61 | 700 | 684 | 144.2 |
| A | 1 | 178 | 183596 | 1268.47 | 700 | 684 | 144.2 |
| B | 4 | 239 | 789840 | 5895.67 | 693 | 675 | 133.9 |
| B | 15 | 204 | 87696 | 650.11 | 693 | 675 | 133.9 |
| B | 0 | 219 | 60565 | 447.42 | 693 | 675 | 133.9 |
| C | 15 | 208 | 7928 | 45.5 | 679 | 680 | 159.3 |
| C | 13 | 250 | 6159 | 34.39 | 679 | 680 | 159.3 |
| C | 13 | 61 | 5090 | 27.68 | 679 | 680 | 159.3 |
| D | 13 | 137 | 297759 | 1813.4 | 675 | 653 | 163.8 |
| D | 13 | 104 | 297605 | 1812.46 | 675 | 653 | 163.8 |
| D | 10 | 253 | 272280 | 1657.89 | 675 | 653 | 163.8 |
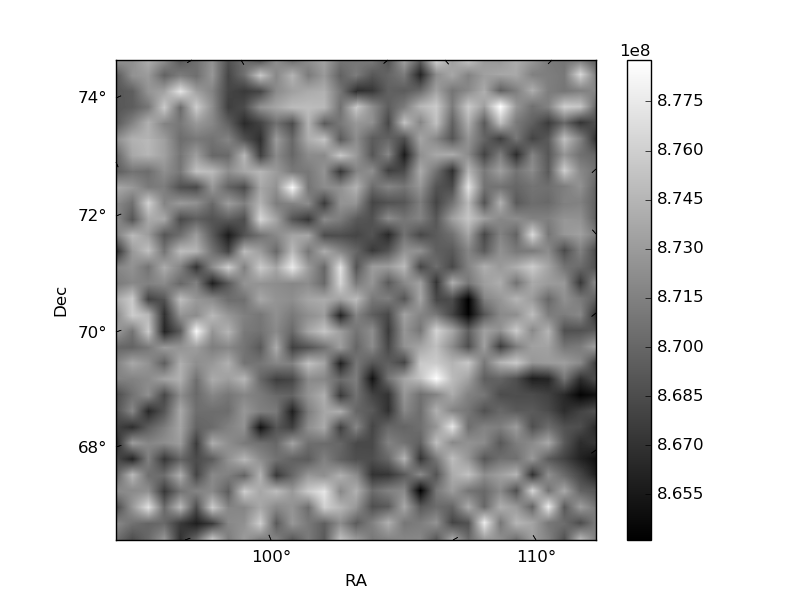
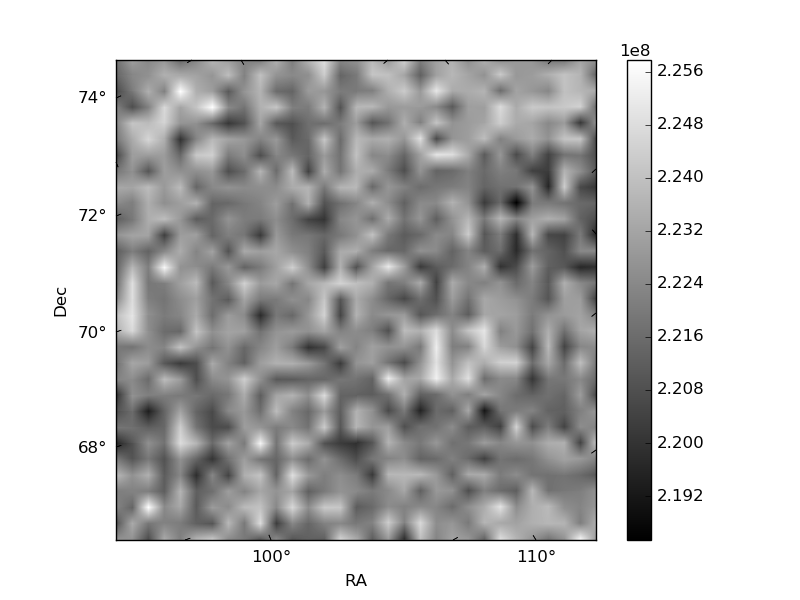
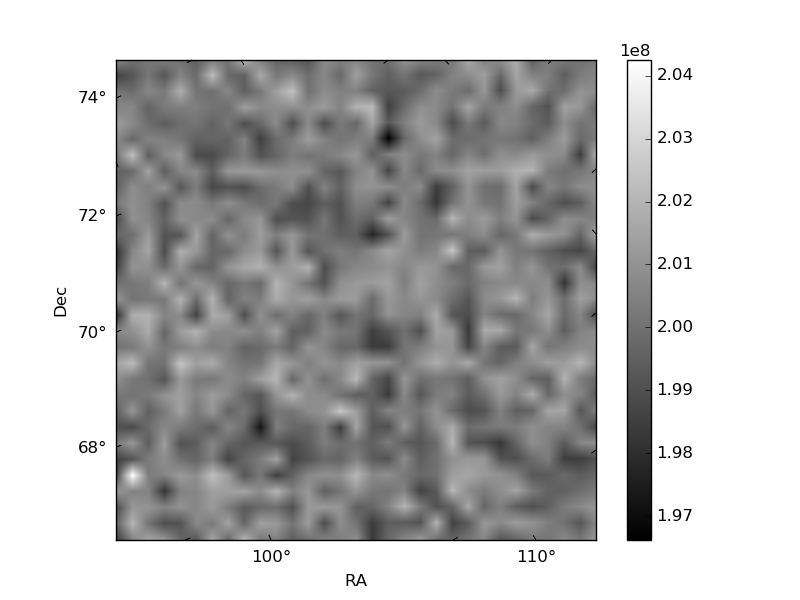
Histogram calculated using DETX and DETY for each event in the final _common_clean file
| Quadrant A | 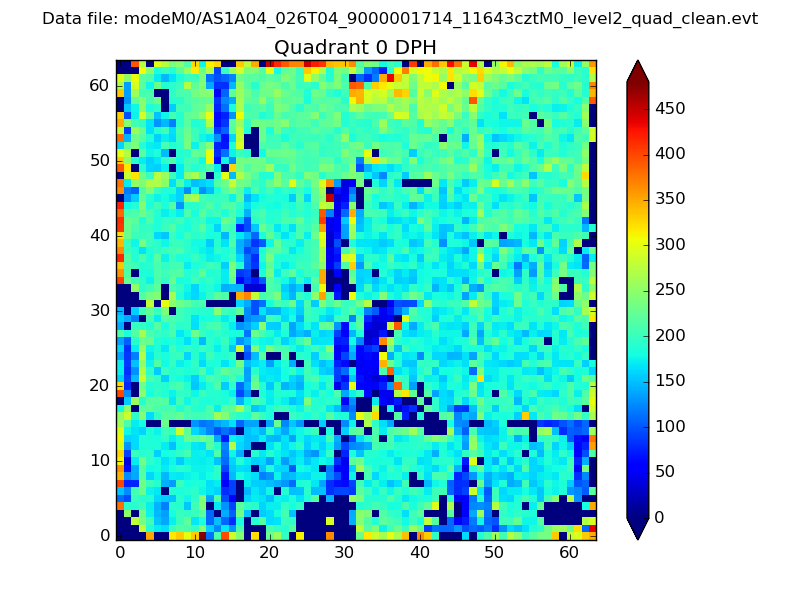 |
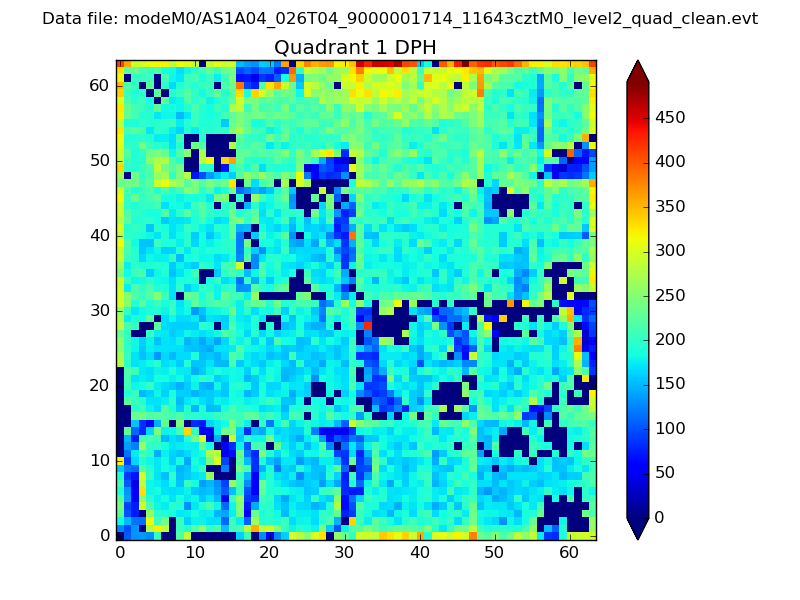 |
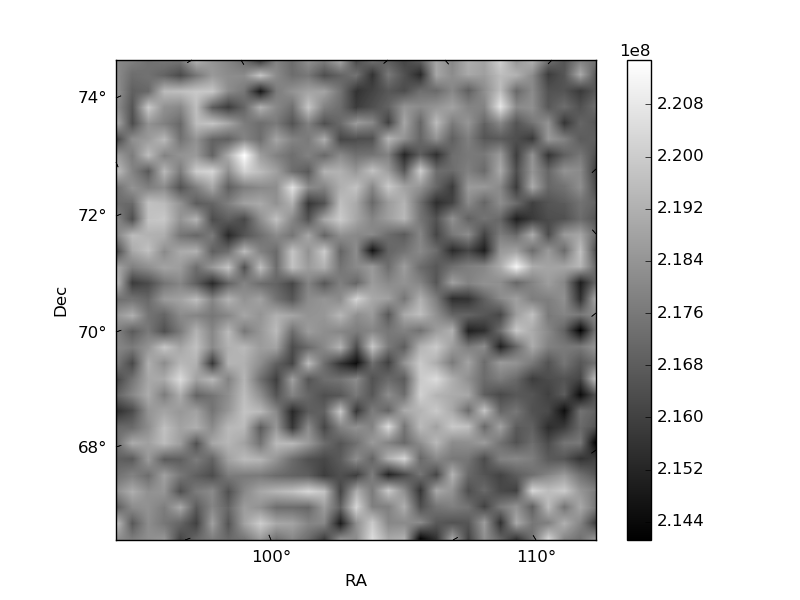
Quadrant B |
|---|---|---|---|
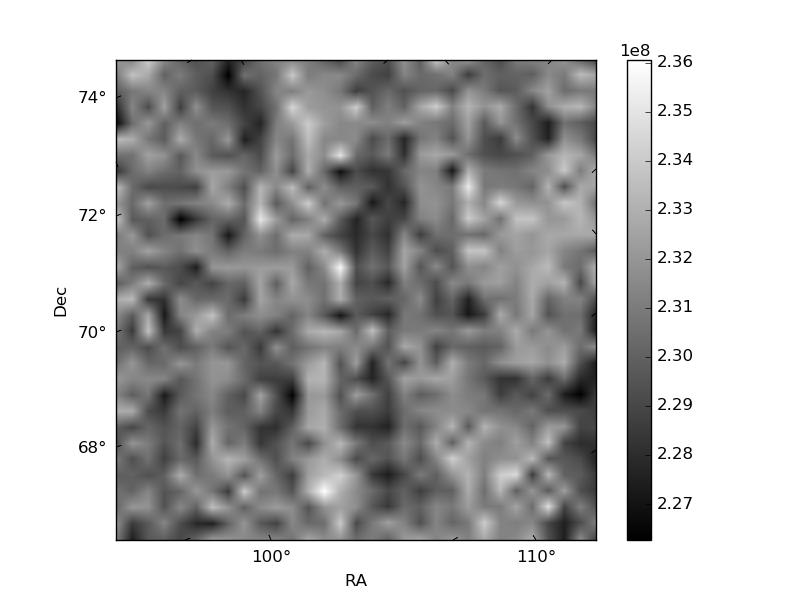
| Quadrant D | 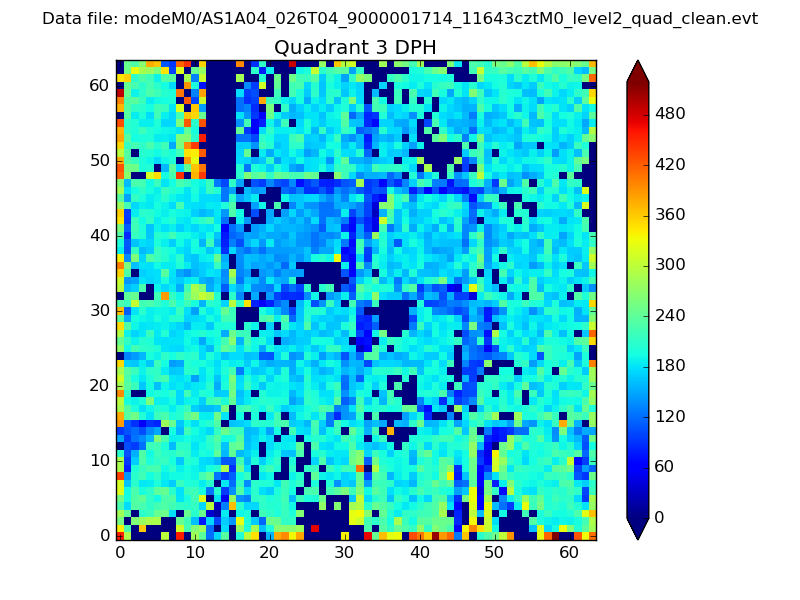 |
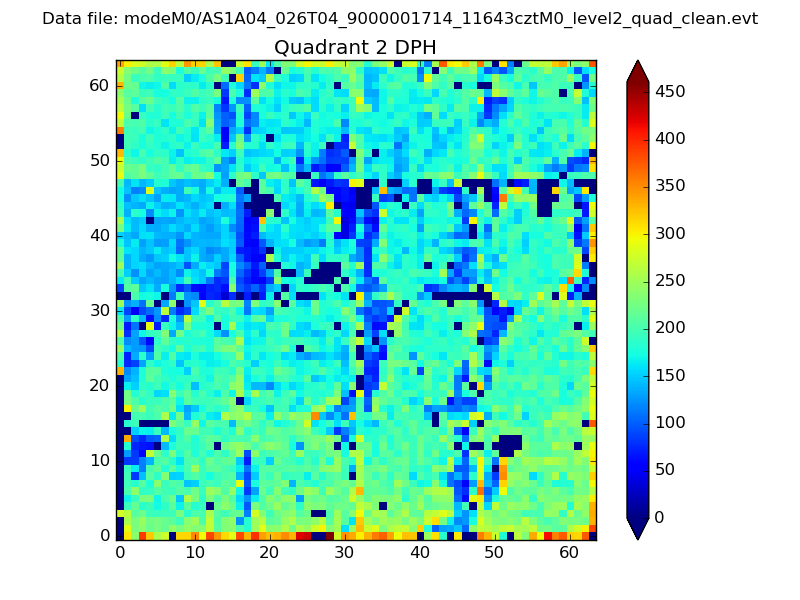 |
Quadrant C |
| Plot type | Count rate plots | Images |
|---|---|---|
| Comparison with Poisson distribution Blue bars denote a histogram of data divided into 1 sec bins. Red curve is a Poisson curve with rate = median count rate of data. |
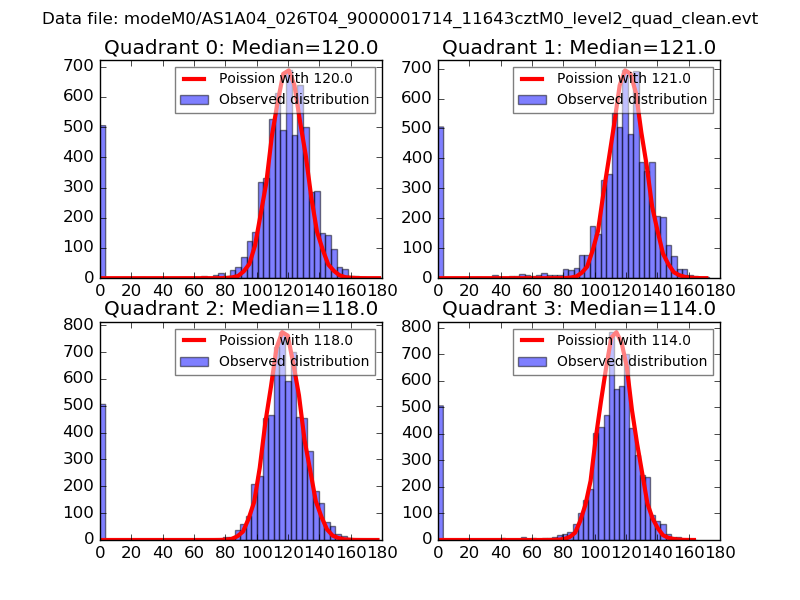 |
 |
| Quadrant-wise count rates Data is divided into 100 sec bins |
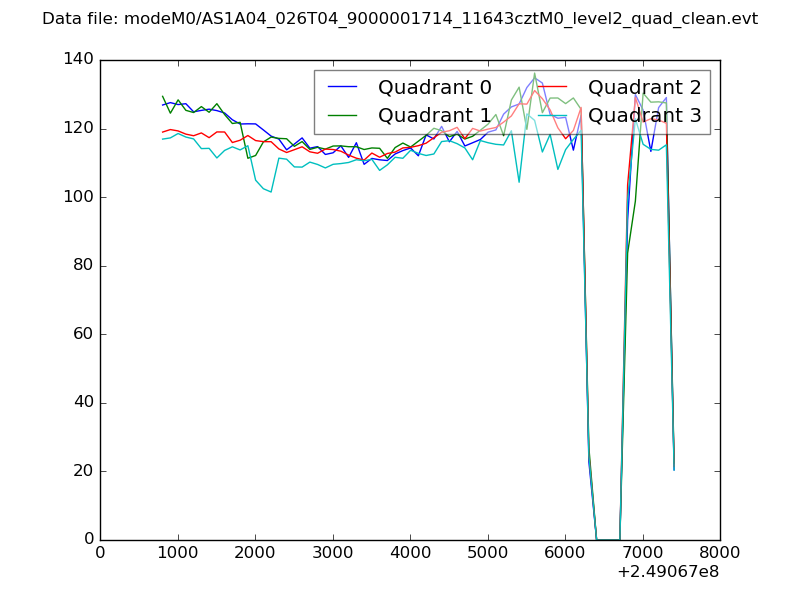 |
|
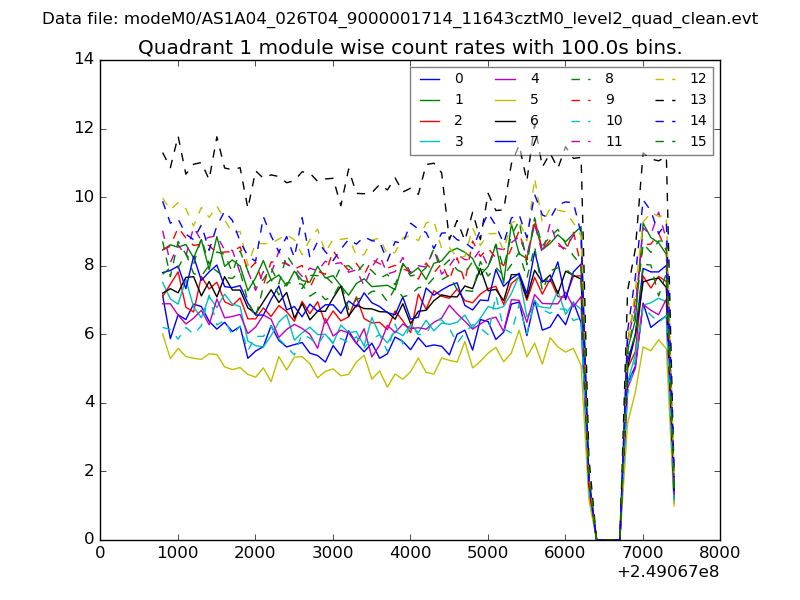
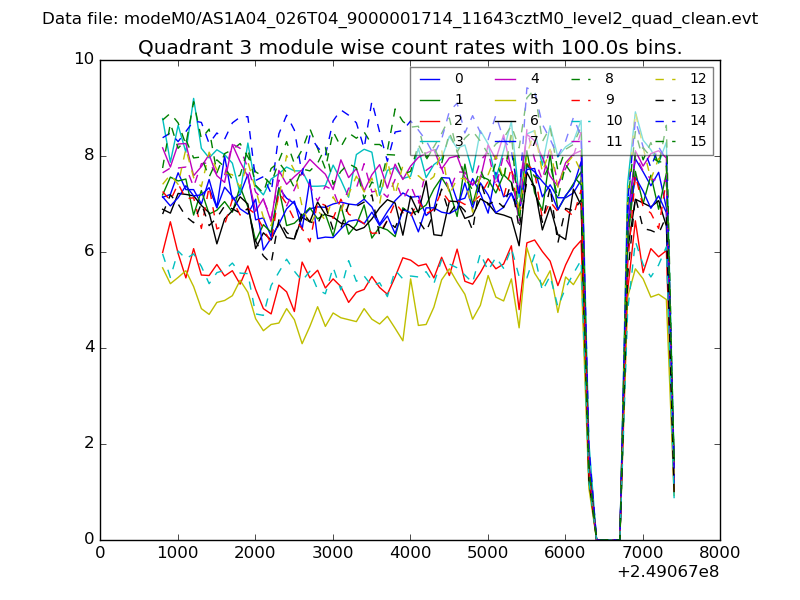
| Module-wise count rates for Quadrant A Data is divided into 100 sec bins |
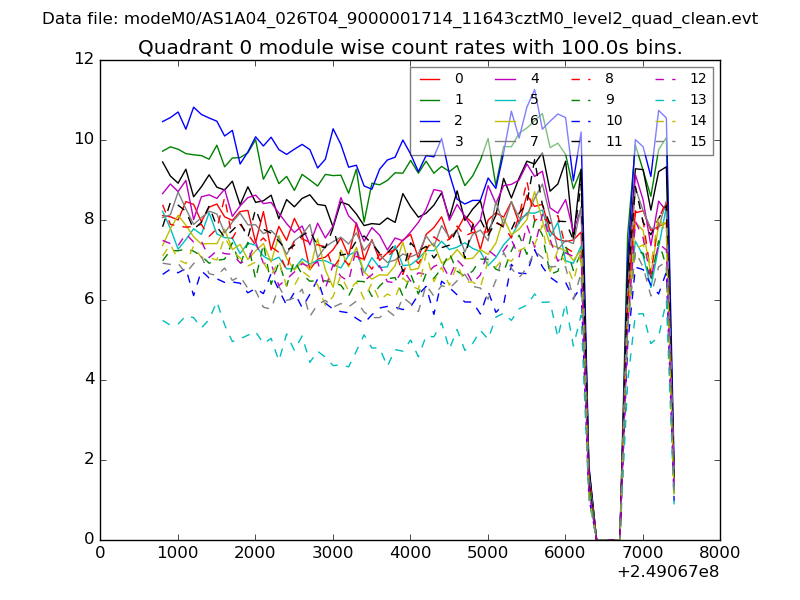 |
 |
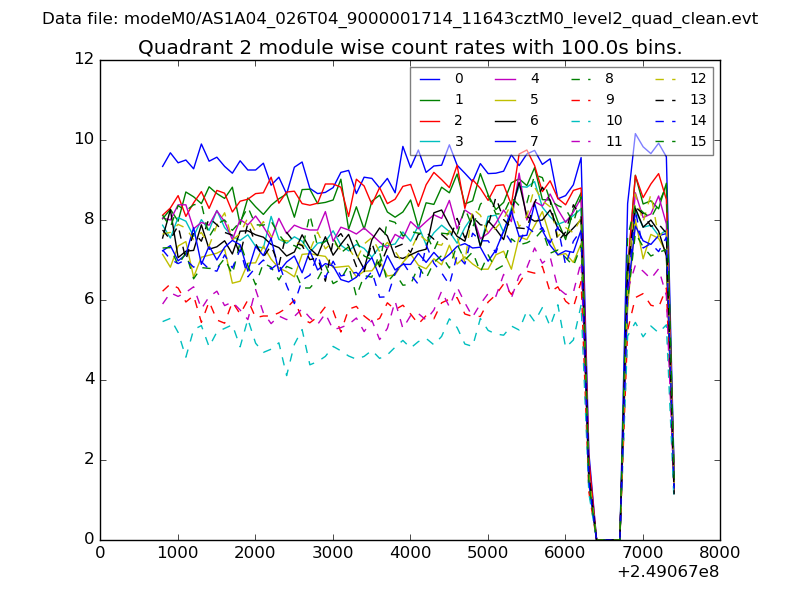
| Module-wise count rates for Quadrant B Data is divided into 100 sec bins |
 |
 |
| Module-wise count rates for Quadrant C Data is divided into 100 sec bins |
 |
 |
| Module-wise count rates for Quadrant D Data is divided into 100 sec bins |
 |
 |
| Parameter | Plot |
|---|---|
| CZT HV Monitor | 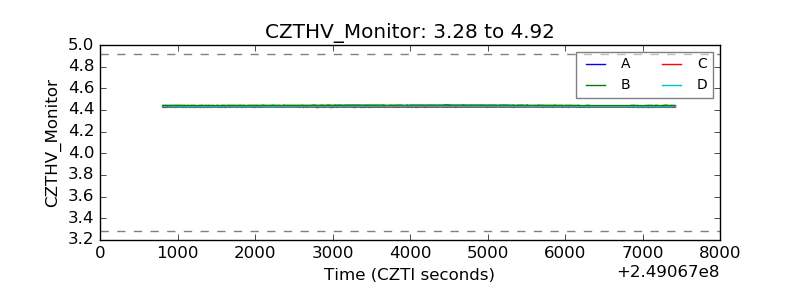 |
| D_VDD | 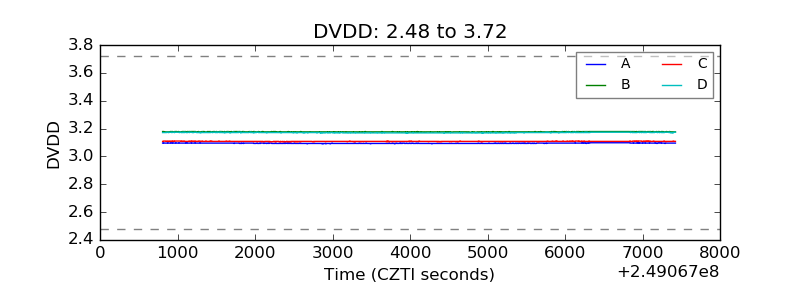 |
| Temperature 1 | 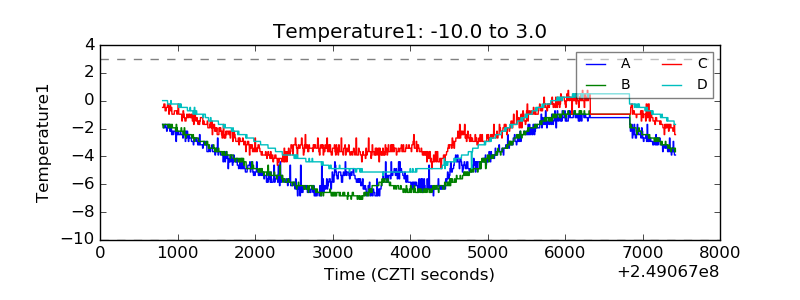 |
| Veto HV Monitor | 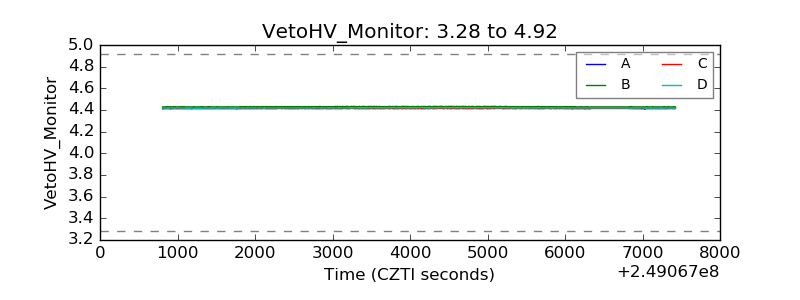 |
| Veto LLD | 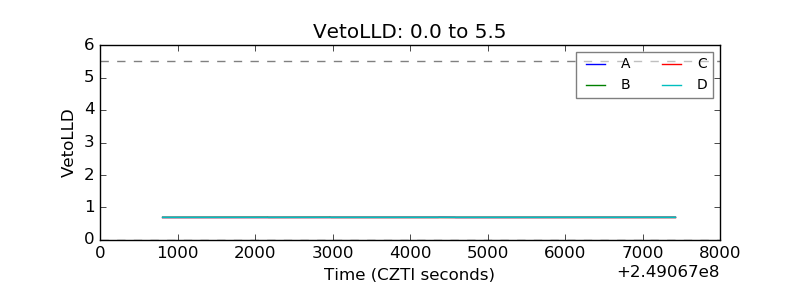 |
| Alpha Counter | 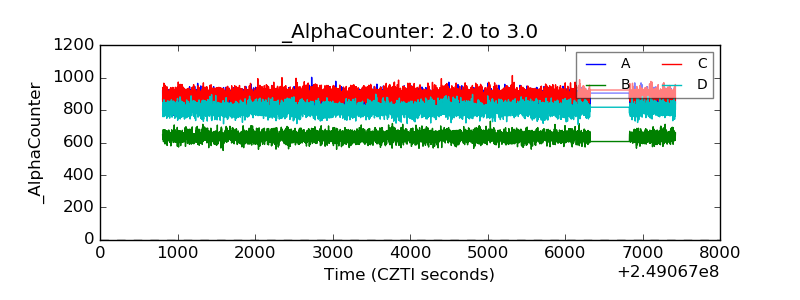 |
| _CPM_Rate | 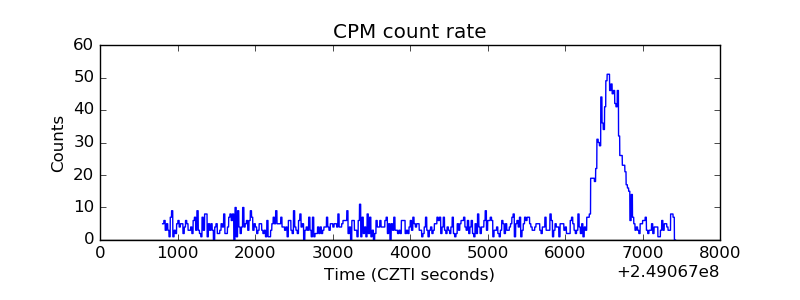 |
| CZT Counter | 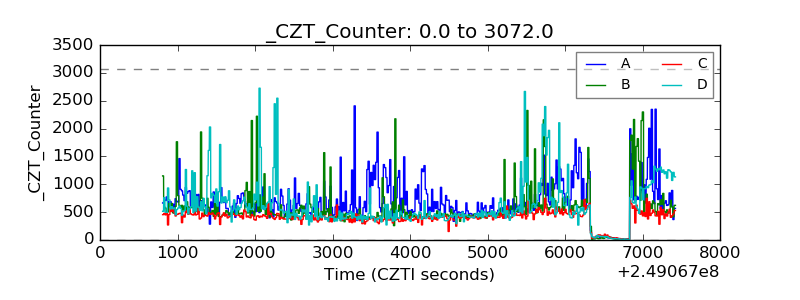 |
| +2.5 Volts monitor |  |
| +5 Volts monitor |  |
| _ROLL_ROT | 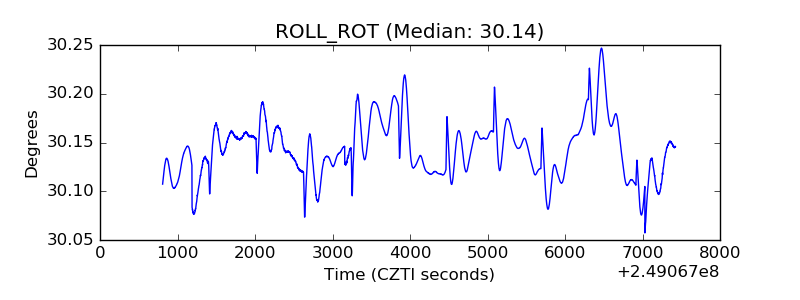 |
| _Roll_DEC | 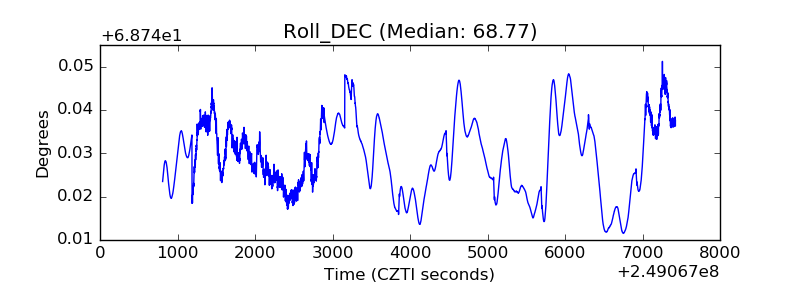 |
| _Roll_RA | 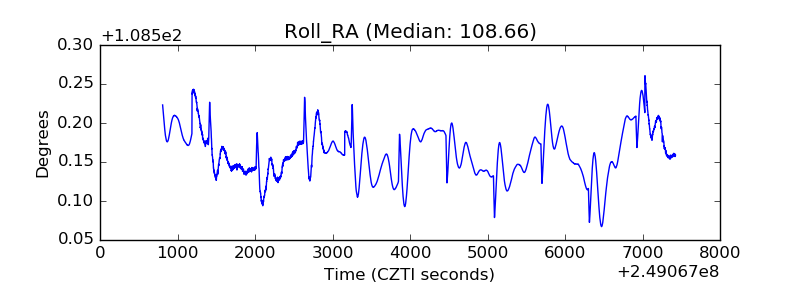 |
| Veto Counter | 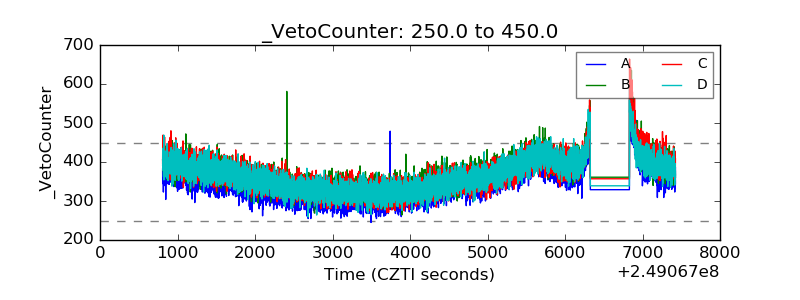 |