| Param | Original file | Final file |
|---|---|---|
| Filename | modeM0/AS1A04_026T04_9000001714_11645cztM0_level2.evt | modeM0/AS1A04_026T04_9000001714_11645cztM0_level2_quad_clean.evt |
| Size (bytes) | 215,164,800 | 40,008,960 |
| Size | 205.2 MB | 38.2 MB |
| Events in quadrant A | 1,484,762 | 271,979 |
| Events in quadrant B | 1,559,236 | 265,108 |
| Events in quadrant C | 990,604 | 265,804 |
| Events in quadrant D | 2,326,734 | 245,461 |
| Mode SS | |||
|---|---|---|---|
| Quadrant | BADHDUFLAG | Total packets | Discarded packets |
| A | 0 | 46 | 0 |
| B | 0 | 46 | 0 |
| C | 0 | 46 | 0 |
| D | 0 | 46 | 0 |
| Mode M0 | |||
|---|---|---|---|
| Quadrant | BADHDUFLAG | Total packets | Discarded packets |
| A | 0 | 5985 | 1 |
| B | 0 | 6168 | 1 |
| C | 0 | 4533 | 1 |
| D | 0 | 8547 | 1 |
| Quadrant | Total seconds | Saturated seconds | Saturation percentage |
|---|---|---|---|
| A | 2250 | 62 | 2.755556% |
| B | 2250 | 162 | 7.200000% |
| C | 2250 | 1 | 0.044444% |
| D | 2250 | 190 | 8.444444% |
Noise dominated data is calculated using 1-second bins in cleaned event files. If a bin has >2000 counts, and if more than 50% of those come from <1% of pixels, then it is considered to be noise-dominated and hence unusable.
| Quadrant | # 1 sec bins | Bins with >0 counts | Bins with >2000 counts | High rate bins dominated by noise | Noise dominated (total time) | Noise dominated (detector-on time) | Marked lightcurve |
|---|---|---|---|---|---|---|---|
| A | 2251 | 2251 | 24 | 24 | 1.07% | 1.07% | 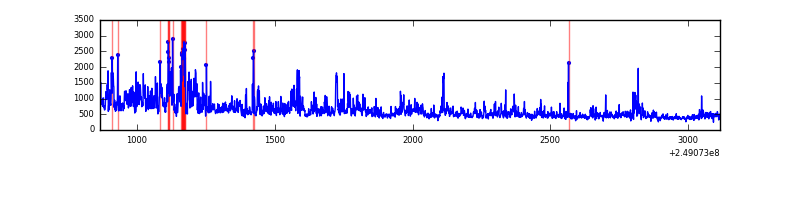 |
| B | 2251 | 2251 | 83 | 83 | 3.69% | 3.69% | 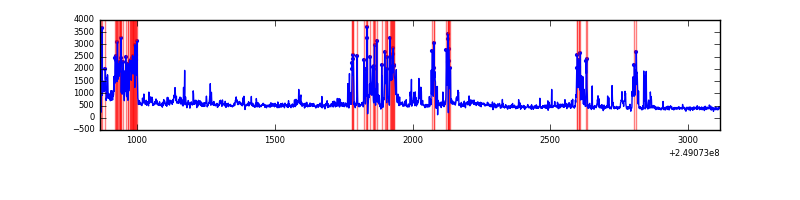 |
| C | 2251 | 2251 | 0 | 0 | 0.00% | 0.00% | 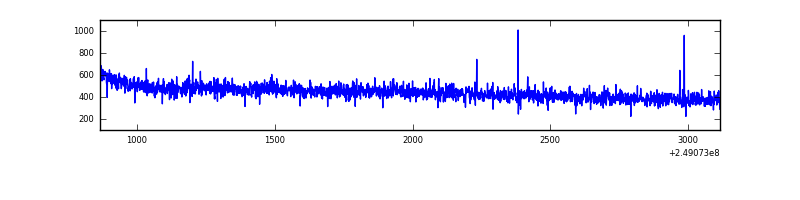 |
| D | 2251 | 2251 | 124 | 124 | 5.51% | 5.51% | 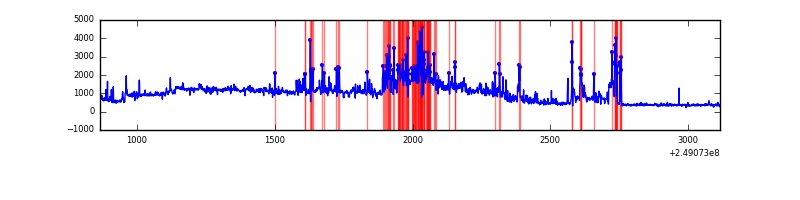 |
Top three noisy pixels from each quadrant. If the there are fewer than three noisy pixels in the level2.evt file, extra rows are filled as -1
| Pixel properties | Quadrant properties | ||||||
|---|---|---|---|---|---|---|---|
| Quadrant | DetID | PixID | Counts | Sigma | Mean | Median | Sigma |
| A | 8 | 5 | 254567 | 4772.3 | 253 | 248 | 53.3 |
| A | 1 | 162 | 83861 | 1569.0 | 253 | 248 | 53.3 |
| A | 1 | 178 | 50619 | 945.21 | 253 | 248 | 53.3 |
| B | 4 | 239 | 385011 | 7664.06 | 251 | 244 | 50.2 |
| B | 10 | 16 | 94226 | 1872.0 | 251 | 244 | 50.2 |
| B | 15 | 204 | 65081 | 1291.47 | 251 | 244 | 50.2 |
| C | 13 | 61 | 1885 | 26.55 | 253 | 253 | 61.5 |
| C | 3 | 202 | 643 | 6.34 | 253 | 253 | 61.5 |
| C | 12 | 4 | 620 | 5.97 | 253 | 253 | 61.5 |
| D | 13 | 137 | 797697 | 12951.15 | 244 | 236 | 61.6 |
| D | 10 | 199 | 186616 | 3026.9 | 244 | 236 | 61.6 |
| D | 10 | 253 | 132101 | 2141.55 | 244 | 236 | 61.6 |
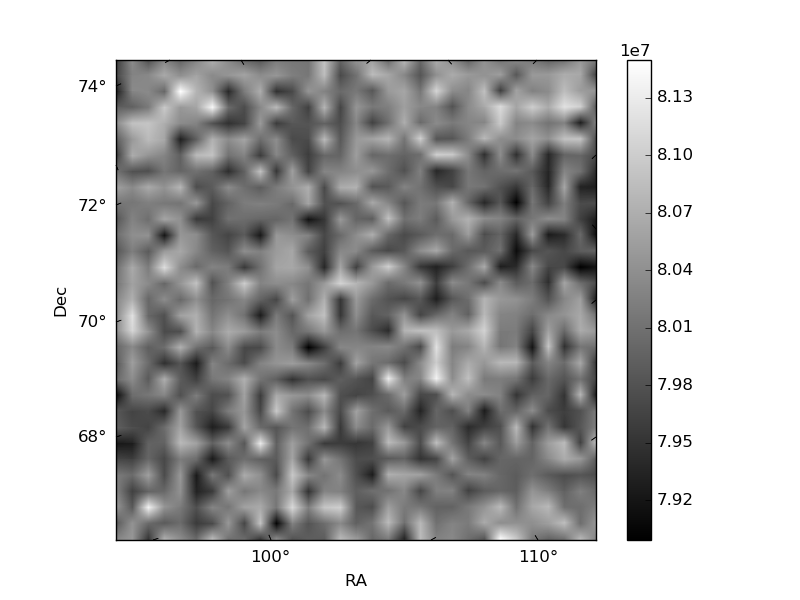
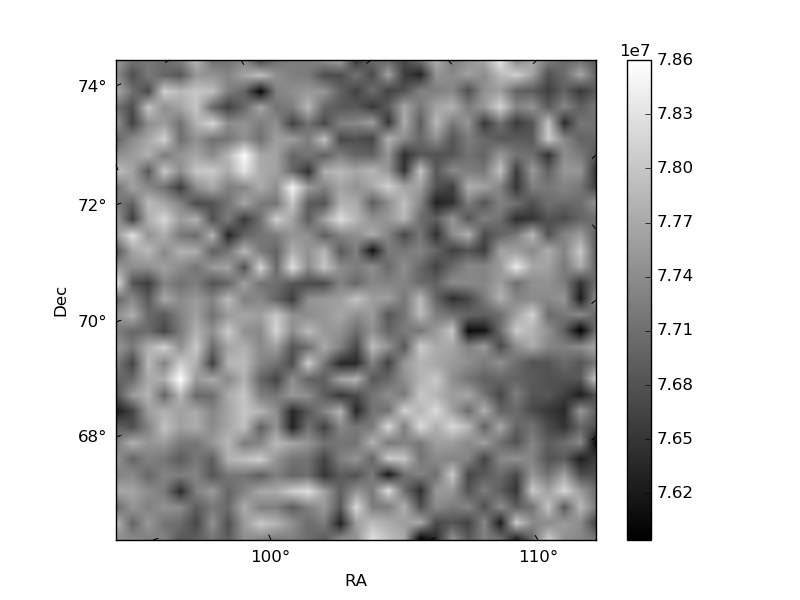
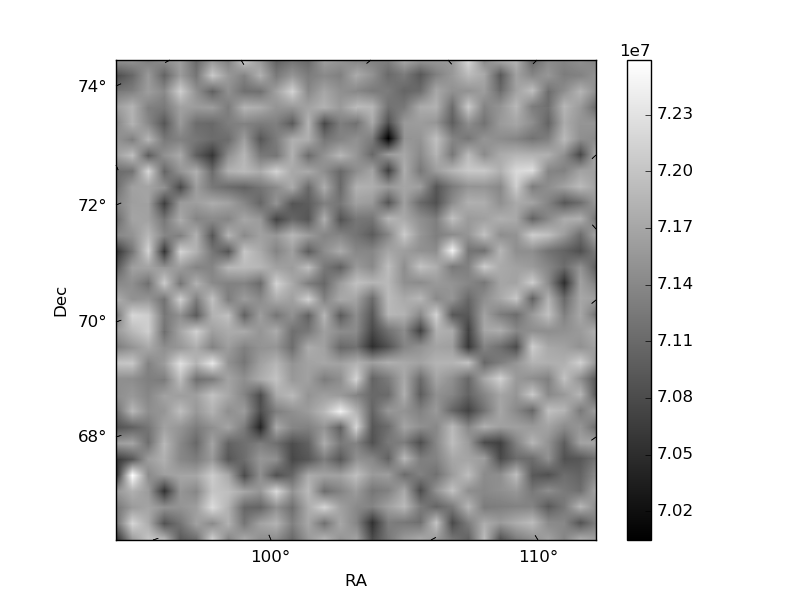
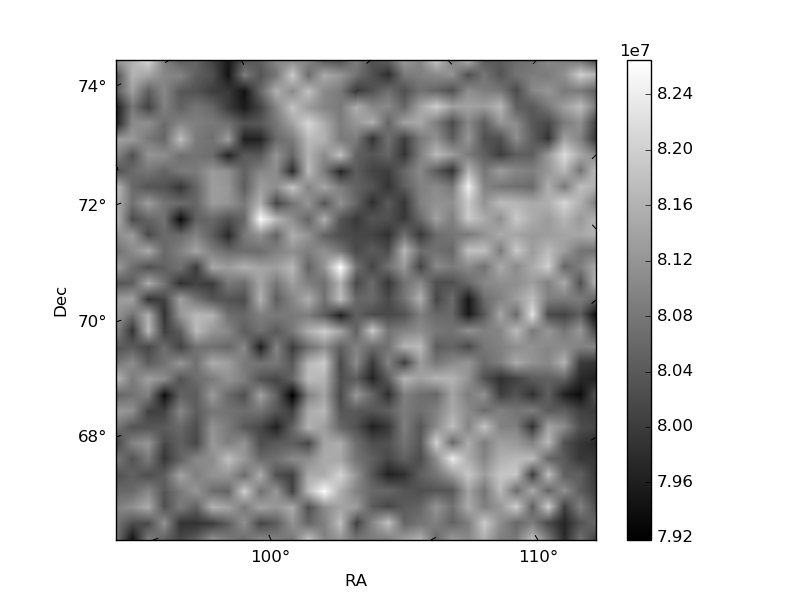
Histogram calculated using DETX and DETY for each event in the final _common_clean file
| Quadrant A | 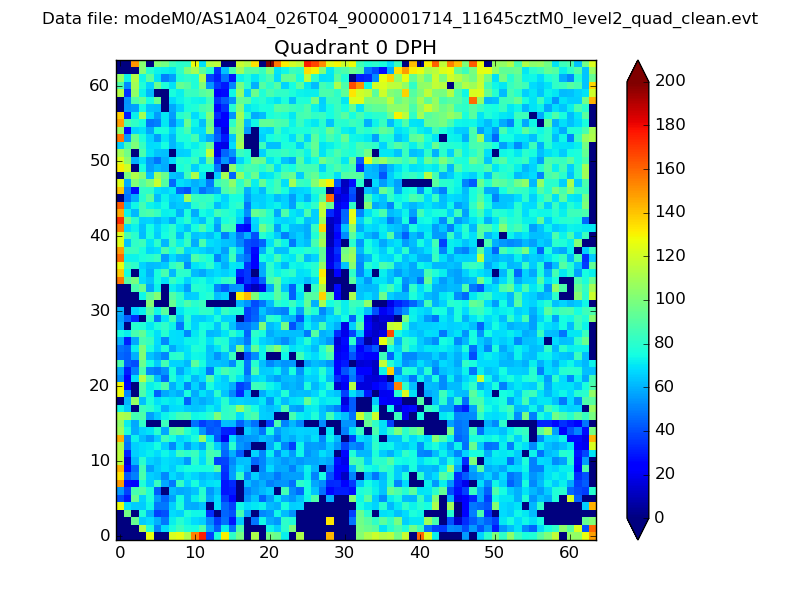 |
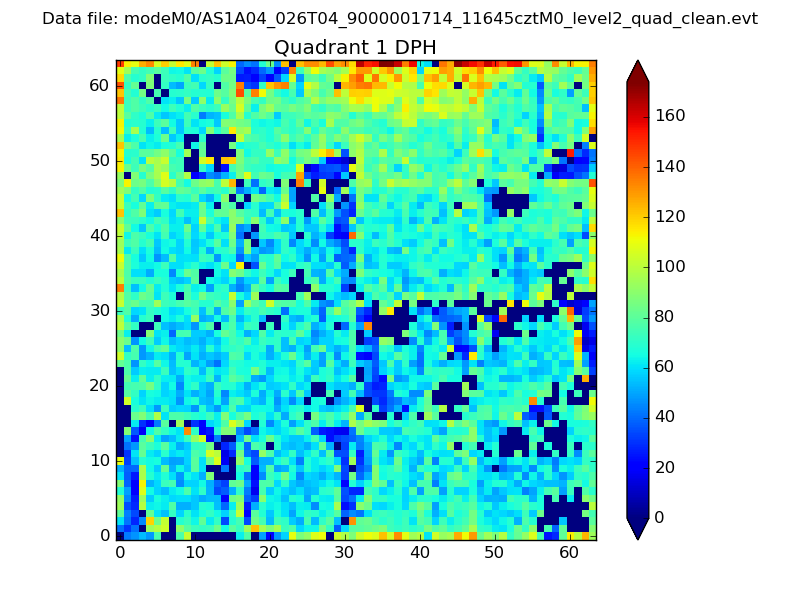 |
Quadrant B |
|---|---|---|---|
| Quadrant D | 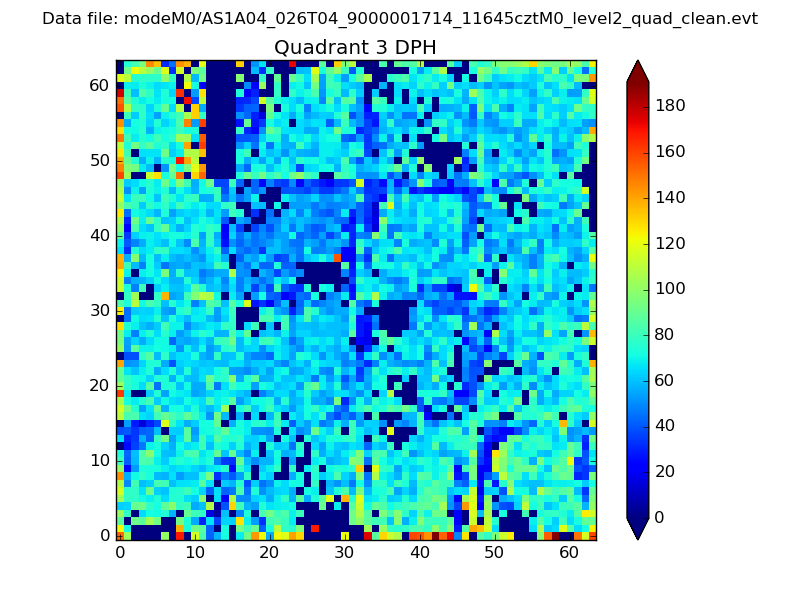 |
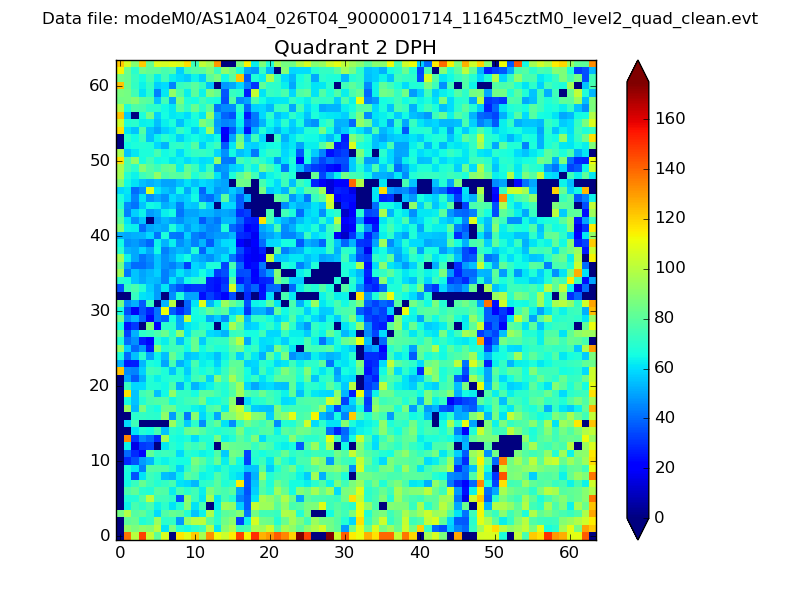 |
Quadrant C |
| Plot type | Count rate plots | Images |
|---|---|---|
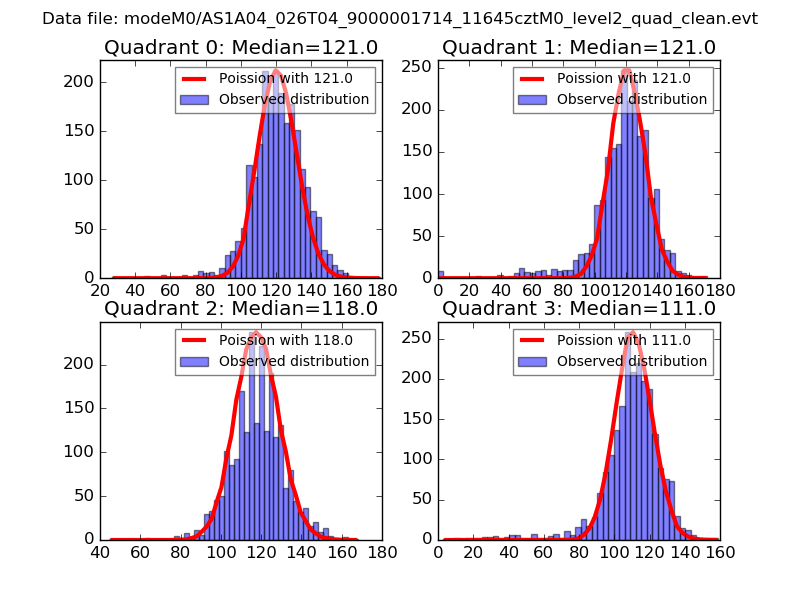
| Comparison with Poisson distribution Blue bars denote a histogram of data divided into 1 sec bins. Red curve is a Poisson curve with rate = median count rate of data. |
 |
 |
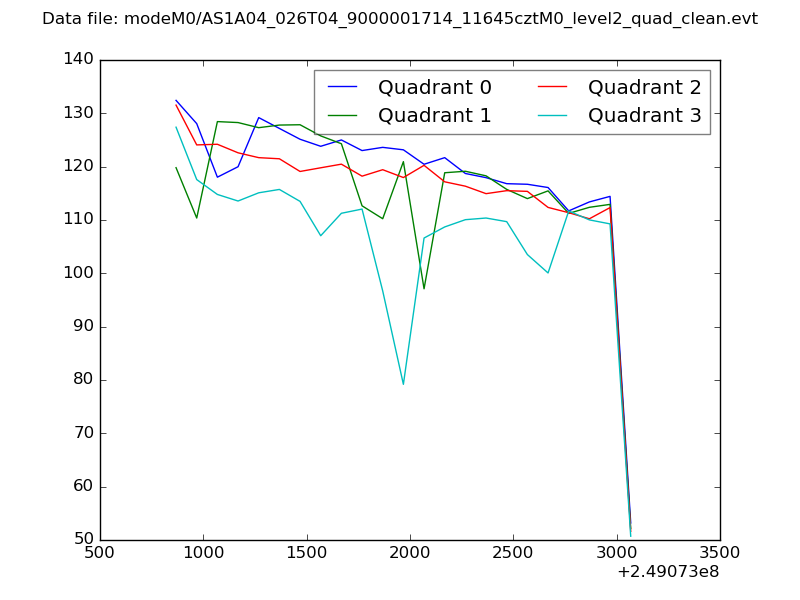
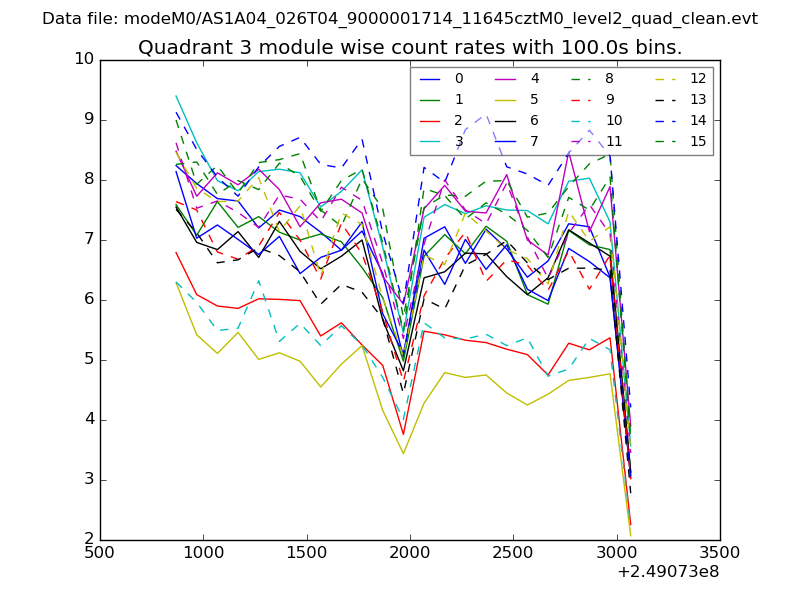
| Quadrant-wise count rates Data is divided into 100 sec bins |
 |
|
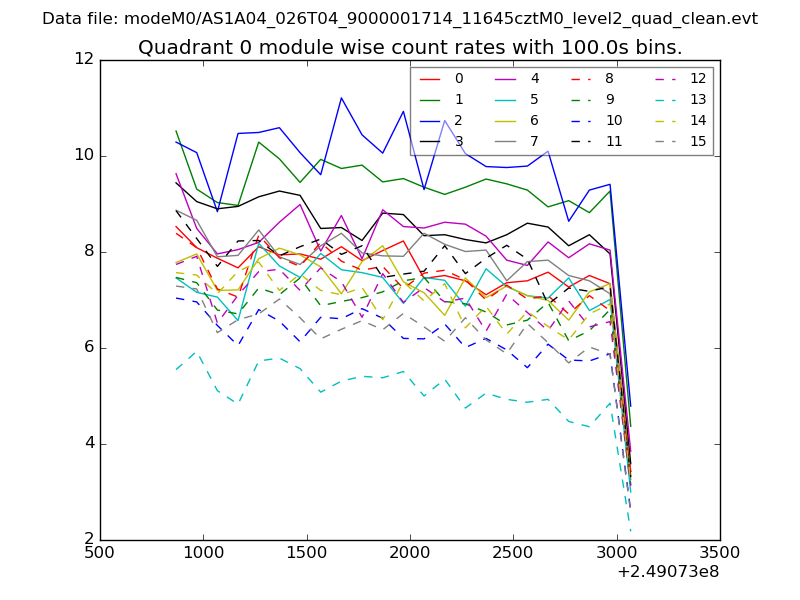
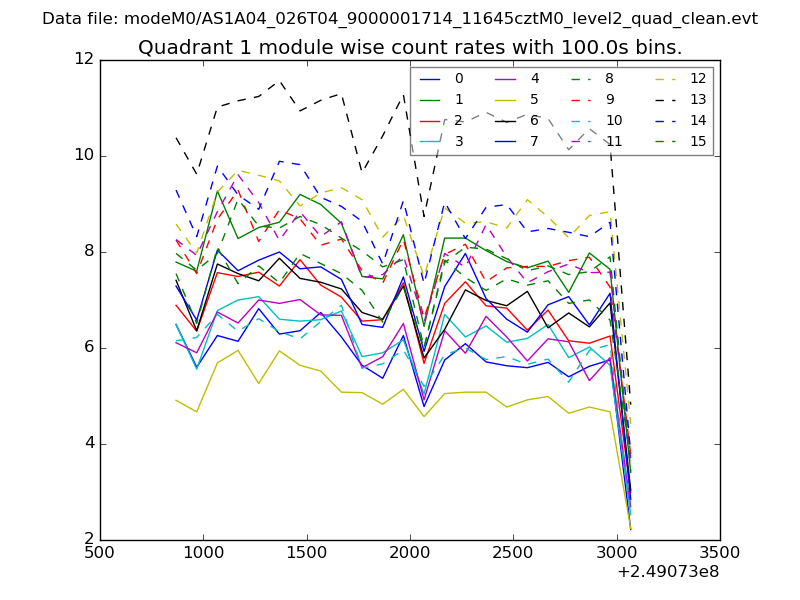
| Module-wise count rates for Quadrant A Data is divided into 100 sec bins |
 |
 |
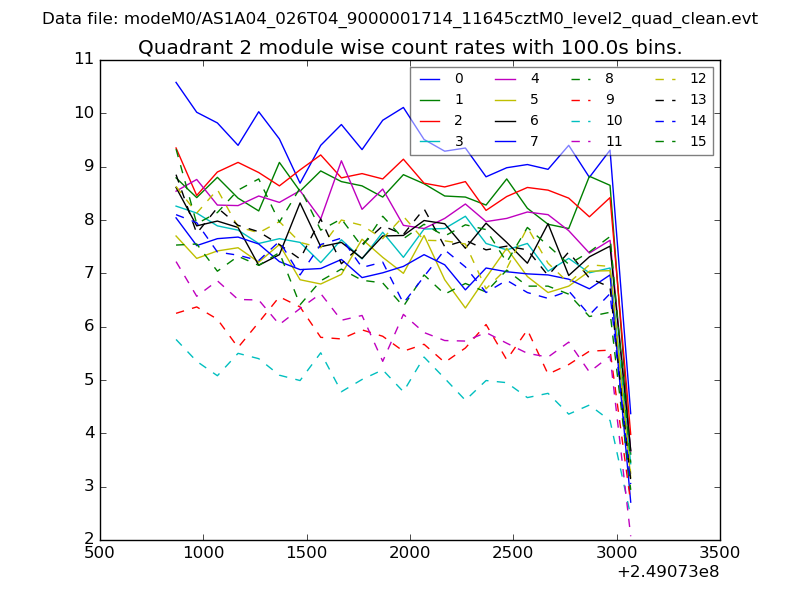
| Module-wise count rates for Quadrant B Data is divided into 100 sec bins |
 |
 |
| Module-wise count rates for Quadrant C Data is divided into 100 sec bins |
 |
 |
| Module-wise count rates for Quadrant D Data is divided into 100 sec bins |
 |
 |
| Parameter | Plot |
|---|---|
| CZT HV Monitor | 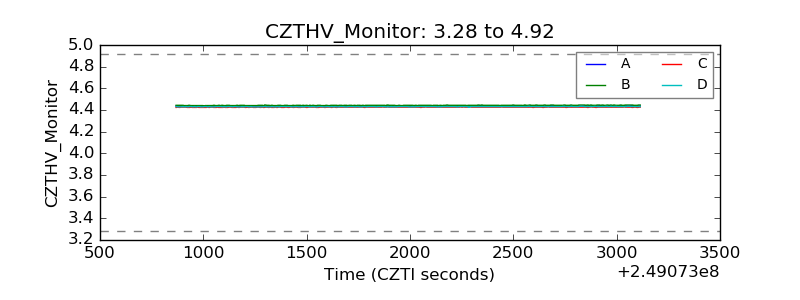 |
| D_VDD | 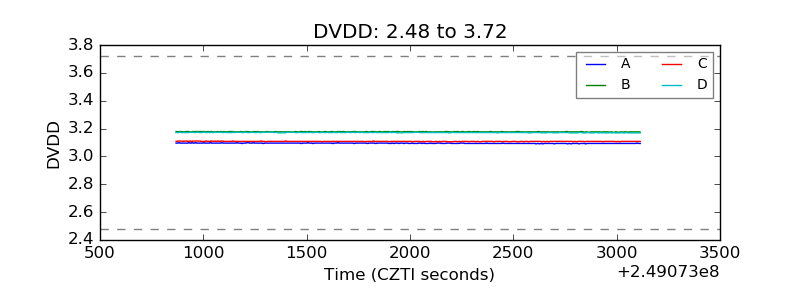 |
| Temperature 1 | 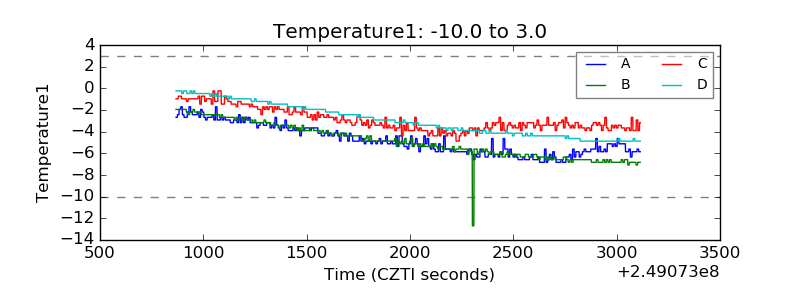 |
| Veto HV Monitor | 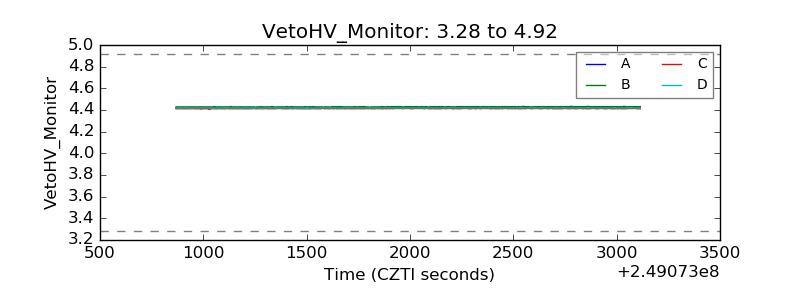 |
| Veto LLD | 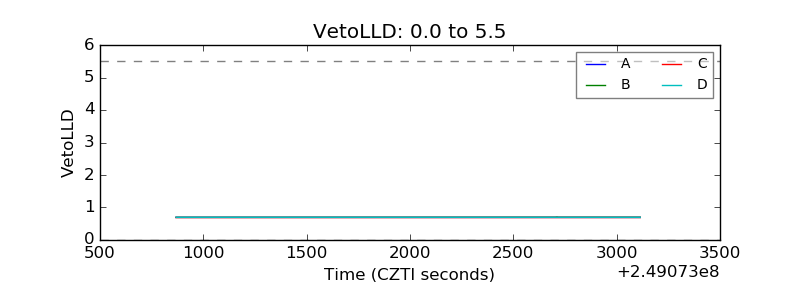 |
| Alpha Counter | 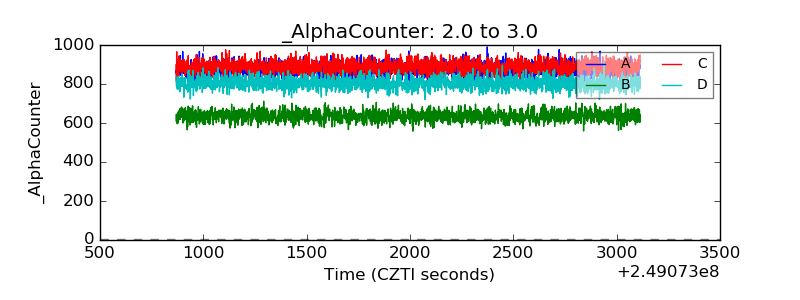 |
| _CPM_Rate | 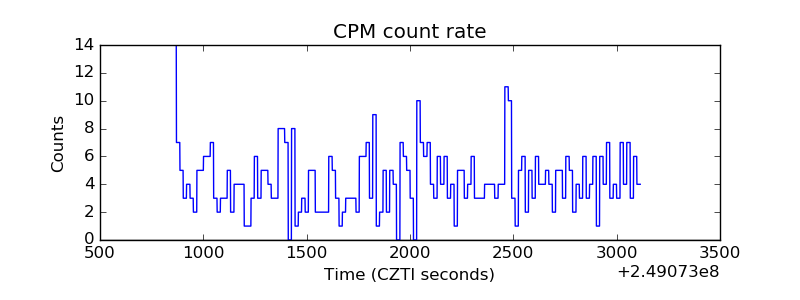 |
| CZT Counter | 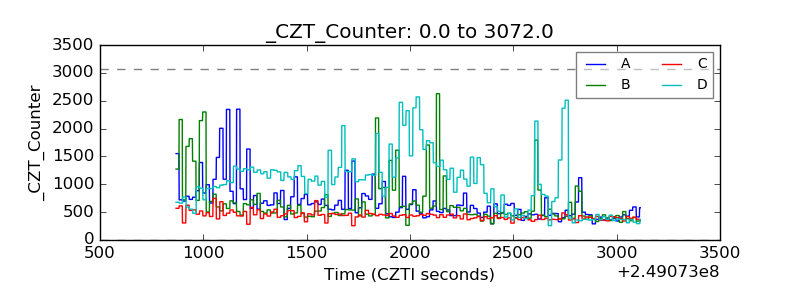 |
| +2.5 Volts monitor |  |
| +5 Volts monitor |  |
| _ROLL_ROT | 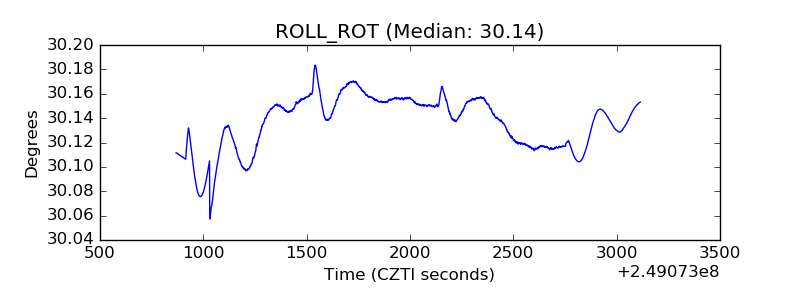 |
| _Roll_DEC | 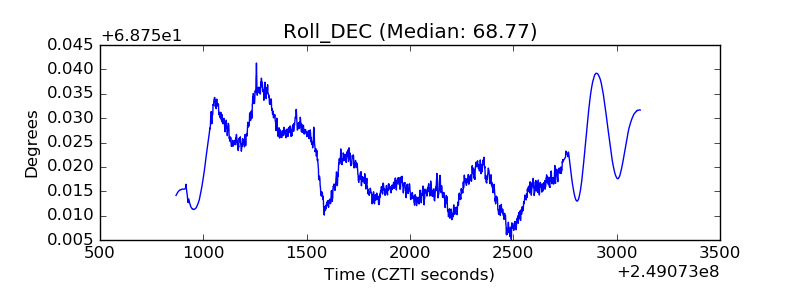 |
| _Roll_RA | 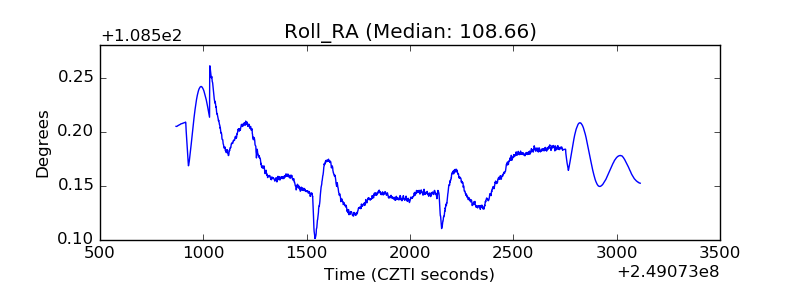 |
| Veto Counter | 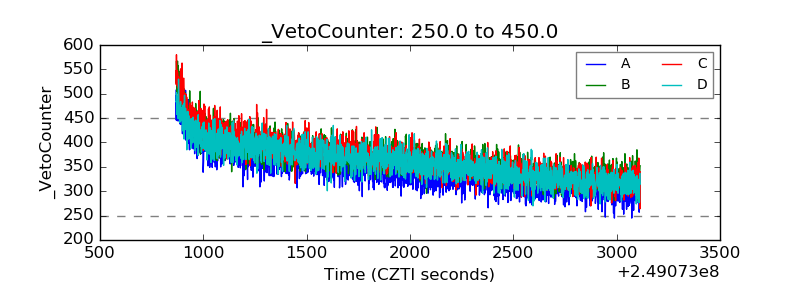 |