| Param | Original file | Final file |
|---|---|---|
| Filename | modeM0/AS1A04_037T01_9000001716_11645cztM0_level2.evt | modeM0/AS1A04_037T01_9000001716_11645cztM0_level2_quad_clean.evt |
| Size (bytes) | 714,352,320 | 100,229,760 |
| Size | 681.3 MB | 95.6 MB |
| Events in quadrant A | 5,963,109 | 608,674 |
| Events in quadrant B | 5,065,722 | 619,144 |
| Events in quadrant C | 4,098,613 | 607,885 |
| Events in quadrant D | 5,903,040 | 580,245 |
| Mode SS | |||
|---|---|---|---|
| Quadrant | BADHDUFLAG | Total packets | Discarded packets |
| A | 0 | 182 | 0 |
| B | 0 | 182 | 0 |
| C | 0 | 182 | 0 |
| D | 0 | 182 | 0 |
| Mode M9 | |||
|---|---|---|---|
| Quadrant | BADHDUFLAG | Total packets | Discarded packets |
| A | 0 | 14 | 0 |
| B | 0 | 14 | 0 |
| C | 0 | 14 | 0 |
| D | 0 | 14 | 0 |
| Mode M0 | |||
|---|---|---|---|
| Quadrant | BADHDUFLAG | Total packets | Discarded packets |
| A | 0 | 23837 | 3 |
| B | 0 | 21012 | 2 |
| C | 0 | 18202 | 2 |
| D | 0 | 23730 | 2 |
| Quadrant | Total seconds | Saturated seconds | Saturation percentage |
|---|---|---|---|
| A | 8920 | 322 | 3.609865% |
| B | 8920 | 295 | 3.307175% |
| C | 8920 | 45 | 0.504484% |
| D | 8920 | 343 | 3.845291% |
Noise dominated data is calculated using 1-second bins in cleaned event files. If a bin has >2000 counts, and if more than 50% of those come from <1% of pixels, then it is considered to be noise-dominated and hence unusable.
| Quadrant | # 1 sec bins | Bins with >0 counts | Bins with >2000 counts | High rate bins dominated by noise | Noise dominated (total time) | Noise dominated (detector-on time) | Marked lightcurve |
|---|---|---|---|---|---|---|---|
| A | 10341 | 8923 | 97 | 97 | 0.94% | 1.09% | 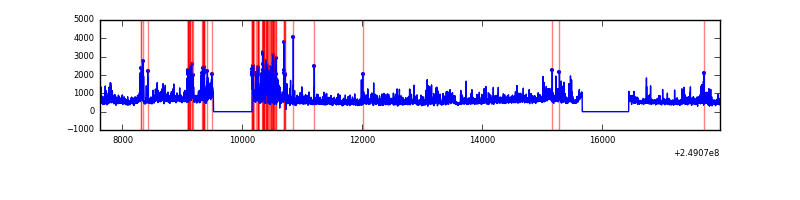 |
| B | 10341 | 8923 | 109 | 109 | 1.05% | 1.22% | 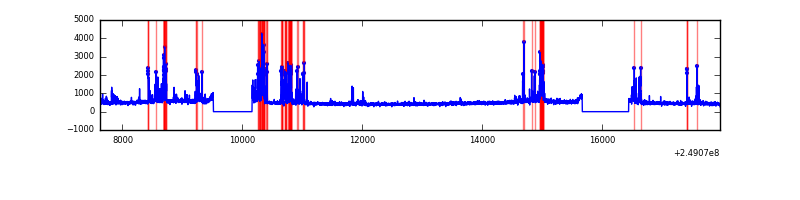 |
| C | 10341 | 8923 | 10 | 10 | 0.10% | 0.11% | 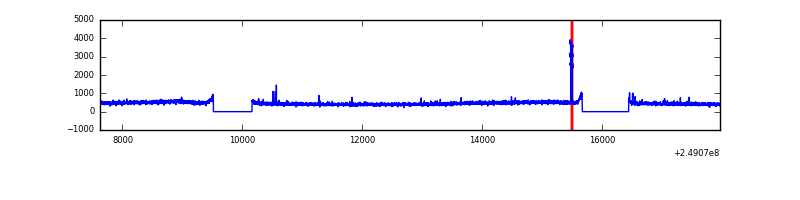 |
| D | 10341 | 8923 | 183 | 183 | 1.77% | 2.05% | 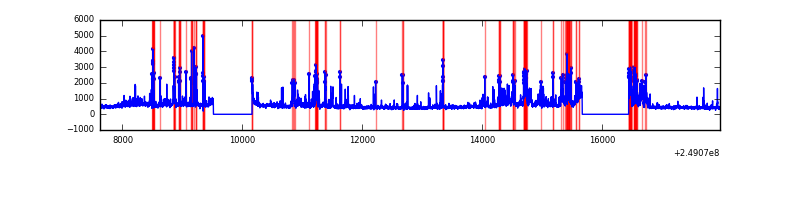 |
Top three noisy pixels from each quadrant. If the there are fewer than three noisy pixels in the level2.evt file, extra rows are filled as -1
| Pixel properties | Quadrant properties | ||||||
|---|---|---|---|---|---|---|---|
| Quadrant | DetID | PixID | Counts | Sigma | Mean | Median | Sigma |
| A | 8 | 5 | 861817 | 3966.74 | 1057 | 1032 | 217.0 |
| A | 1 | 162 | 338249 | 1553.99 | 1057 | 1032 | 217.0 |
| A | 1 | 178 | 210151 | 963.68 | 1057 | 1032 | 217.0 |
| B | 4 | 239 | 797449 | 3871.53 | 1063 | 1035 | 205.7 |
| B | 15 | 204 | 80475 | 386.17 | 1063 | 1035 | 205.7 |
| B | 10 | 16 | 27580 | 129.04 | 1063 | 1035 | 205.7 |
| C | 15 | 208 | 41269 | 166.4 | 1038 | 1043 | 241.7 |
| C | 14 | 234 | 10395 | 38.69 | 1038 | 1043 | 241.7 |
| C | 13 | 61 | 7552 | 26.93 | 1038 | 1043 | 241.7 |
| D | 13 | 104 | 1061229 | 4325.04 | 1017 | 985 | 245.1 |
| D | 8 | 195 | 405880 | 1651.68 | 1017 | 985 | 245.1 |
| D | 10 | 253 | 168852 | 684.78 | 1017 | 985 | 245.1 |
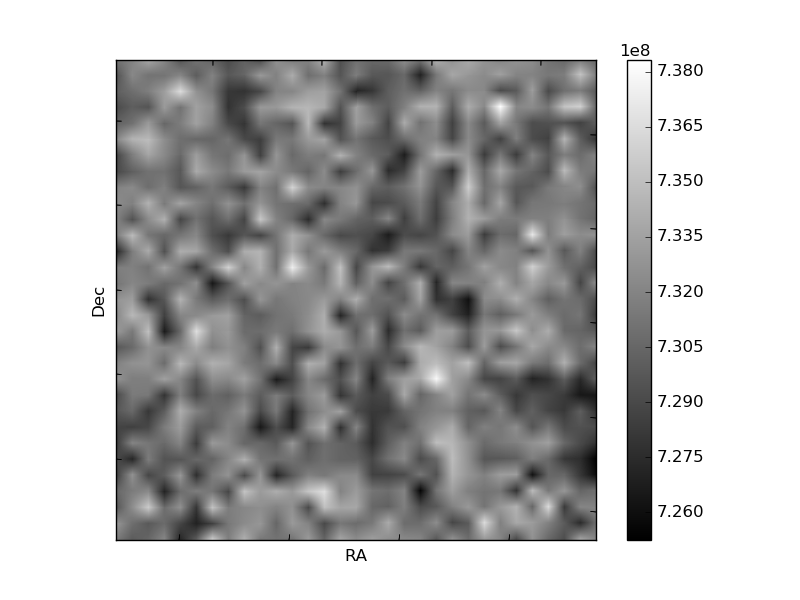
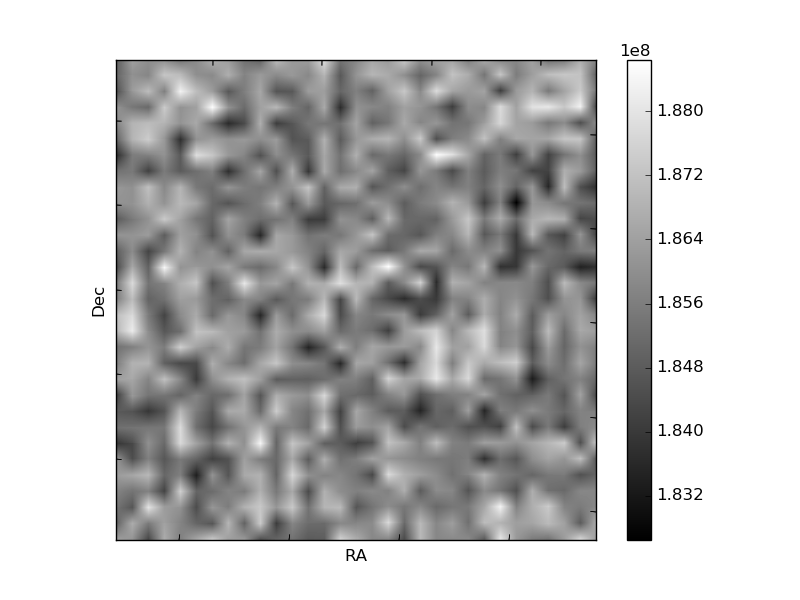
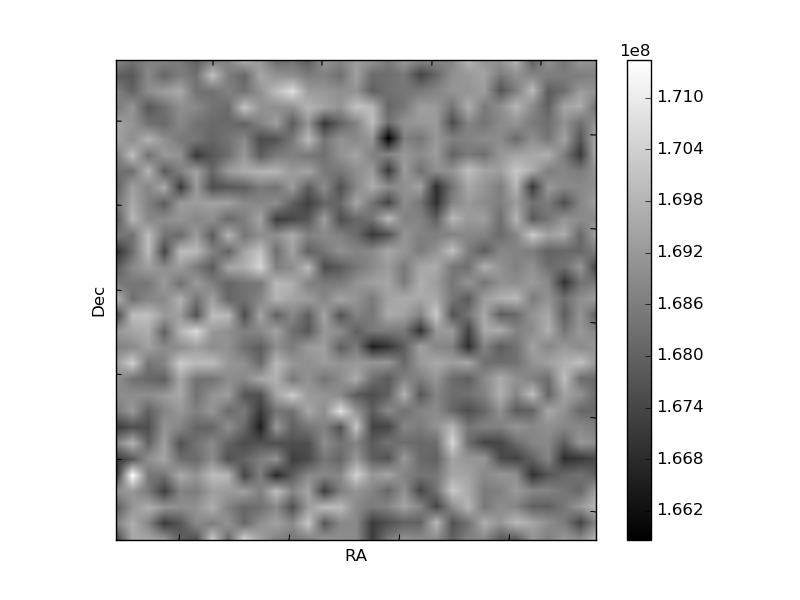
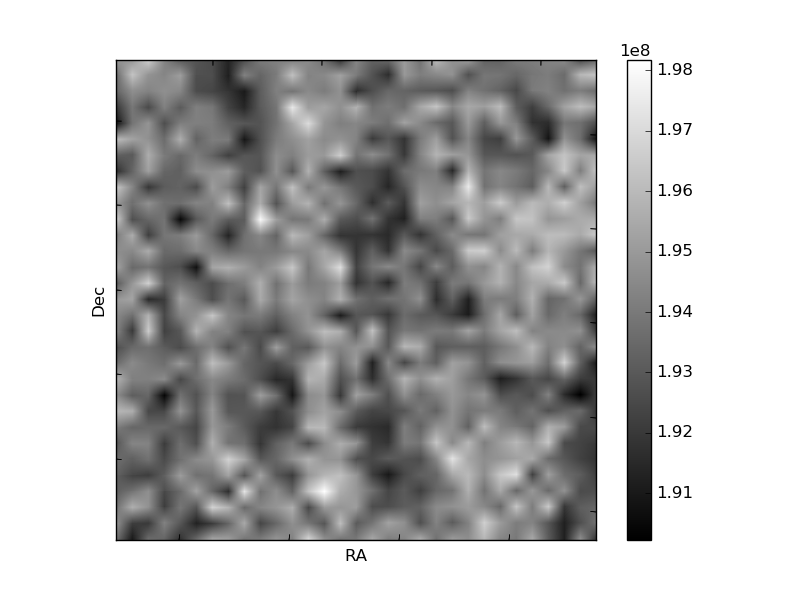
Histogram calculated using DETX and DETY for each event in the final _common_clean file
| Quadrant A | 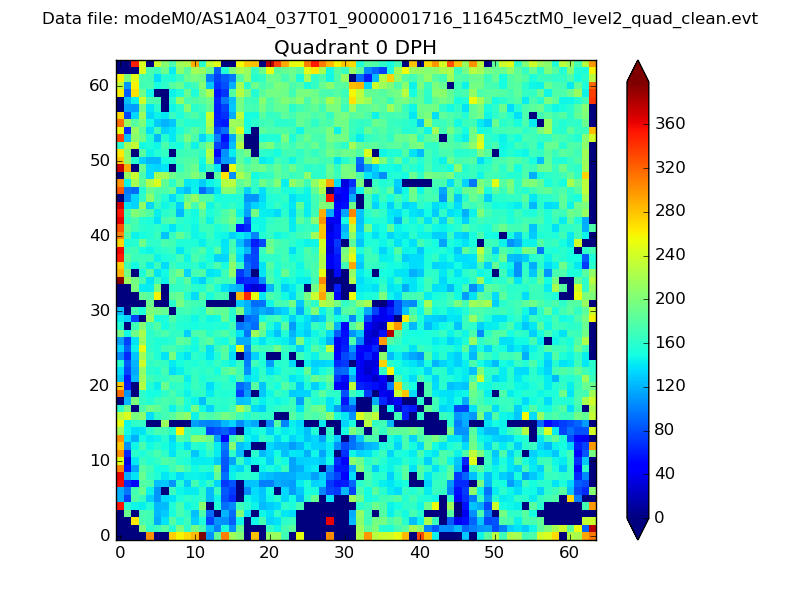 |
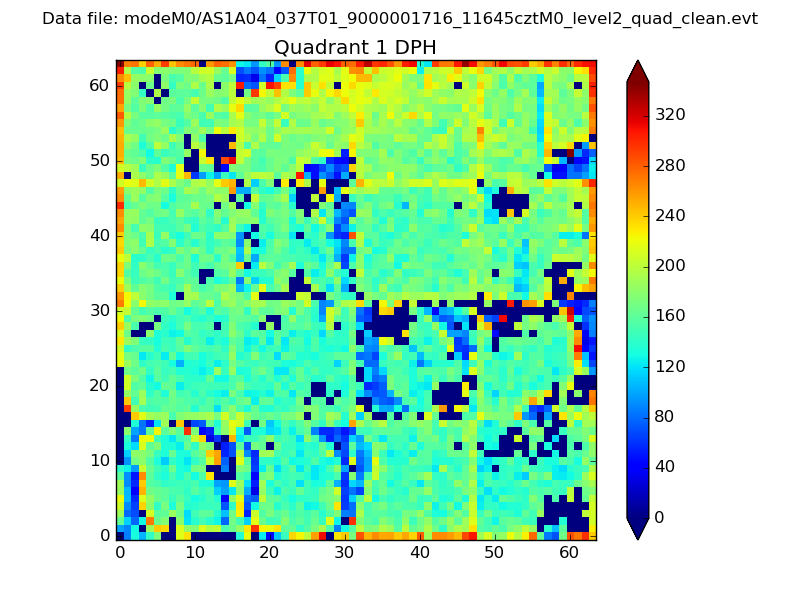 |
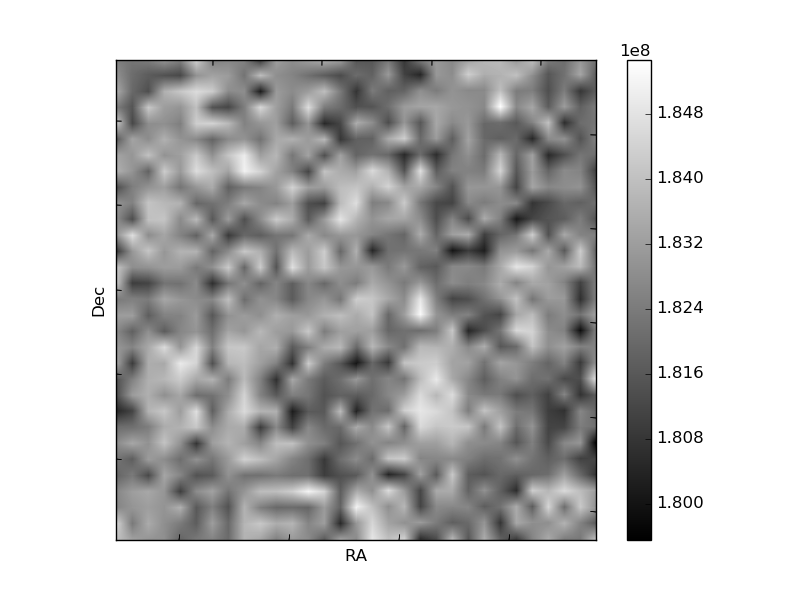
Quadrant B |
|---|---|---|---|
| Quadrant D | 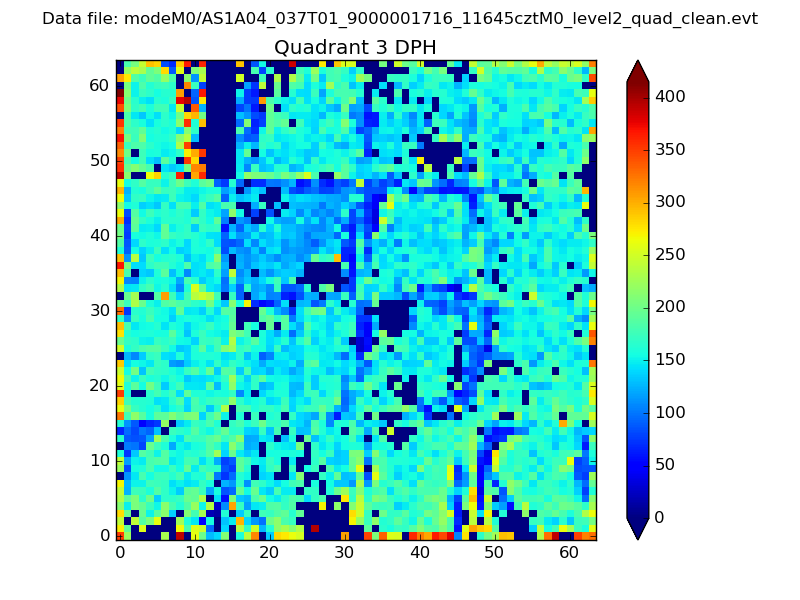 |
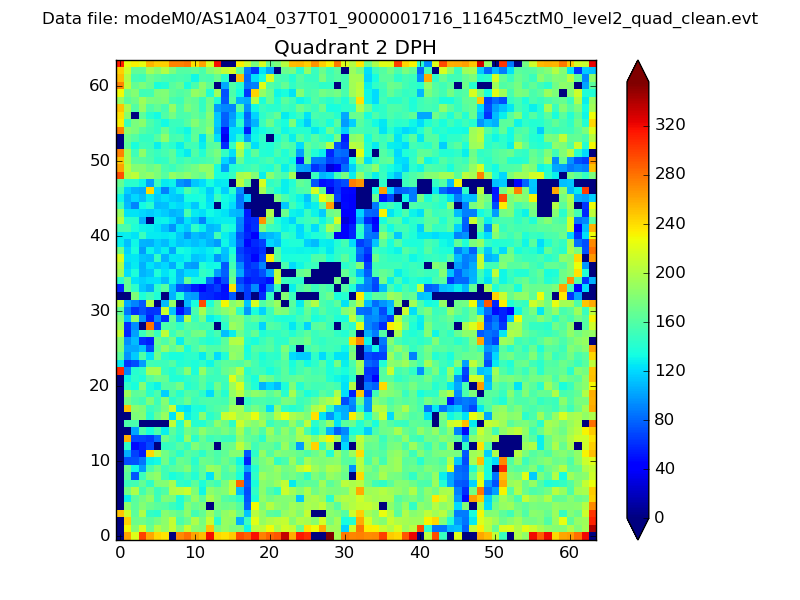 |
Quadrant C |
| Plot type | Count rate plots | Images |
|---|---|---|
| Comparison with Poisson distribution Blue bars denote a histogram of data divided into 1 sec bins. Red curve is a Poisson curve with rate = median count rate of data. |
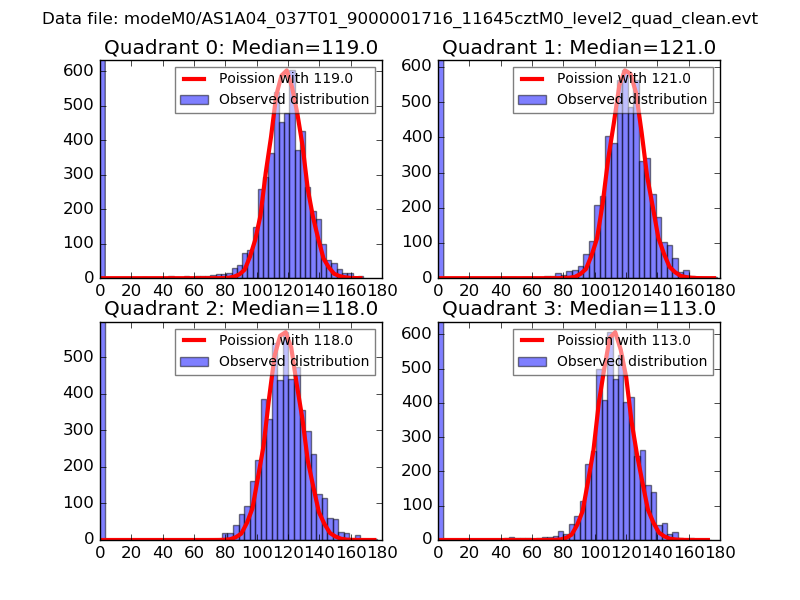 |
 |
| Quadrant-wise count rates Data is divided into 100 sec bins |
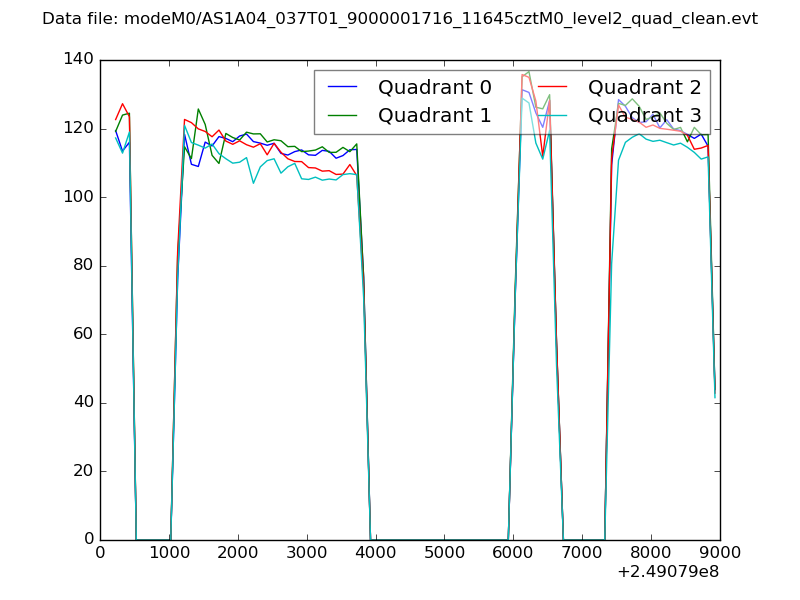 |
|
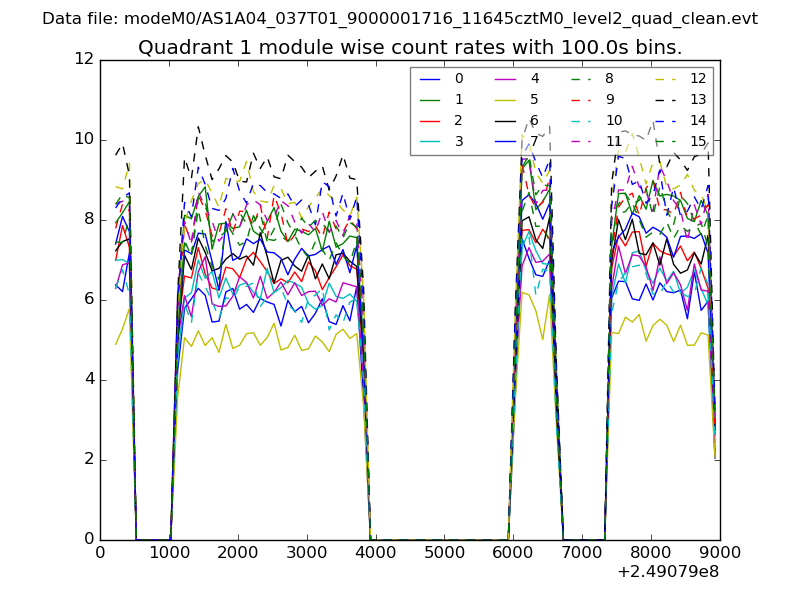
| Module-wise count rates for Quadrant A Data is divided into 100 sec bins |
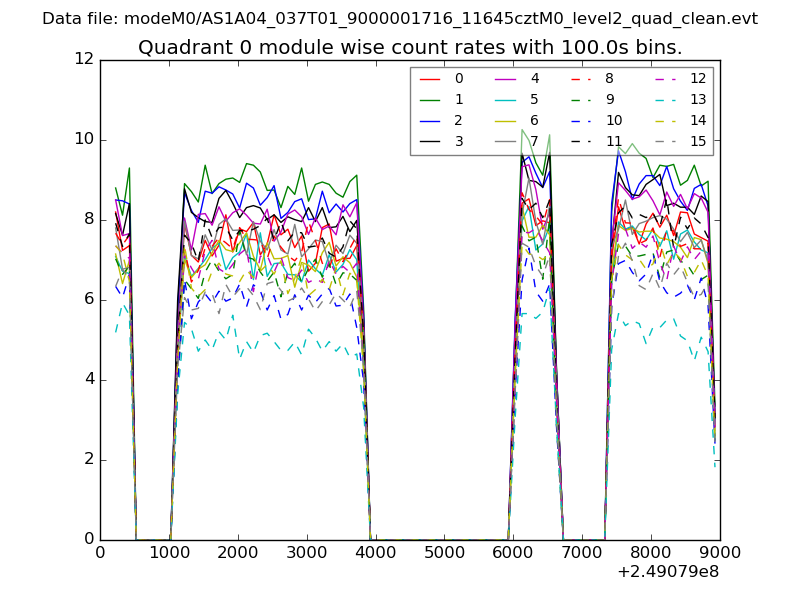 |
 |
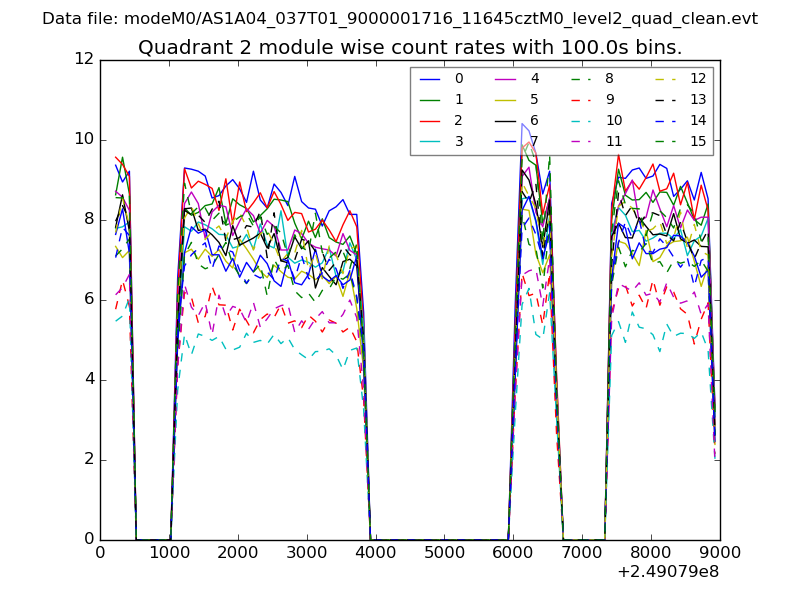
| Module-wise count rates for Quadrant B Data is divided into 100 sec bins |
 |
 |
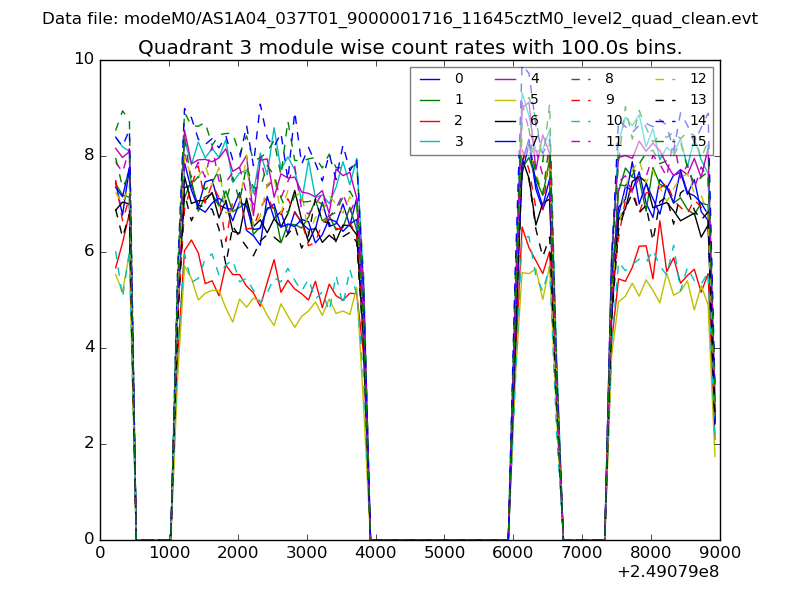
| Module-wise count rates for Quadrant C Data is divided into 100 sec bins |
 |
 |
| Module-wise count rates for Quadrant D Data is divided into 100 sec bins |
 |
 |
| Parameter | Plot |
|---|---|
| CZT HV Monitor | 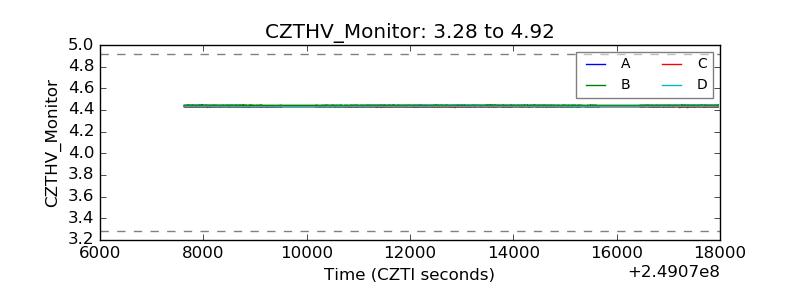 |
| D_VDD | 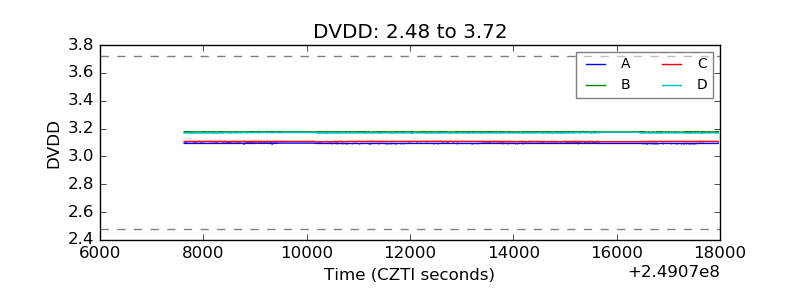 |
| Temperature 1 | 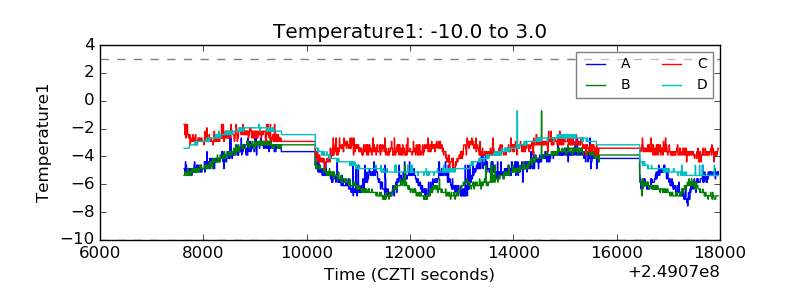 |
| Veto HV Monitor | 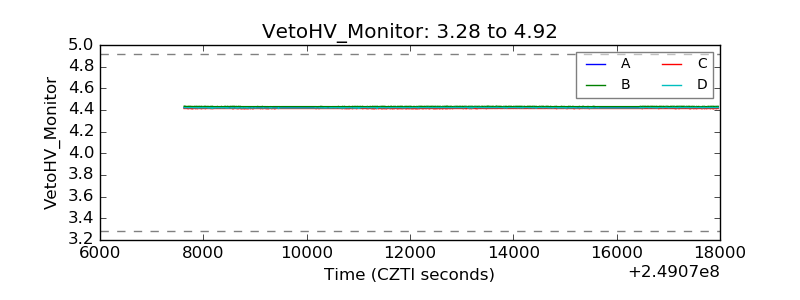 |
| Veto LLD | 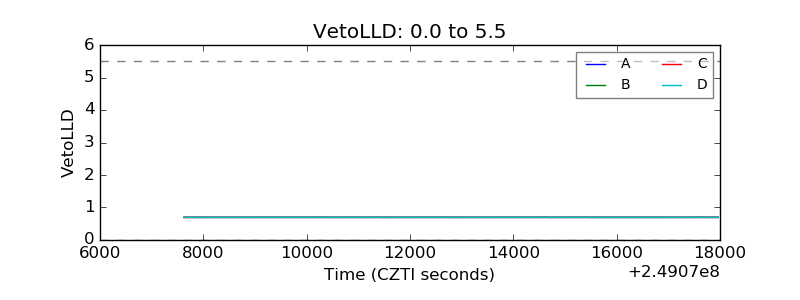 |
| Alpha Counter | 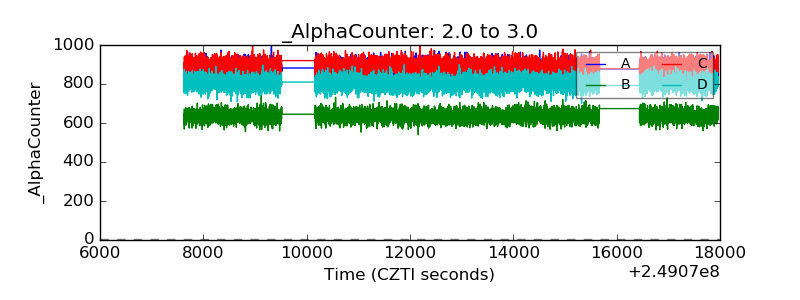 |
| _CPM_Rate | 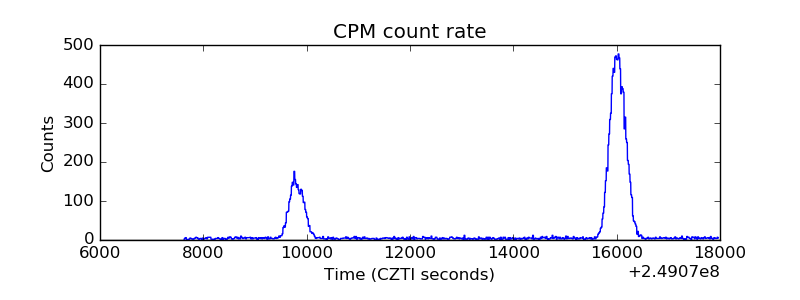 |
| CZT Counter | 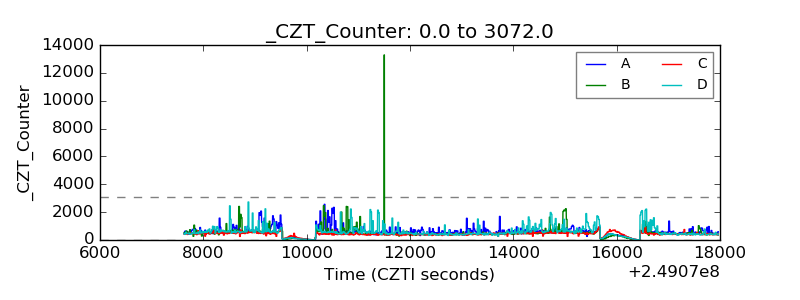 |
| +2.5 Volts monitor |  |
| +5 Volts monitor |  |
| _ROLL_ROT | 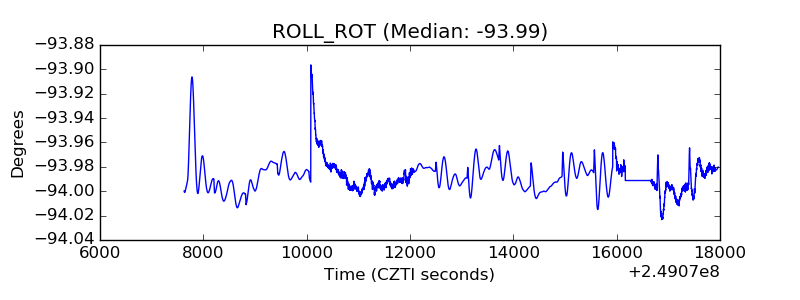 |
| _Roll_DEC | 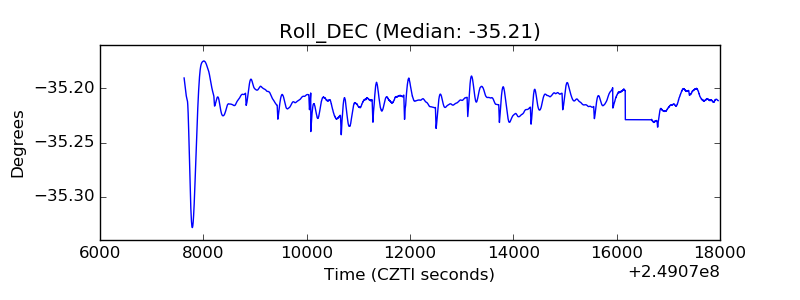 |
| _Roll_RA | 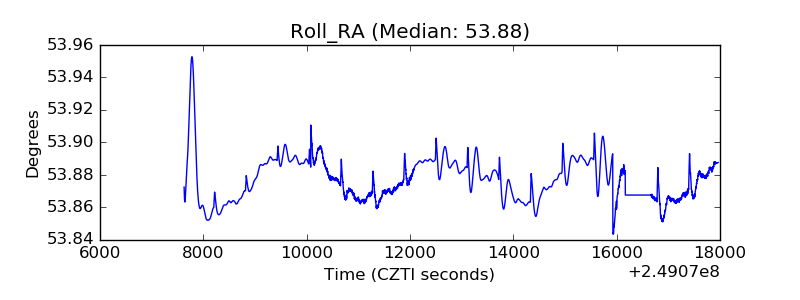 |
| Veto Counter | 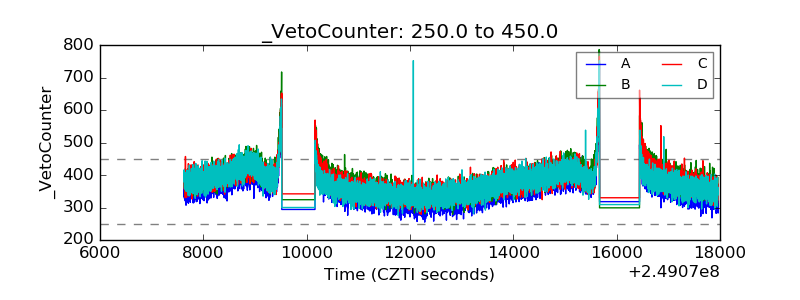 |