| Param | Original file | Final file |
|---|---|---|
| Filename | modeM0/AS1A04_037T01_9000001716_11650cztM0_level2.evt | modeM0/AS1A04_037T01_9000001716_11650cztM0_level2_quad_clean.evt |
| Size (bytes) | 509,474,880 | 81,878,400 |
| Size | 485.9 MB | 78.1 MB |
| Events in quadrant A | 4,183,213 | 508,047 |
| Events in quadrant B | 4,035,072 | 519,960 |
| Events in quadrant C | 3,223,225 | 517,245 |
| Events in quadrant D | 3,558,161 | 491,815 |
| Mode SS | |||
|---|---|---|---|
| Quadrant | BADHDUFLAG | Total packets | Discarded packets |
| A | 0 | 130 | 0 |
| B | 0 | 130 | 0 |
| C | 0 | 130 | 0 |
| D | 0 | 130 | 0 |
| Mode M9 | |||
|---|---|---|---|
| Quadrant | BADHDUFLAG | Total packets | Discarded packets |
| A | 0 | 20 | 0 |
| B | 0 | 20 | 0 |
| C | 0 | 20 | 0 |
| D | 0 | 21 | 0 |
| Mode M0 | |||
|---|---|---|---|
| Quadrant | BADHDUFLAG | Total packets | Discarded packets |
| A | 0 | 16795 | 3 |
| B | 0 | 15938 | 2 |
| C | 0 | 13438 | 2 |
| D | 0 | 14428 | 2 |
| Quadrant | Total seconds | Saturated seconds | Saturation percentage |
|---|---|---|---|
| A | 6334 | 158 | 2.494474% |
| B | 6334 | 229 | 3.615409% |
| C | 6334 | 47 | 0.742027% |
| D | 6334 | 68 | 1.073571% |
Noise dominated data is calculated using 1-second bins in cleaned event files. If a bin has >2000 counts, and if more than 50% of those come from <1% of pixels, then it is considered to be noise-dominated and hence unusable.
| Quadrant | # 1 sec bins | Bins with >0 counts | Bins with >2000 counts | High rate bins dominated by noise | Noise dominated (total time) | Noise dominated (detector-on time) | Marked lightcurve |
|---|---|---|---|---|---|---|---|
| A | 7565 | 6336 | 48 | 48 | 0.63% | 0.76% | 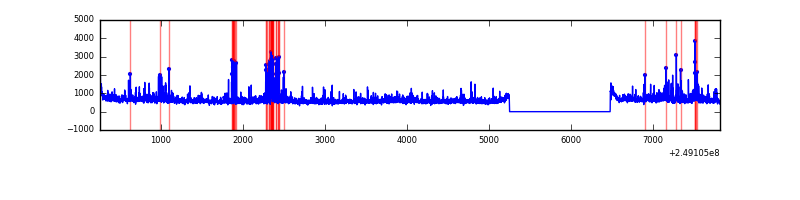 |
| B | 7565 | 6336 | 78 | 78 | 1.03% | 1.23% | 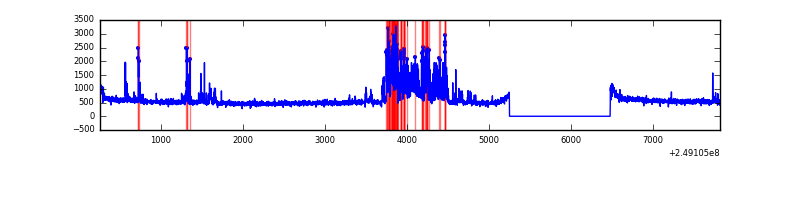 |
| C | 7565 | 6336 | 0 | 0 | 0.00% | 0.00% | 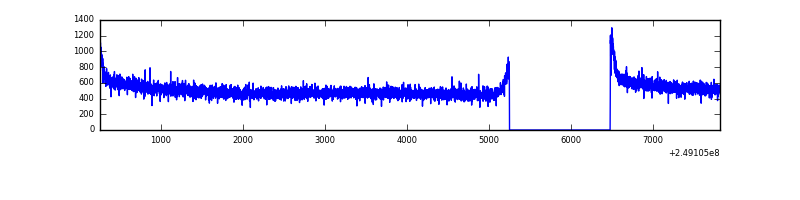 |
| D | 7565 | 6336 | 30 | 30 | 0.40% | 0.47% | 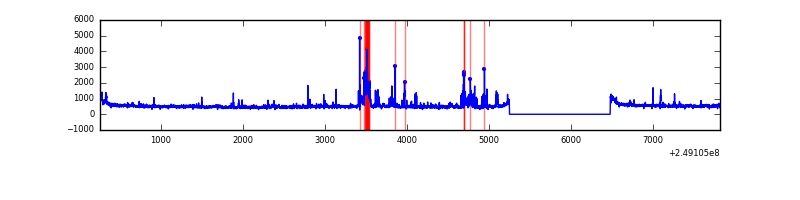 |
Top three noisy pixels from each quadrant. If the there are fewer than three noisy pixels in the level2.evt file, extra rows are filled as -1
| Pixel properties | Quadrant properties | ||||||
|---|---|---|---|---|---|---|---|
| Quadrant | DetID | PixID | Counts | Sigma | Mean | Median | Sigma |
| A | 8 | 5 | 515184 | 3135.34 | 819 | 805 | 164.1 |
| A | 1 | 162 | 191754 | 1163.91 | 819 | 805 | 164.1 |
| A | 1 | 178 | 112520 | 680.95 | 819 | 805 | 164.1 |
| B | 4 | 239 | 770545 | 4926.28 | 828 | 806 | 156.3 |
| B | 15 | 204 | 40332 | 252.96 | 828 | 806 | 156.3 |
| B | 12 | 111 | 17641 | 107.74 | 828 | 806 | 156.3 |
| C | 8 | 128 | 14123 | 70.78 | 820 | 826 | 187.9 |
| C | 8 | 112 | 5956 | 27.3 | 820 | 826 | 187.9 |
| C | 13 | 61 | 5906 | 27.04 | 820 | 826 | 187.9 |
| D | 1 | 52 | 207770 | 1085.21 | 807 | 789 | 190.7 |
| D | 13 | 104 | 129236 | 673.45 | 807 | 789 | 190.7 |
| D | 8 | 195 | 63518 | 328.89 | 807 | 789 | 190.7 |
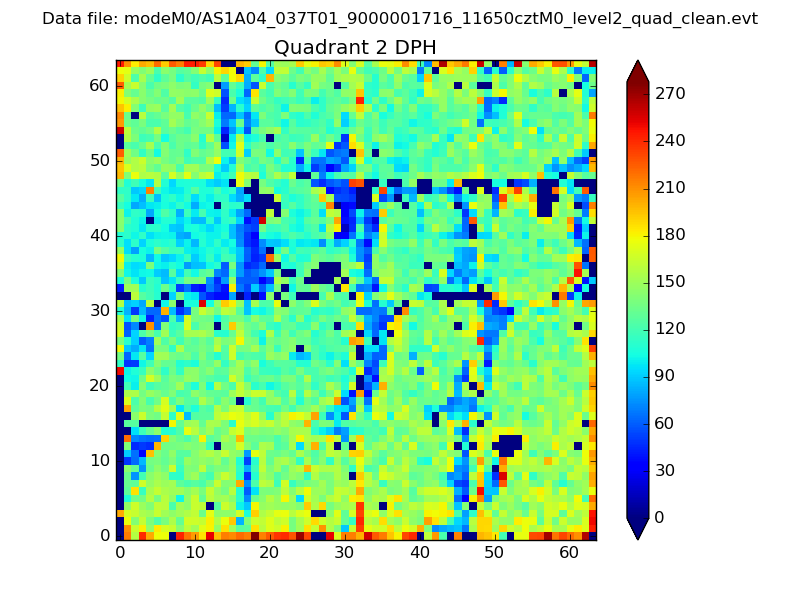
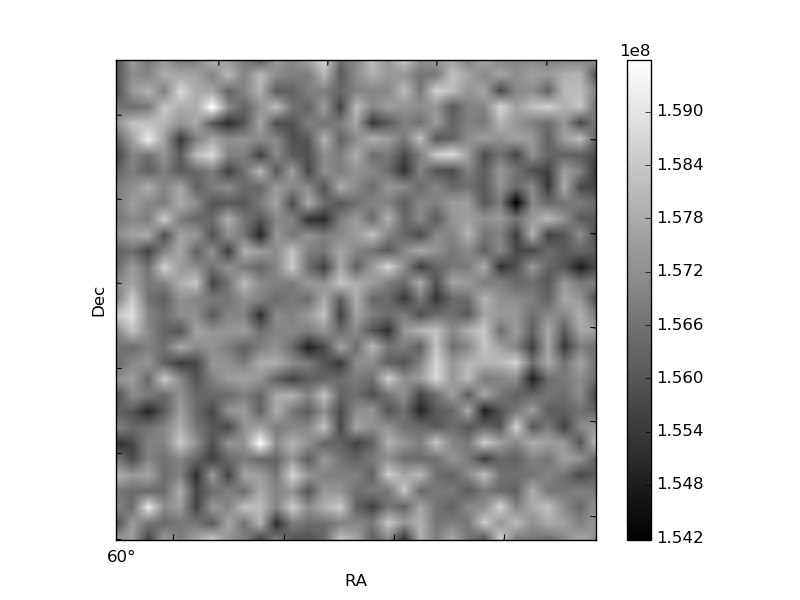
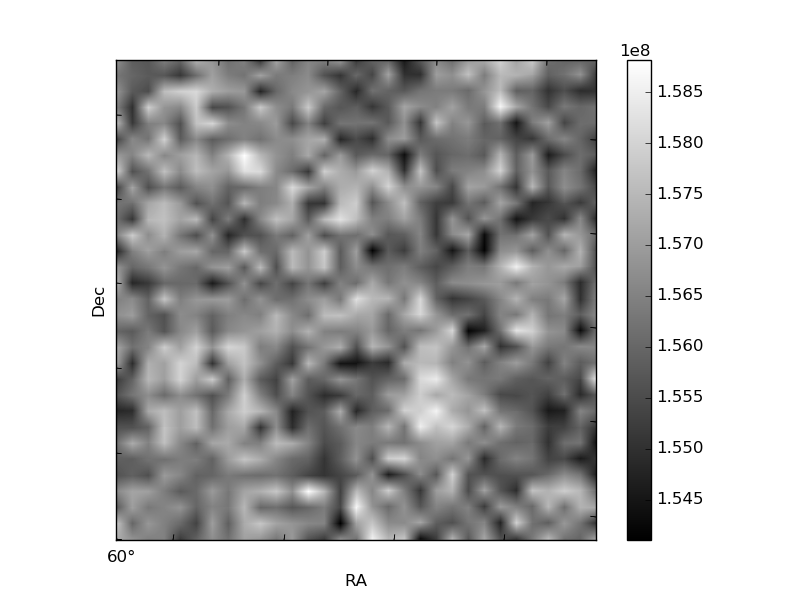
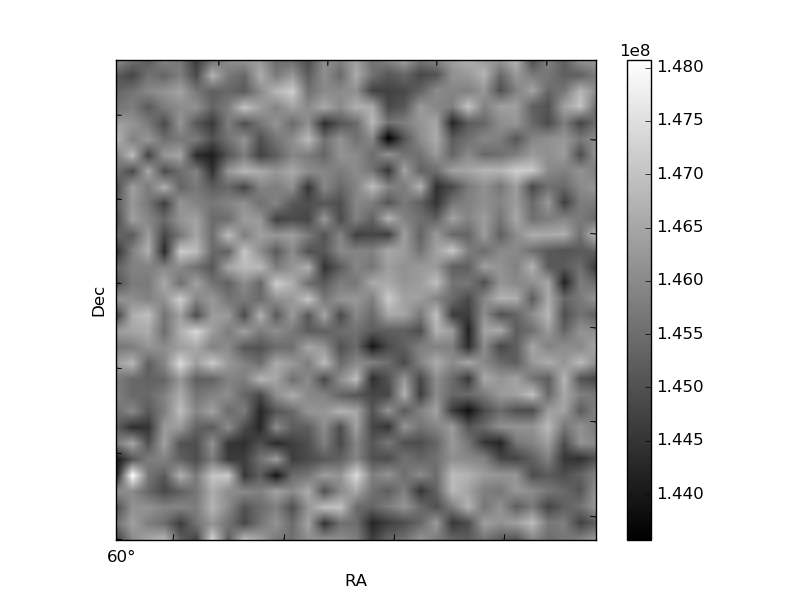
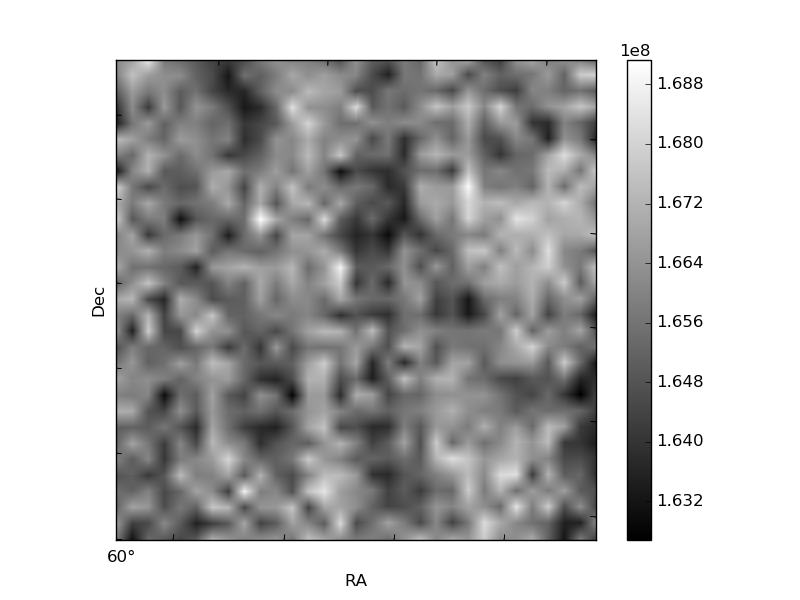
Histogram calculated using DETX and DETY for each event in the final _common_clean file
| Quadrant A | 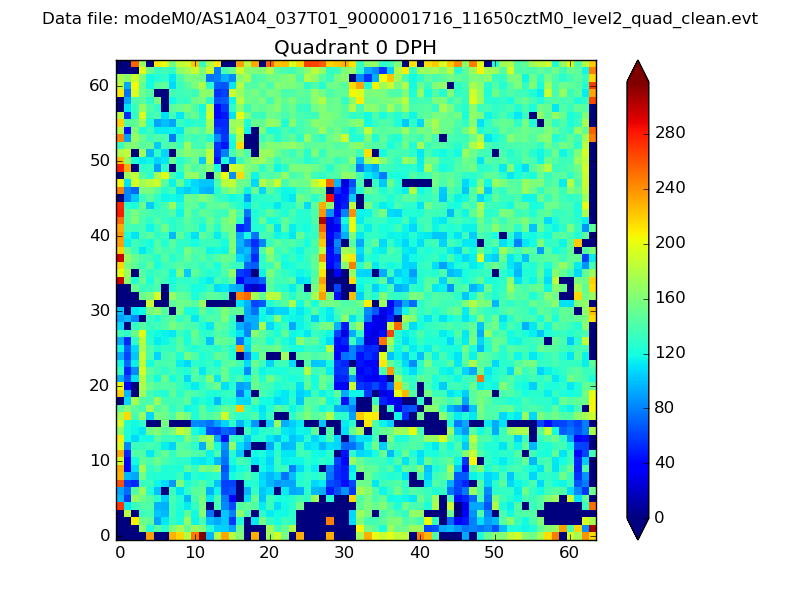 |
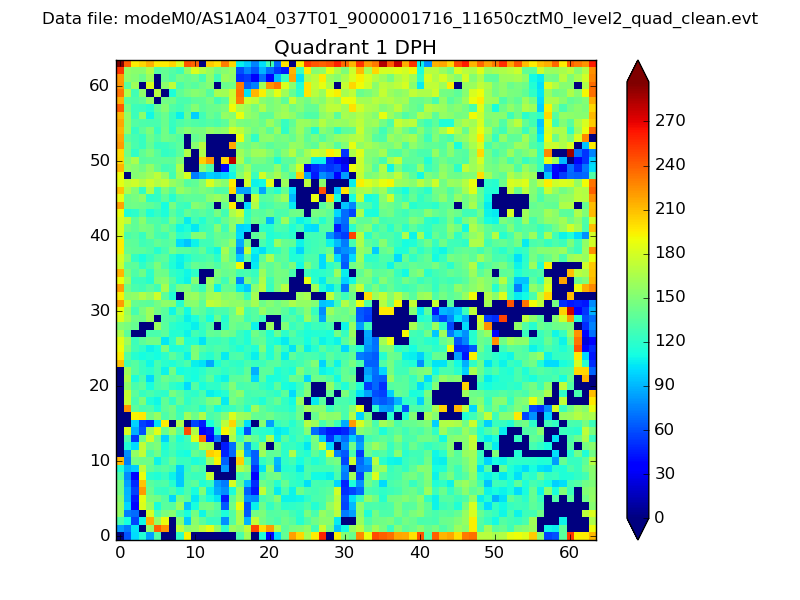 |
Quadrant B |
|---|---|---|---|
| Quadrant D | 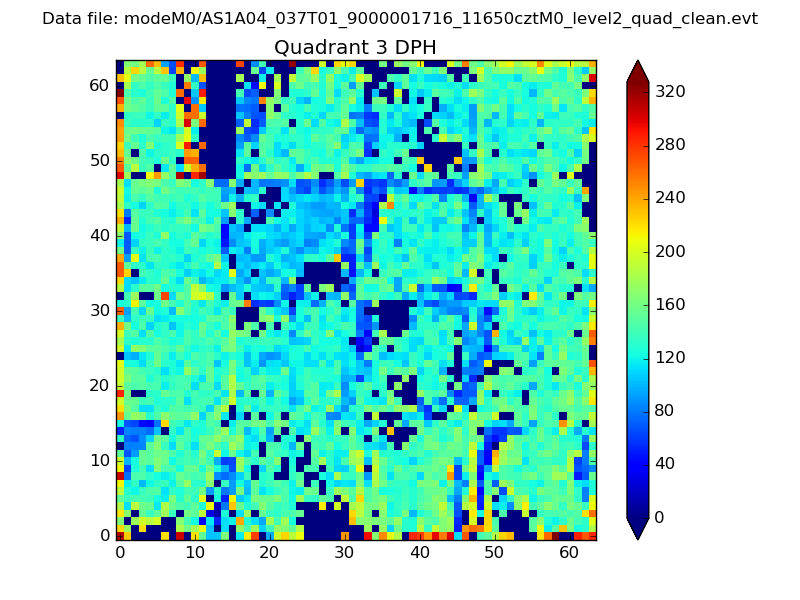 |
 |
Quadrant C |
| Plot type | Count rate plots | Images |
|---|---|---|
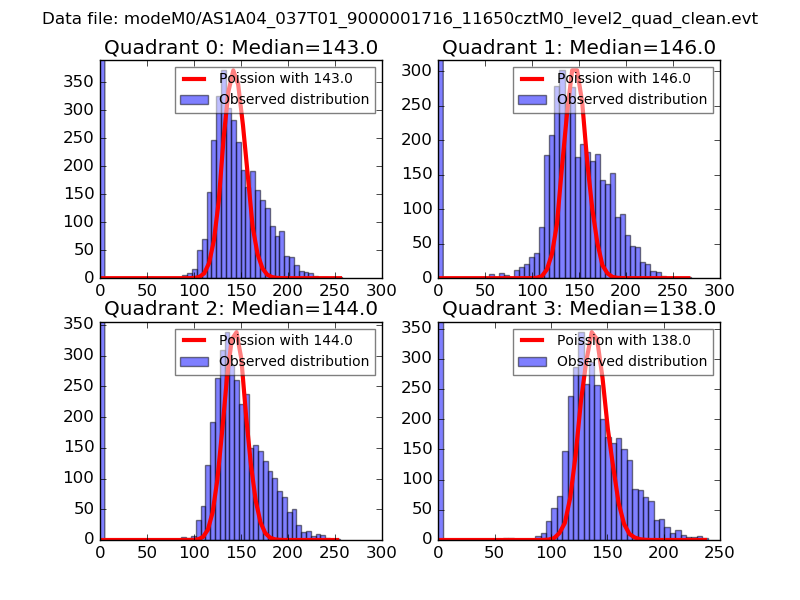
| Comparison with Poisson distribution Blue bars denote a histogram of data divided into 1 sec bins. Red curve is a Poisson curve with rate = median count rate of data. |
 |
 |
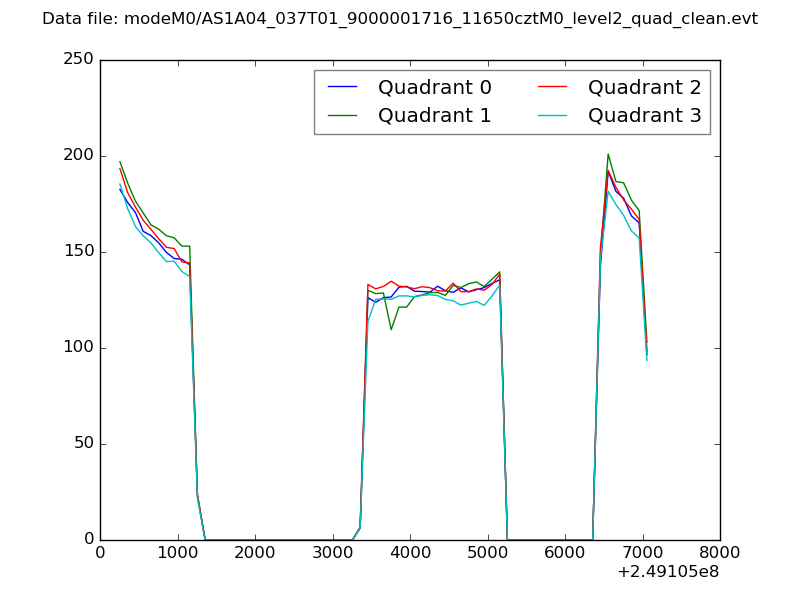
| Quadrant-wise count rates Data is divided into 100 sec bins |
 |
|
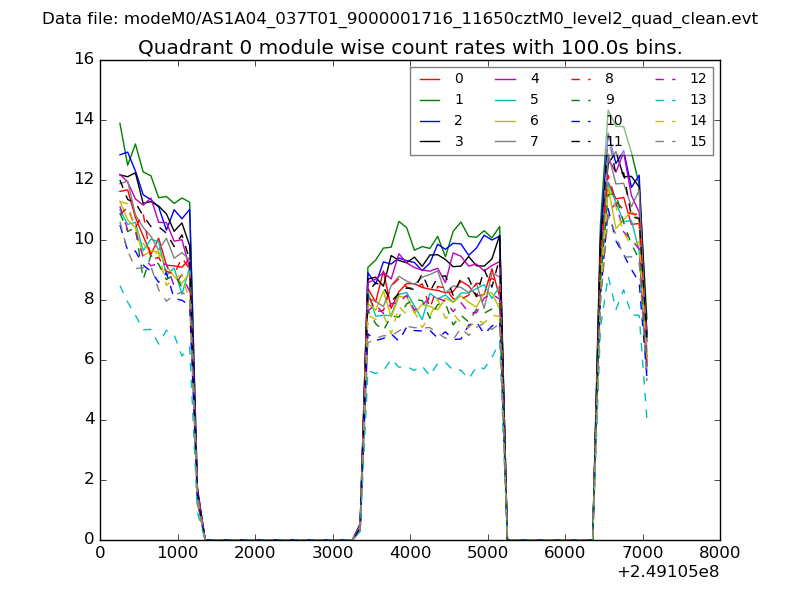
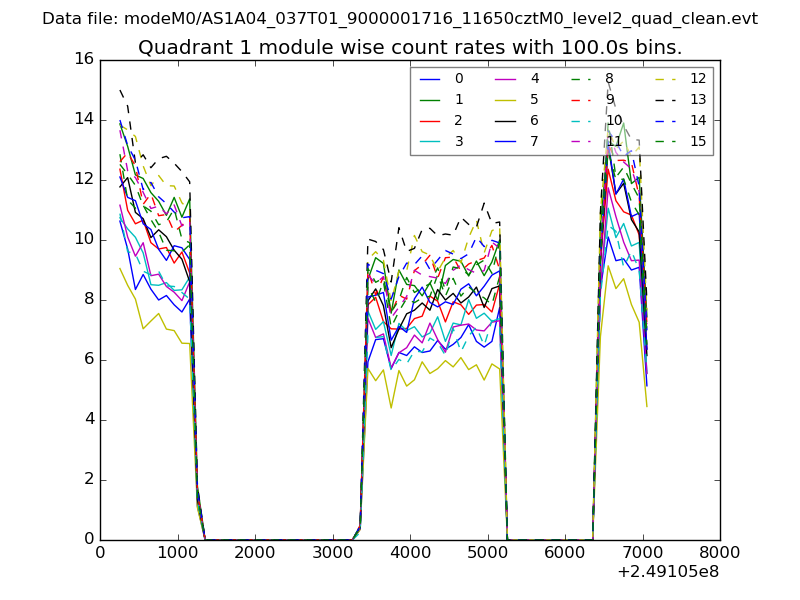
| Module-wise count rates for Quadrant A Data is divided into 100 sec bins |
 |
 |
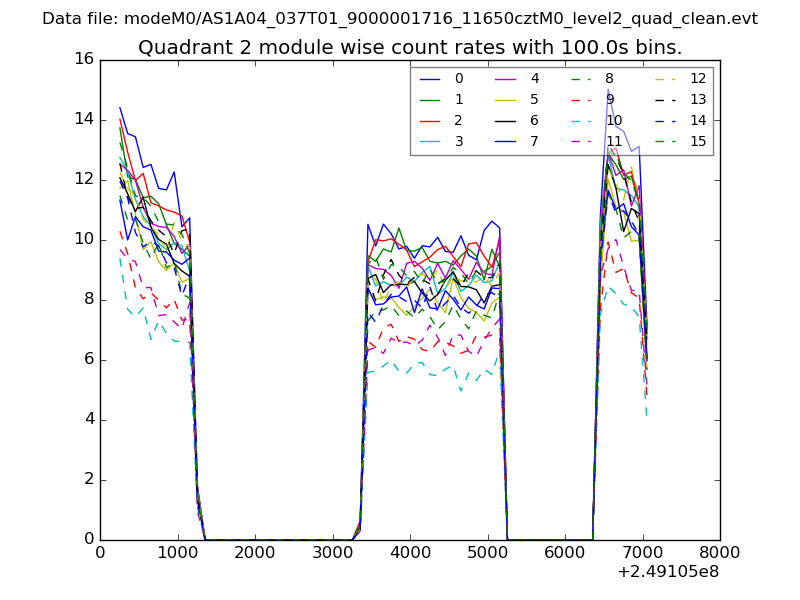
| Module-wise count rates for Quadrant B Data is divided into 100 sec bins |
 |
 |
| Module-wise count rates for Quadrant C Data is divided into 100 sec bins |
 |
 |
| Module-wise count rates for Quadrant D Data is divided into 100 sec bins |
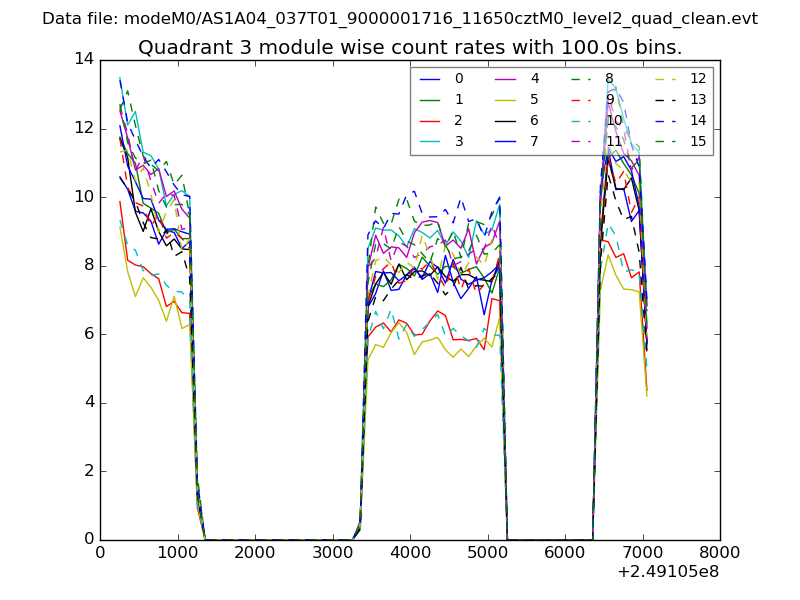 |
 |
| Parameter | Plot |
|---|---|
| CZT HV Monitor | 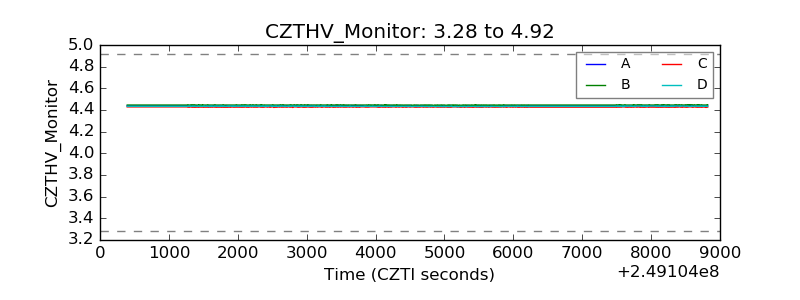 |
| D_VDD | 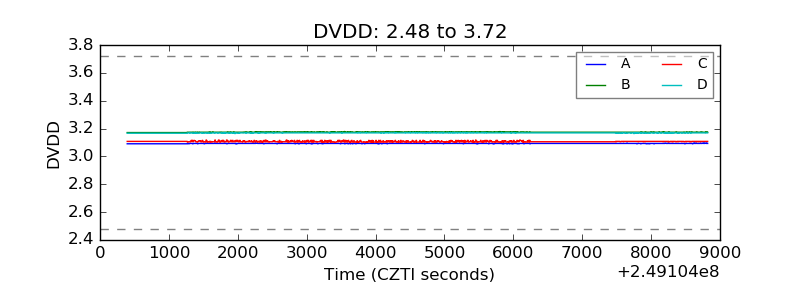 |
| Temperature 1 | 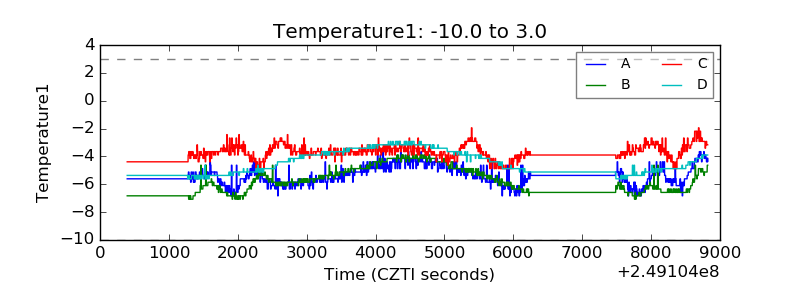 |
| Veto HV Monitor |  |
| Veto LLD | 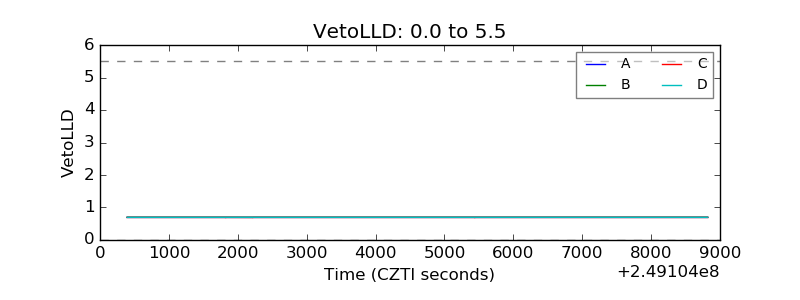 |
| Alpha Counter | 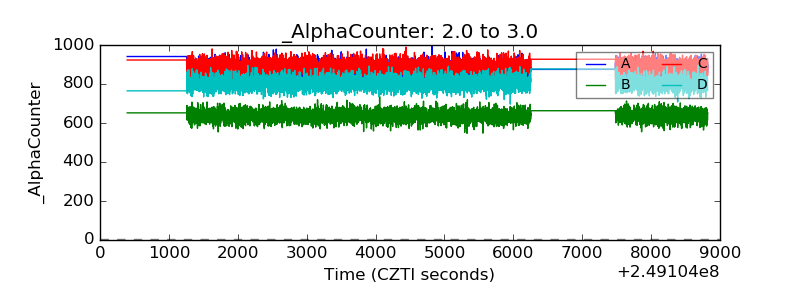 |
| _CPM_Rate | 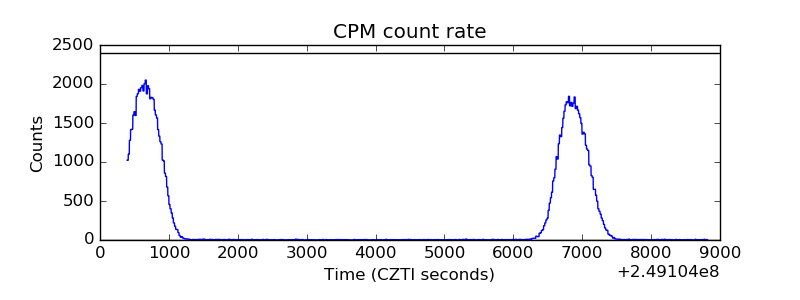 |
| CZT Counter | 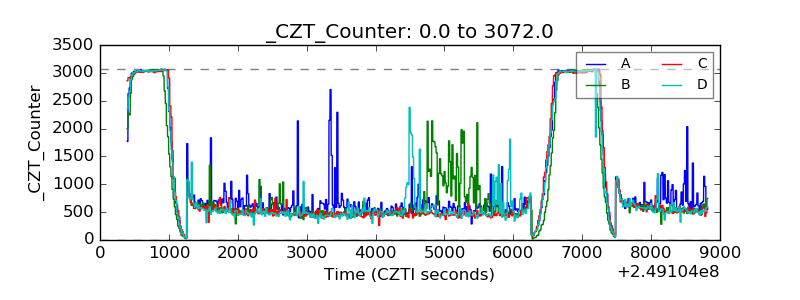 |
| +2.5 Volts monitor |  |
| +5 Volts monitor |  |
| _ROLL_ROT | 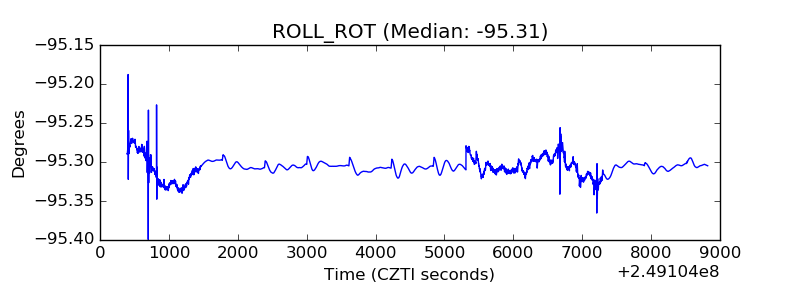 |
| _Roll_DEC |  |
| _Roll_RA | 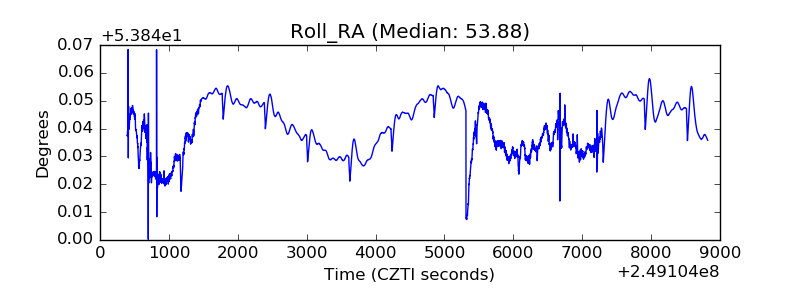 |
| Veto Counter | 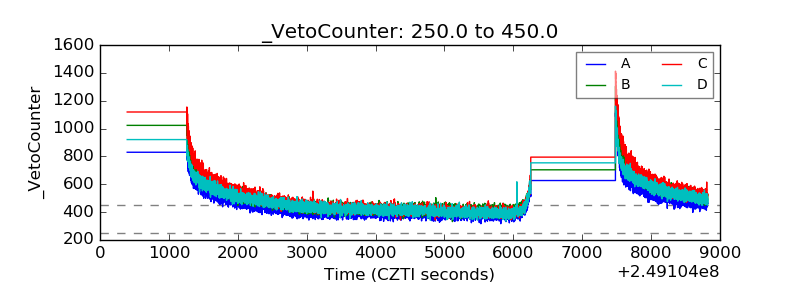 |