| Param | Original file | Final file |
|---|---|---|
| Filename | modeM0/AS1A04_037T01_9000001716_11651cztM0_level2.evt | modeM0/AS1A04_037T01_9000001716_11651cztM0_level2_quad_clean.evt |
| Size (bytes) | 524,790,720 | 72,866,880 |
| Size | 500.5 MB | 69.5 MB |
| Events in quadrant A | 4,759,005 | 432,510 |
| Events in quadrant B | 3,595,286 | 456,308 |
| Events in quadrant C | 3,270,915 | 449,492 |
| Events in quadrant D | 3,838,418 | 425,633 |
| Mode SS | |||
|---|---|---|---|
| Quadrant | BADHDUFLAG | Total packets | Discarded packets |
| A | 0 | 128 | 0 |
| B | 0 | 128 | 0 |
| C | 0 | 128 | 0 |
| D | 0 | 128 | 0 |
| Mode M9 | |||
|---|---|---|---|
| Quadrant | BADHDUFLAG | Total packets | Discarded packets |
| A | 0 | 17 | 0 |
| B | 0 | 17 | 0 |
| C | 0 | 17 | 0 |
| D | 0 | 18 | 0 |
| Mode M0 | |||
|---|---|---|---|
| Quadrant | BADHDUFLAG | Total packets | Discarded packets |
| A | 0 | 18689 | 3 |
| B | 0 | 14404 | 2 |
| C | 0 | 13570 | 2 |
| D | 0 | 15279 | 2 |
| Quadrant | Total seconds | Saturated seconds | Saturation percentage |
|---|---|---|---|
| A | 6340 | 333 | 5.252366% |
| B | 6340 | 143 | 2.255521% |
| C | 6340 | 86 | 1.356467% |
| D | 6340 | 136 | 2.145110% |
Noise dominated data is calculated using 1-second bins in cleaned event files. If a bin has >2000 counts, and if more than 50% of those come from <1% of pixels, then it is considered to be noise-dominated and hence unusable.
| Quadrant | # 1 sec bins | Bins with >0 counts | Bins with >2000 counts | High rate bins dominated by noise | Noise dominated (total time) | Noise dominated (detector-on time) | Marked lightcurve |
|---|---|---|---|---|---|---|---|
| A | 7611 | 6342 | 132 | 132 | 1.73% | 2.08% | 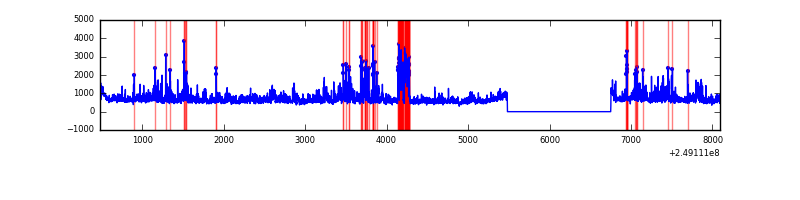 |
| B | 7611 | 6342 | 16 | 16 | 0.21% | 0.25% | 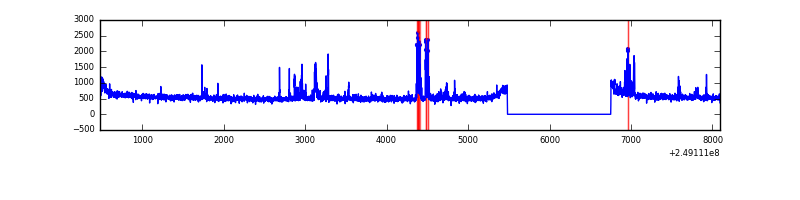 |
| C | 7611 | 6342 | 0 | 0 | 0.00% | 0.00% | 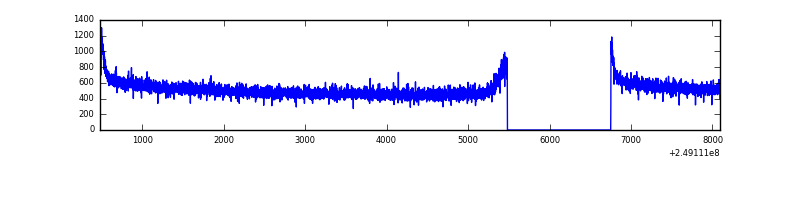 |
| D | 7611 | 6342 | 59 | 59 | 0.78% | 0.93% | 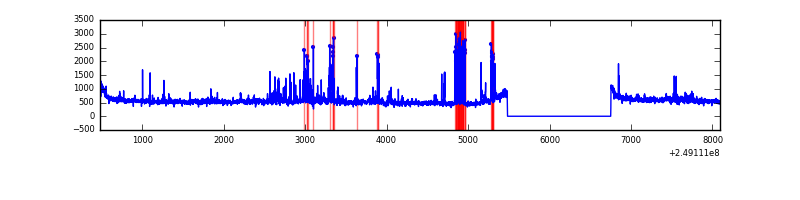 |
Top three noisy pixels from each quadrant. If the there are fewer than three noisy pixels in the level2.evt file, extra rows are filled as -1
| Pixel properties | Quadrant properties | ||||||
|---|---|---|---|---|---|---|---|
| Quadrant | DetID | PixID | Counts | Sigma | Mean | Median | Sigma |
| A | 8 | 5 | 949701 | 5680.5 | 834 | 821 | 167.0 |
| A | 1 | 162 | 222359 | 1326.24 | 834 | 821 | 167.0 |
| A | 1 | 178 | 130792 | 778.08 | 834 | 821 | 167.0 |
| B | 4 | 239 | 220662 | 1388.25 | 849 | 829 | 158.4 |
| B | 15 | 204 | 54864 | 341.23 | 849 | 829 | 158.4 |
| B | 12 | 111 | 18093 | 109.02 | 849 | 829 | 158.4 |
| C | 13 | 61 | 5986 | 26.77 | 838 | 844 | 192.1 |
| C | 3 | 202 | 2073 | 6.4 | 838 | 844 | 192.1 |
| C | 12 | 4 | 1950 | 5.76 | 838 | 844 | 192.1 |
| D | 1 | 52 | 311577 | 1573.24 | 826 | 806 | 197.5 |
| D | 8 | 195 | 145258 | 731.27 | 826 | 806 | 197.5 |
| D | 13 | 122 | 83711 | 419.7 | 826 | 806 | 197.5 |
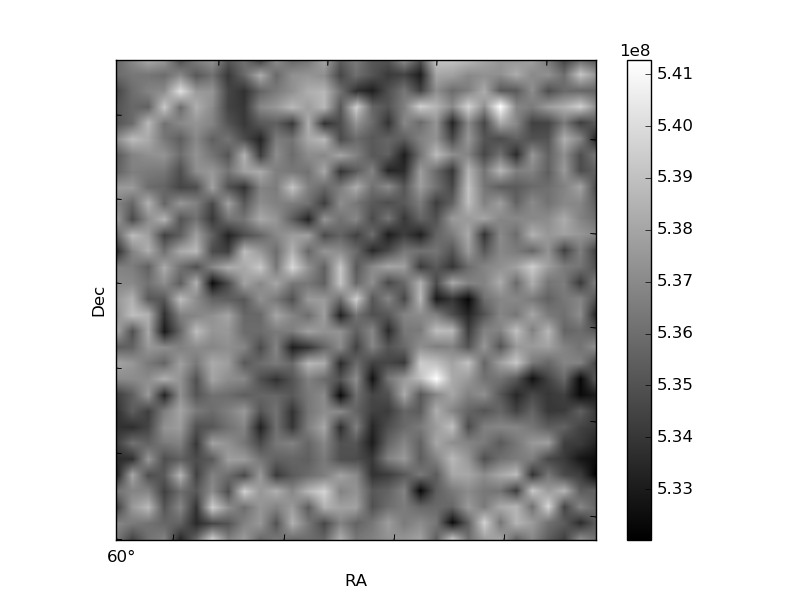
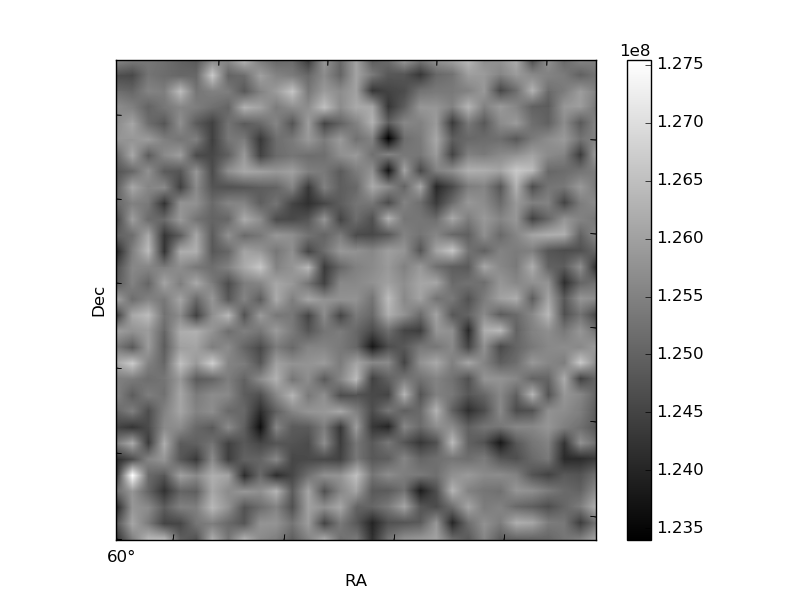
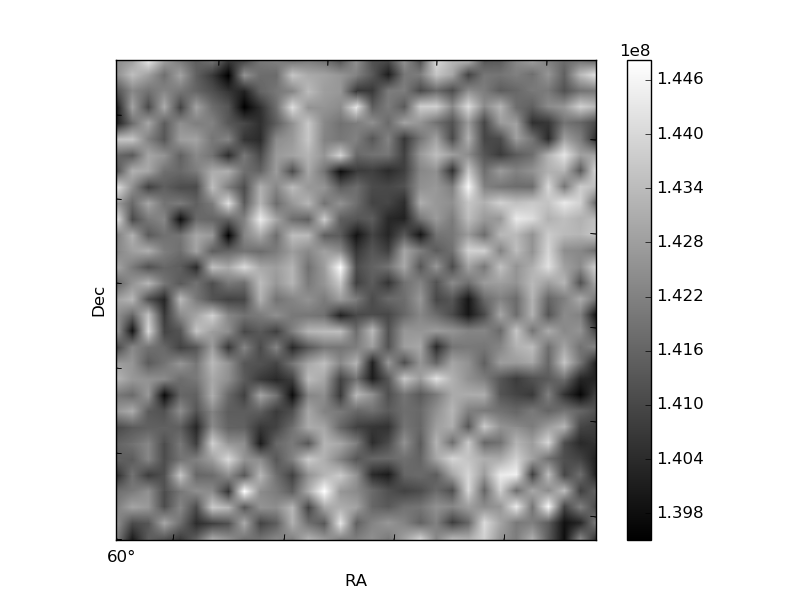
Histogram calculated using DETX and DETY for each event in the final _common_clean file
| Quadrant A | 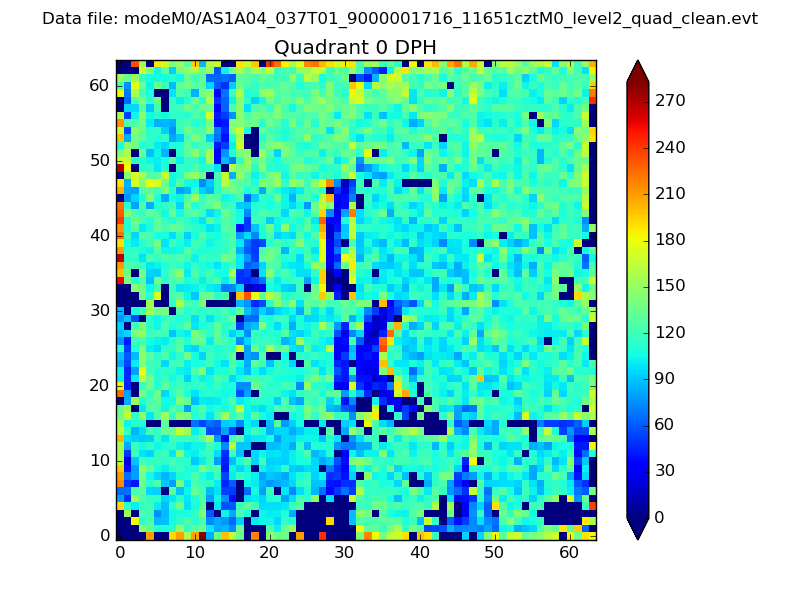 |
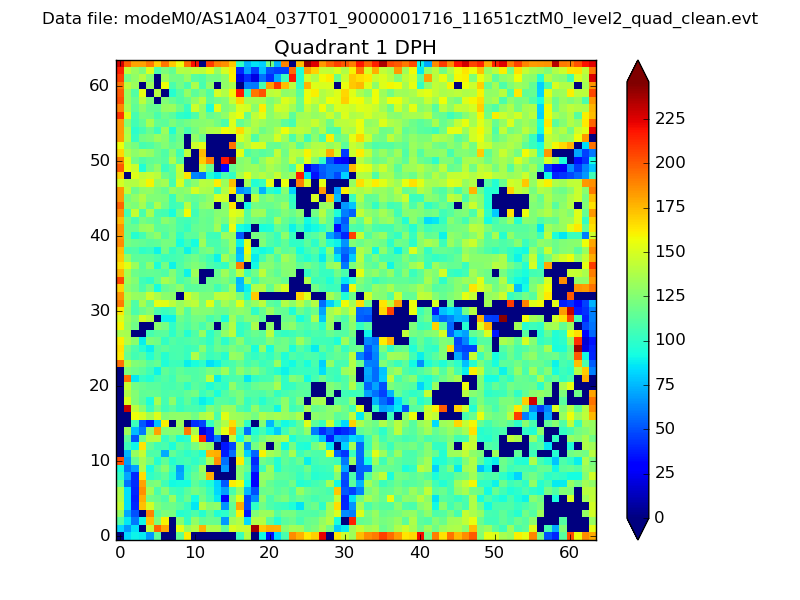 |
Quadrant B |
|---|---|---|---|
| Quadrant D | 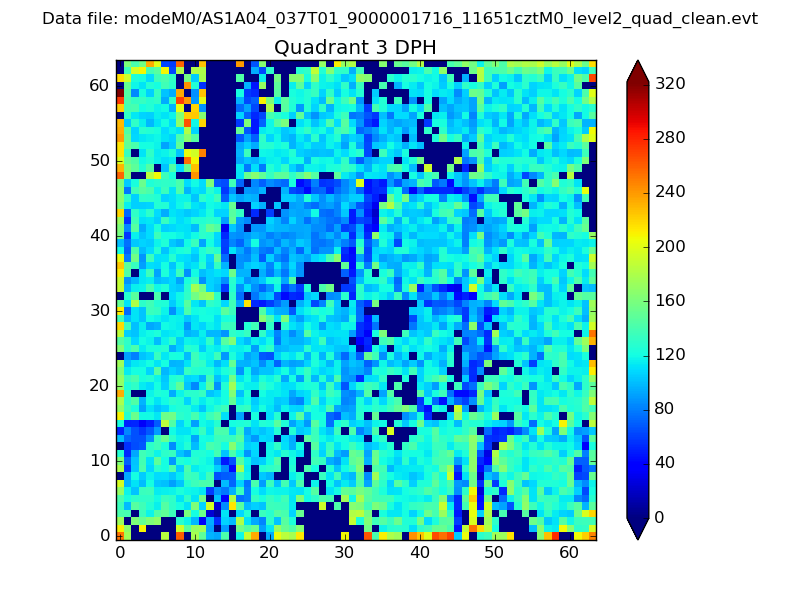 |
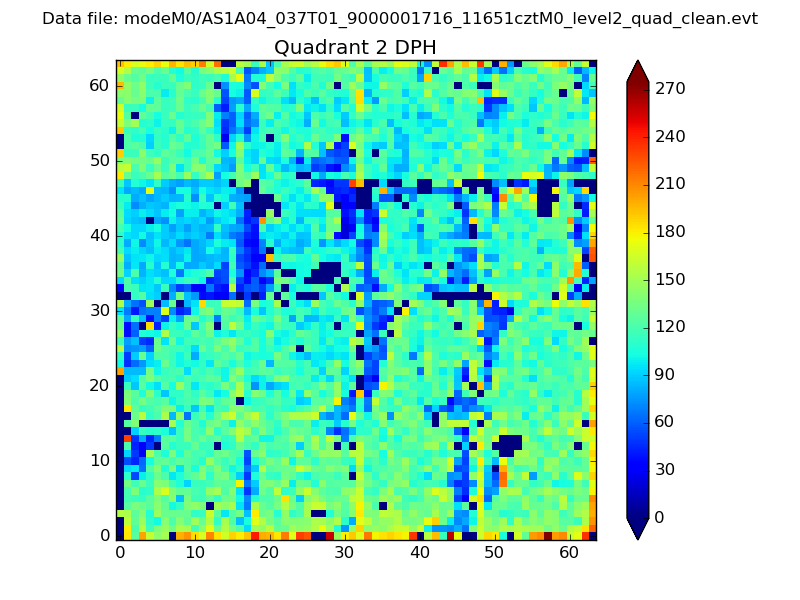 |
Quadrant C |
| Plot type | Count rate plots | Images |
|---|---|---|
| Comparison with Poisson distribution Blue bars denote a histogram of data divided into 1 sec bins. Red curve is a Poisson curve with rate = median count rate of data. |
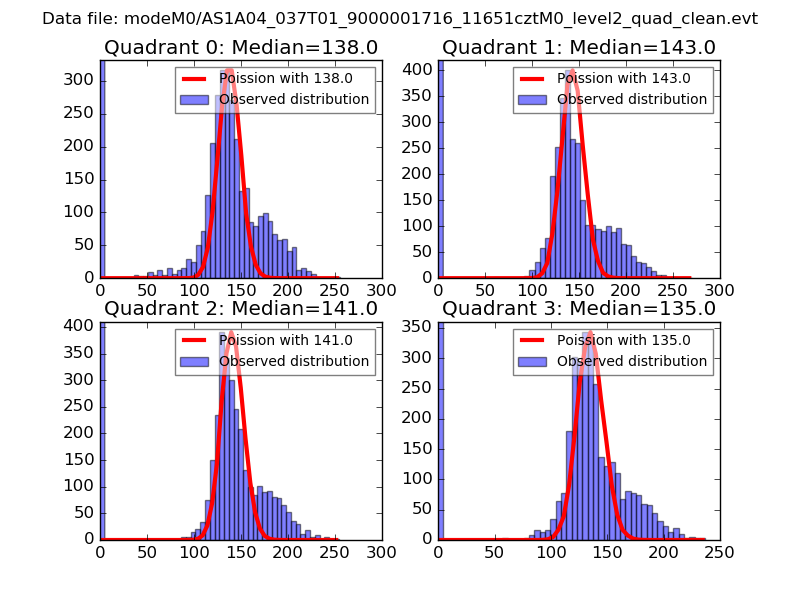 |
 |
| Quadrant-wise count rates Data is divided into 100 sec bins |
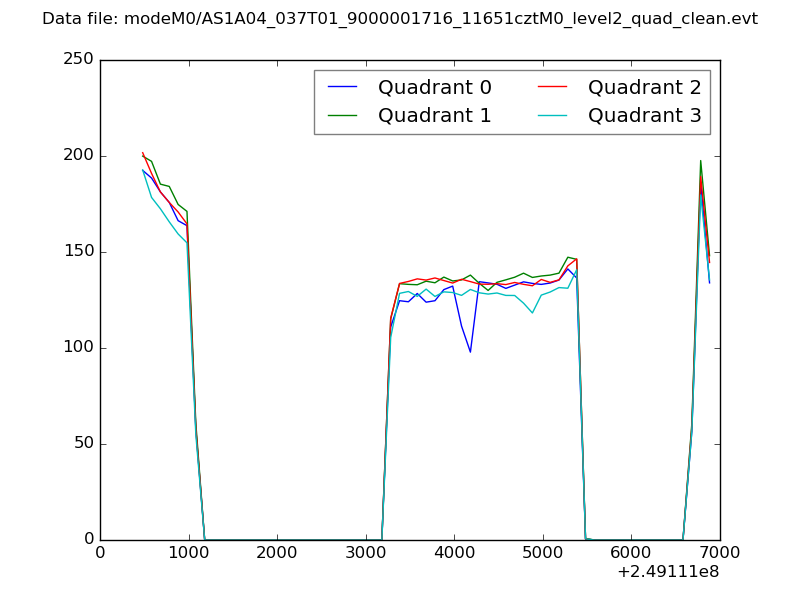 |
|
| Module-wise count rates for Quadrant A Data is divided into 100 sec bins |
 |
 |
| Module-wise count rates for Quadrant B Data is divided into 100 sec bins |
 |
 |
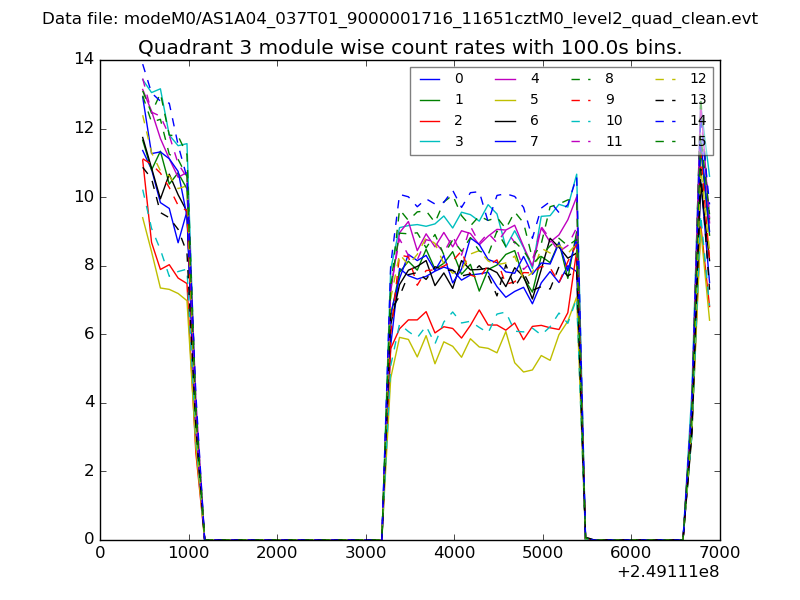
| Module-wise count rates for Quadrant C Data is divided into 100 sec bins |
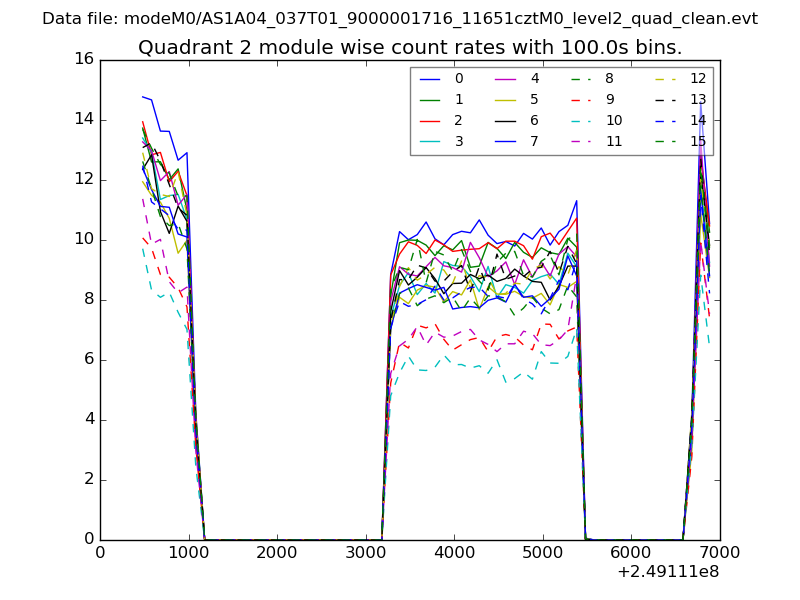 |
 |
| Module-wise count rates for Quadrant D Data is divided into 100 sec bins |
 |
 |
| Parameter | Plot |
|---|---|
| CZT HV Monitor | 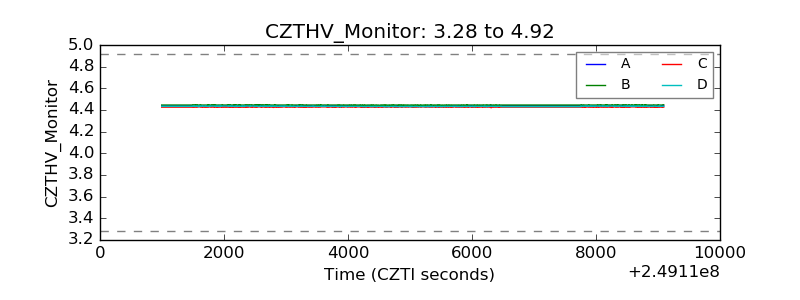 |
| D_VDD | 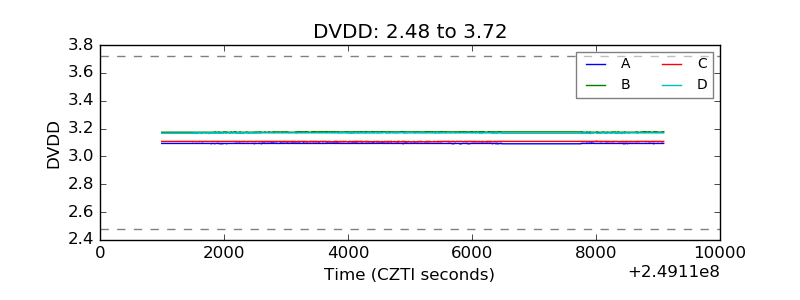 |
| Temperature 1 | 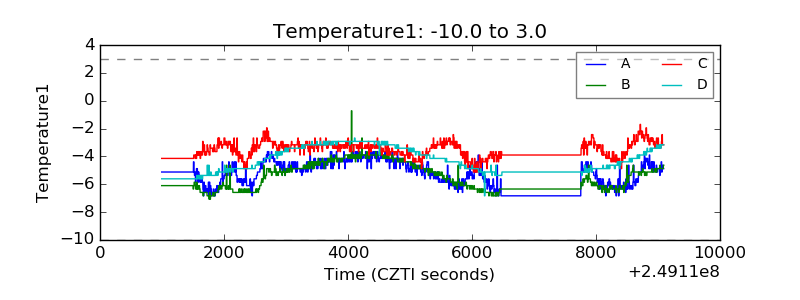 |
| Veto HV Monitor | 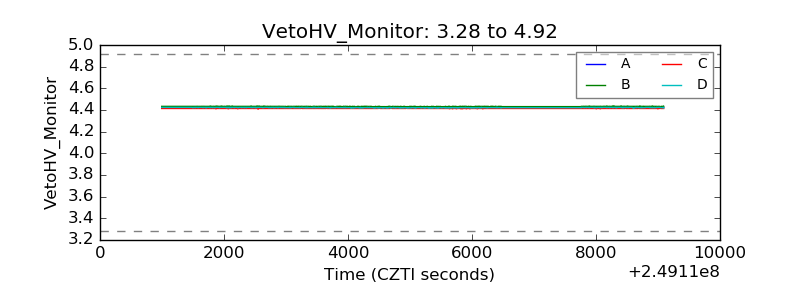 |
| Veto LLD | 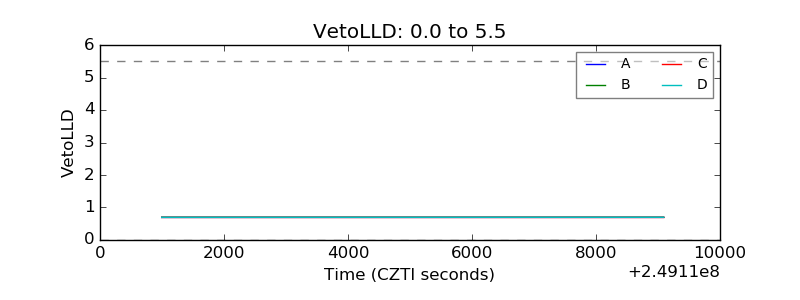 |
| Alpha Counter | 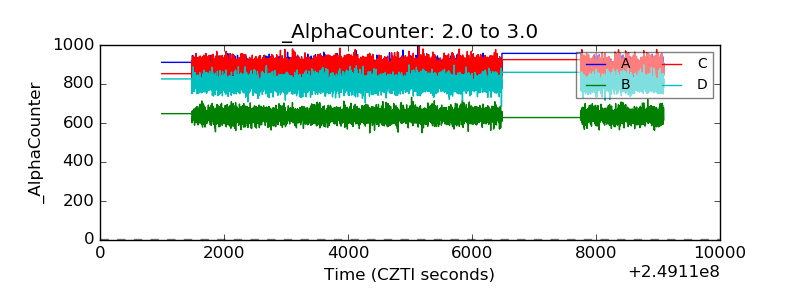 |
| _CPM_Rate | 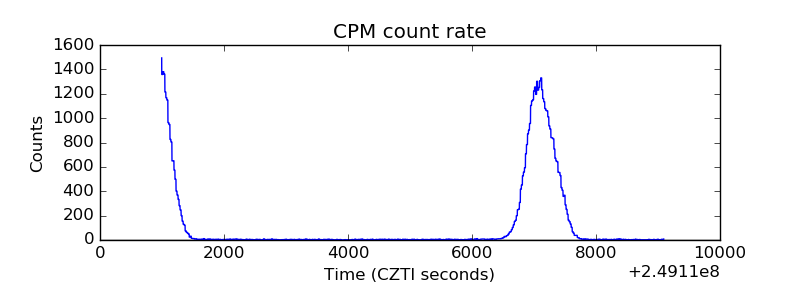 |
| CZT Counter | 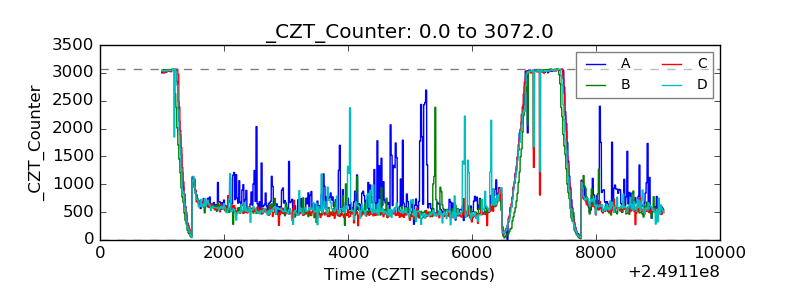 |
| +2.5 Volts monitor |  |
| +5 Volts monitor |  |
| _ROLL_ROT | 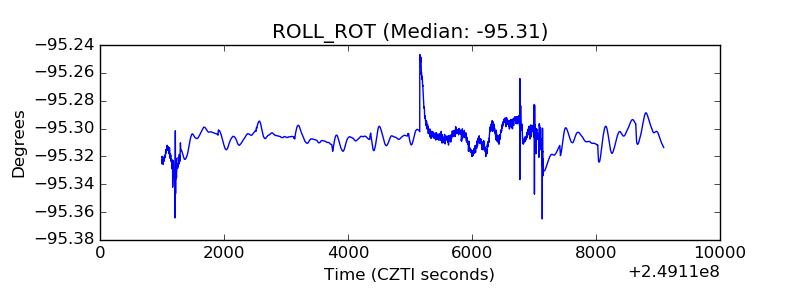 |
| _Roll_DEC | 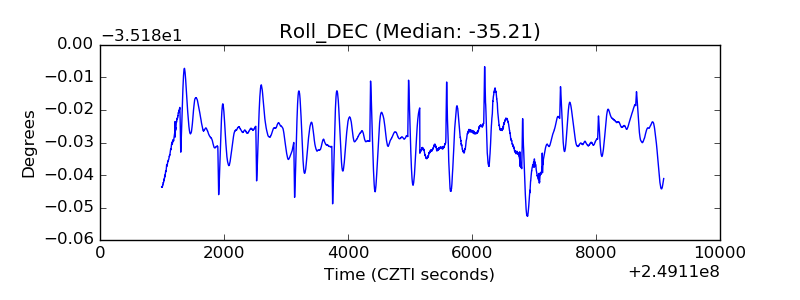 |
| _Roll_RA | 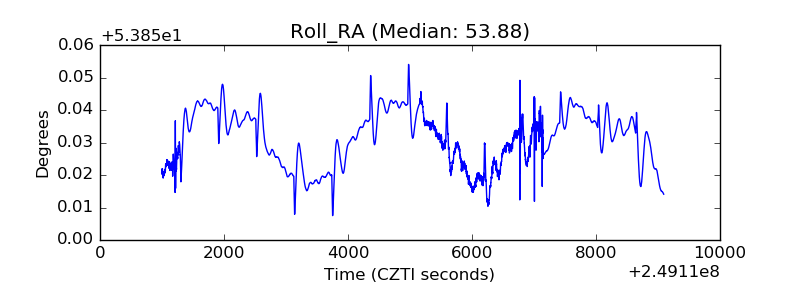 |
| Veto Counter |  |