| Param | Original file | Final file |
|---|---|---|
| Filename | modeM0/AS1A04_037T01_9000001716_11652cztM0_level2.evt | modeM0/AS1A04_037T01_9000001716_11652cztM0_level2_quad_clean.evt |
| Size (bytes) | 513,673,920 | 66,075,840 |
| Size | 489.9 MB | 63.0 MB |
| Events in quadrant A | 4,565,851 | 385,000 |
| Events in quadrant B | 3,627,380 | 400,864 |
| Events in quadrant C | 3,220,331 | 395,948 |
| Events in quadrant D | 3,714,236 | 377,301 |
| Mode SS | |||
|---|---|---|---|
| Quadrant | BADHDUFLAG | Total packets | Discarded packets |
| A | 0 | 128 | 0 |
| B | 0 | 128 | 0 |
| C | 0 | 128 | 0 |
| D | 0 | 128 | 0 |
| Mode M9 | |||
|---|---|---|---|
| Quadrant | BADHDUFLAG | Total packets | Discarded packets |
| A | 0 | 12 | 0 |
| B | 0 | 12 | 0 |
| C | 0 | 12 | 0 |
| D | 0 | 13 | 0 |
| Mode M0 | |||
|---|---|---|---|
| Quadrant | BADHDUFLAG | Total packets | Discarded packets |
| A | 0 | 18018 | 3 |
| B | 0 | 14484 | 2 |
| C | 0 | 13435 | 2 |
| D | 0 | 14846 | 2 |
| Quadrant | Total seconds | Saturated seconds | Saturation percentage |
|---|---|---|---|
| A | 6325 | 254 | 4.015810% |
| B | 6325 | 172 | 2.719368% |
| C | 6325 | 116 | 1.833992% |
| D | 6325 | 134 | 2.118577% |
Noise dominated data is calculated using 1-second bins in cleaned event files. If a bin has >2000 counts, and if more than 50% of those come from <1% of pixels, then it is considered to be noise-dominated and hence unusable.
| Quadrant | # 1 sec bins | Bins with >0 counts | Bins with >2000 counts | High rate bins dominated by noise | Noise dominated (total time) | Noise dominated (detector-on time) | Marked lightcurve |
|---|---|---|---|---|---|---|---|
| A | 7531 | 6326 | 33 | 33 | 0.44% | 0.52% | 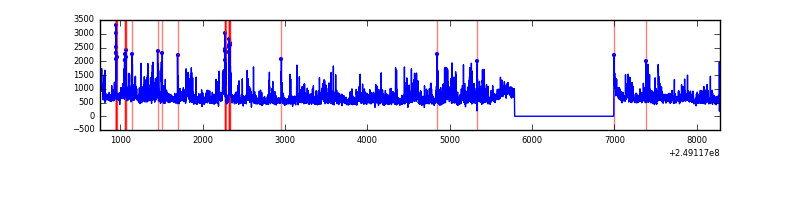 |
| B | 7531 | 6326 | 16 | 16 | 0.21% | 0.25% |  |
| C | 7531 | 6326 | 0 | 0 | 0.00% | 0.00% | 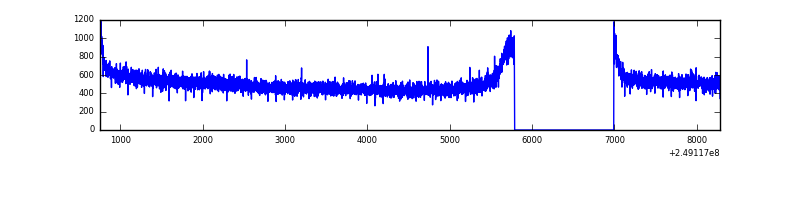 |
| D | 7531 | 6326 | 14 | 14 | 0.19% | 0.22% | 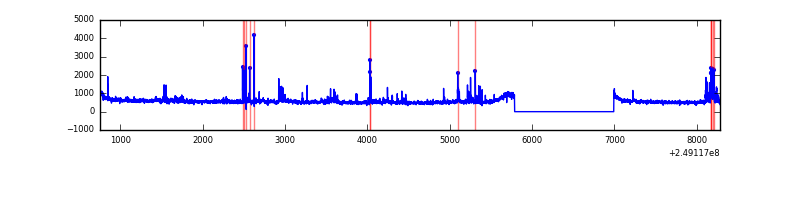 |
Top three noisy pixels from each quadrant. If the there are fewer than three noisy pixels in the level2.evt file, extra rows are filled as -1
| Pixel properties | Quadrant properties | ||||||
|---|---|---|---|---|---|---|---|
| Quadrant | DetID | PixID | Counts | Sigma | Mean | Median | Sigma |
| A | 8 | 5 | 786540 | 4676.22 | 829 | 811 | 168.0 |
| A | 1 | 162 | 225993 | 1340.16 | 829 | 811 | 168.0 |
| A | 1 | 178 | 128196 | 758.12 | 829 | 811 | 168.0 |
| B | 4 | 239 | 274821 | 1733.05 | 837 | 819 | 158.1 |
| B | 15 | 204 | 69305 | 433.17 | 837 | 819 | 158.1 |
| B | 12 | 111 | 18151 | 109.62 | 837 | 819 | 158.1 |
| C | 13 | 61 | 6055 | 27.7 | 825 | 830 | 188.6 |
| C | 12 | 4 | 3106 | 12.07 | 825 | 830 | 188.6 |
| C | 14 | 234 | 1985 | 6.12 | 825 | 830 | 188.6 |
| D | 8 | 195 | 253582 | 1300.85 | 817 | 795 | 194.3 |
| D | 13 | 104 | 94705 | 483.26 | 817 | 795 | 194.3 |
| D | 1 | 52 | 78766 | 401.24 | 817 | 795 | 194.3 |
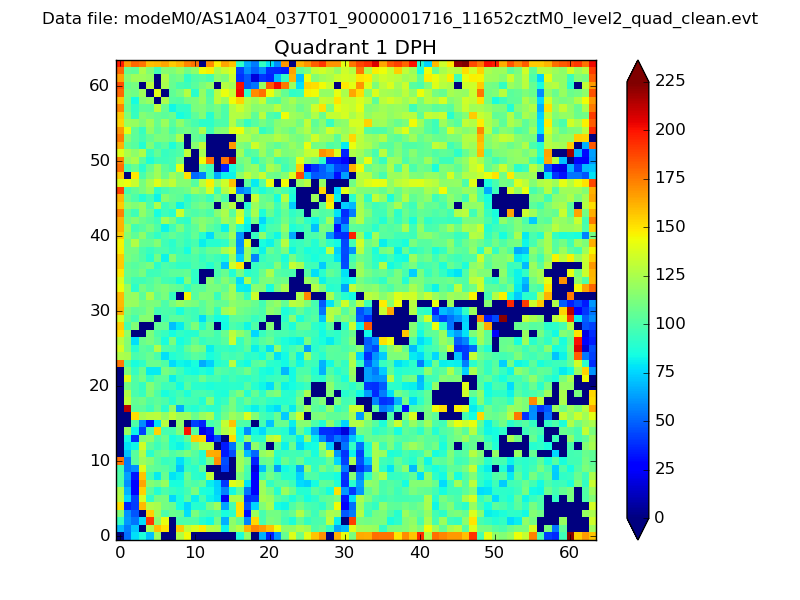
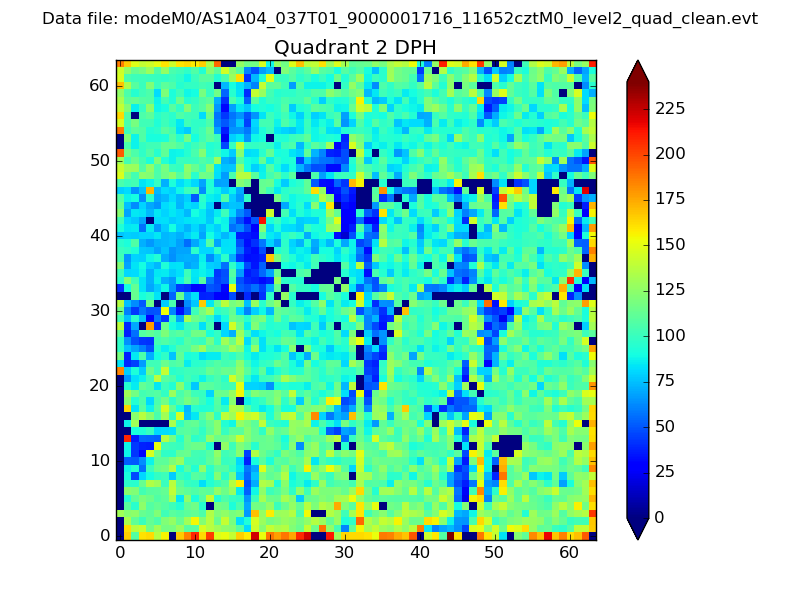
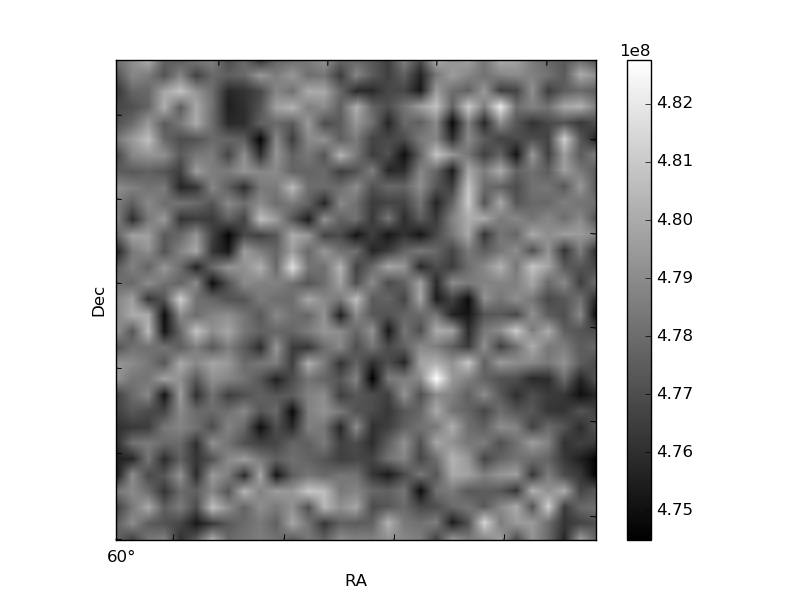
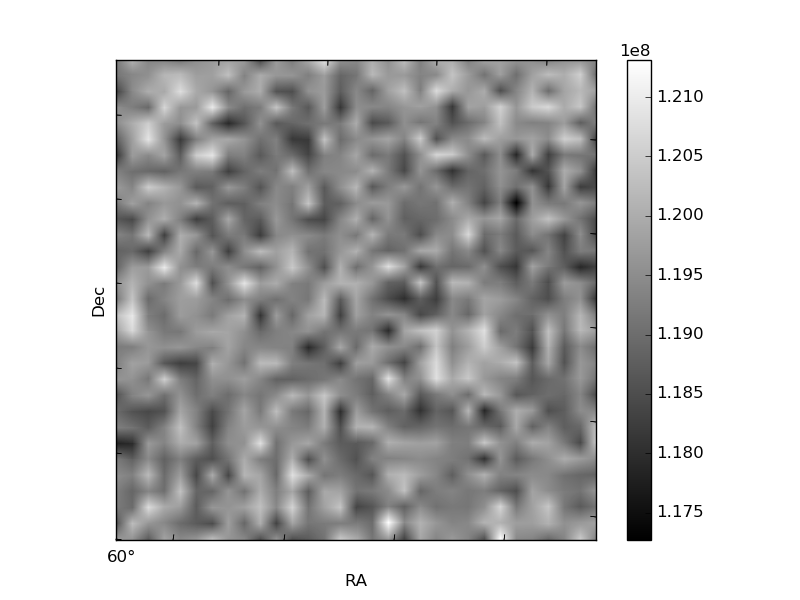
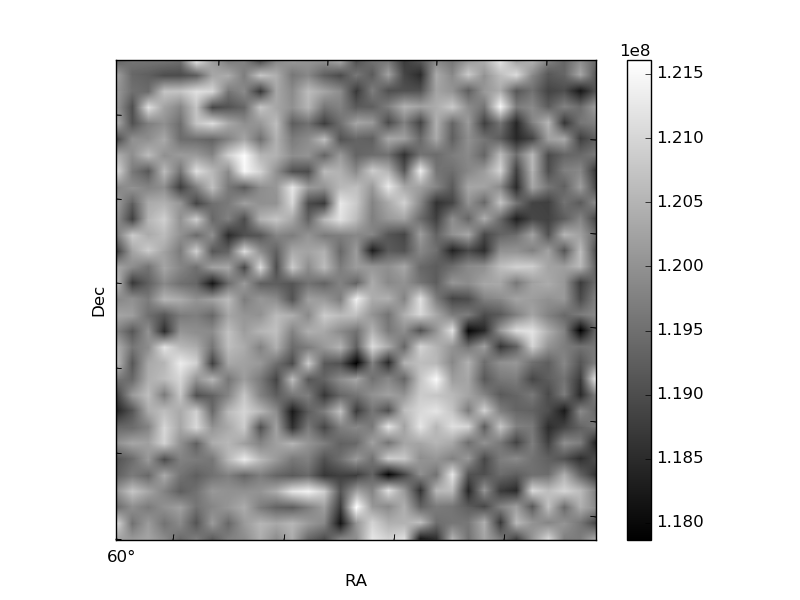
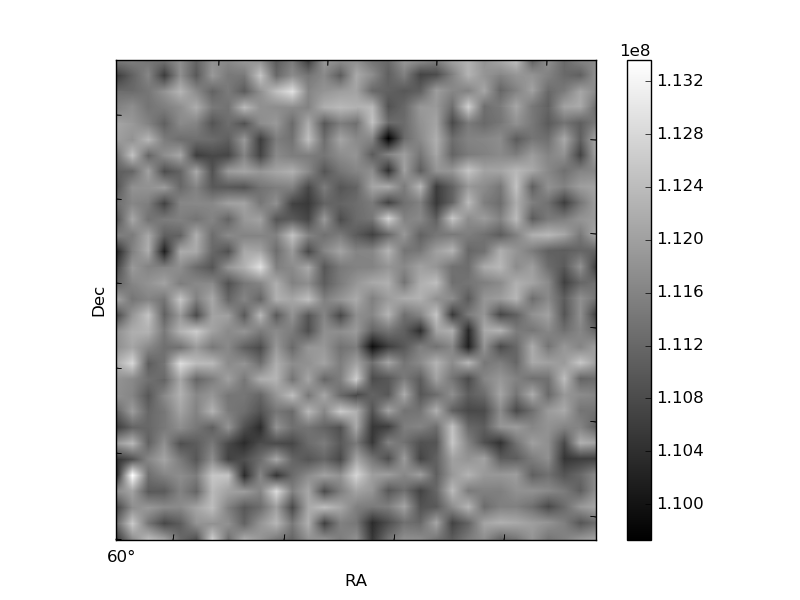
Histogram calculated using DETX and DETY for each event in the final _common_clean file
| Quadrant A | 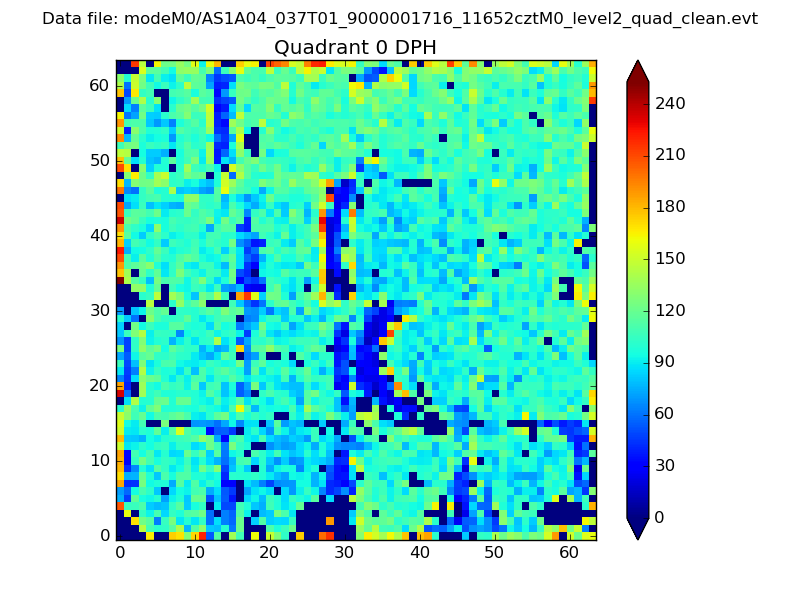 |
 |
Quadrant B |
|---|---|---|---|
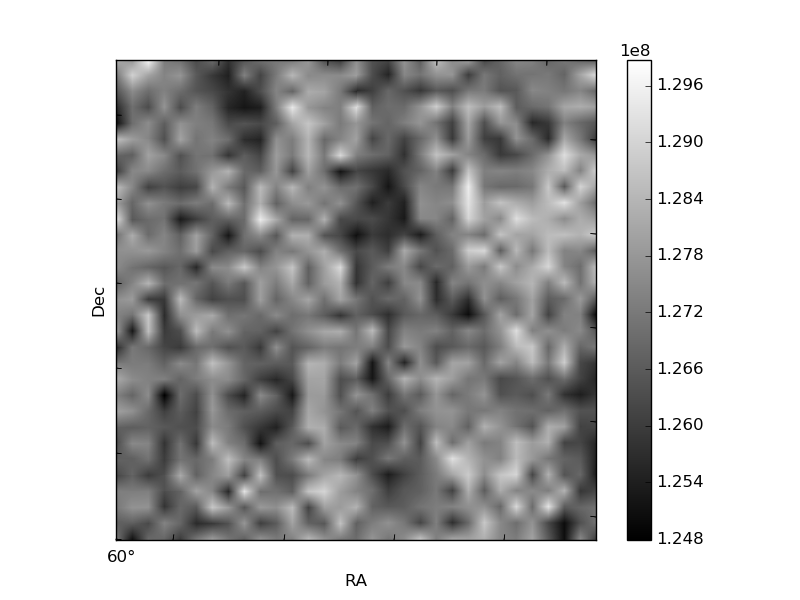
| Quadrant D | 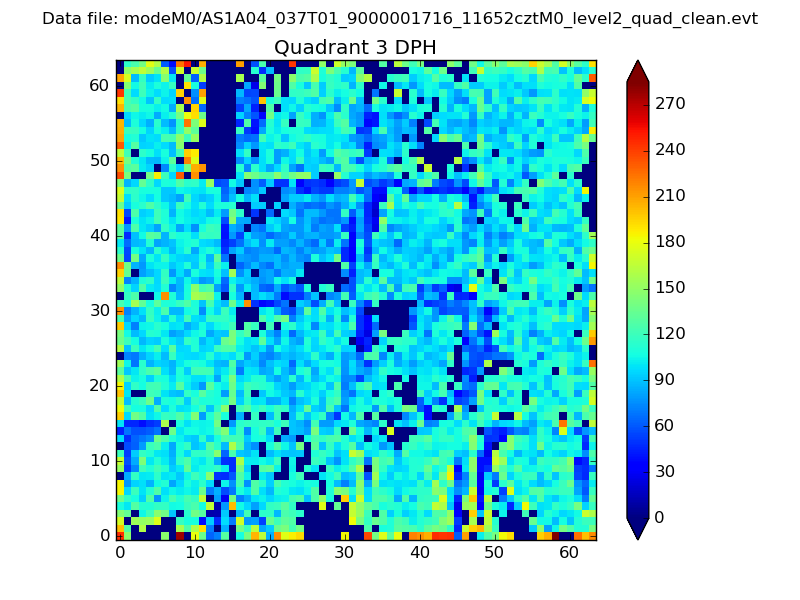 |
 |
Quadrant C |
| Plot type | Count rate plots | Images |
|---|---|---|
| Comparison with Poisson distribution Blue bars denote a histogram of data divided into 1 sec bins. Red curve is a Poisson curve with rate = median count rate of data. |
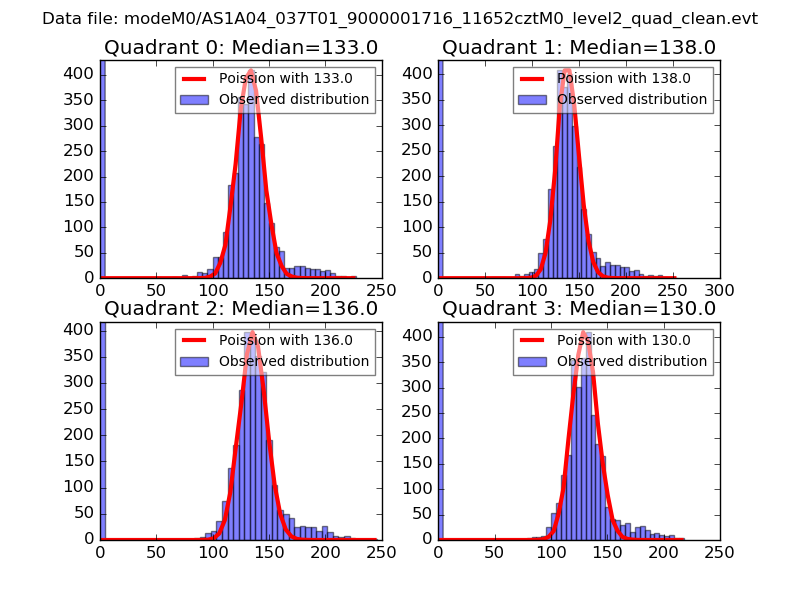 |
 |
| Quadrant-wise count rates Data is divided into 100 sec bins |
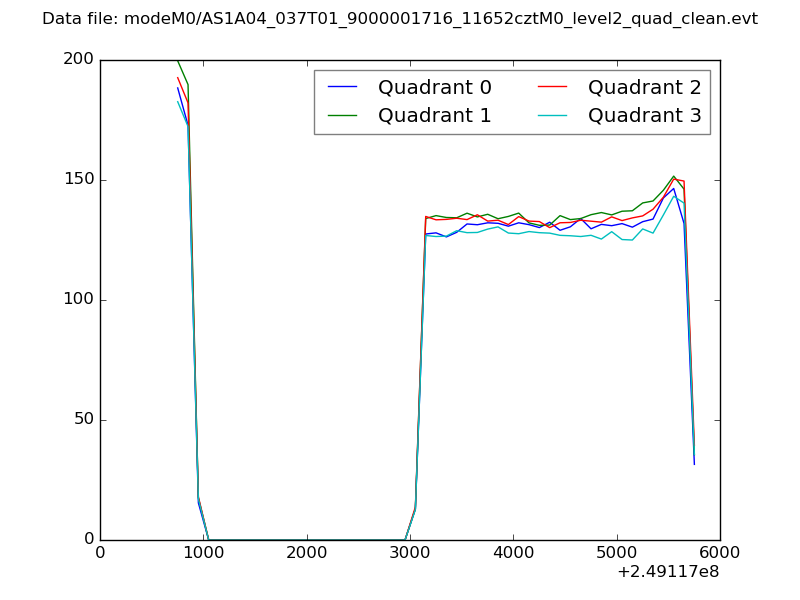 |
|
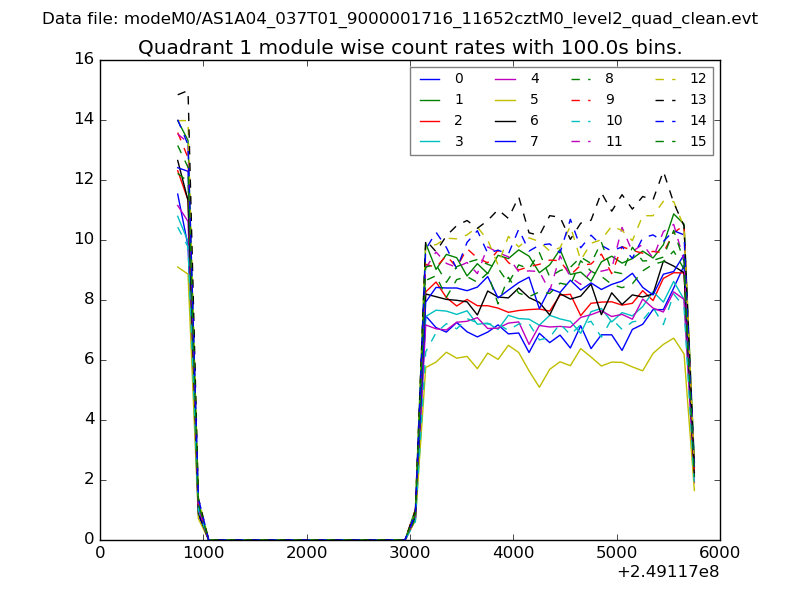
| Module-wise count rates for Quadrant A Data is divided into 100 sec bins |
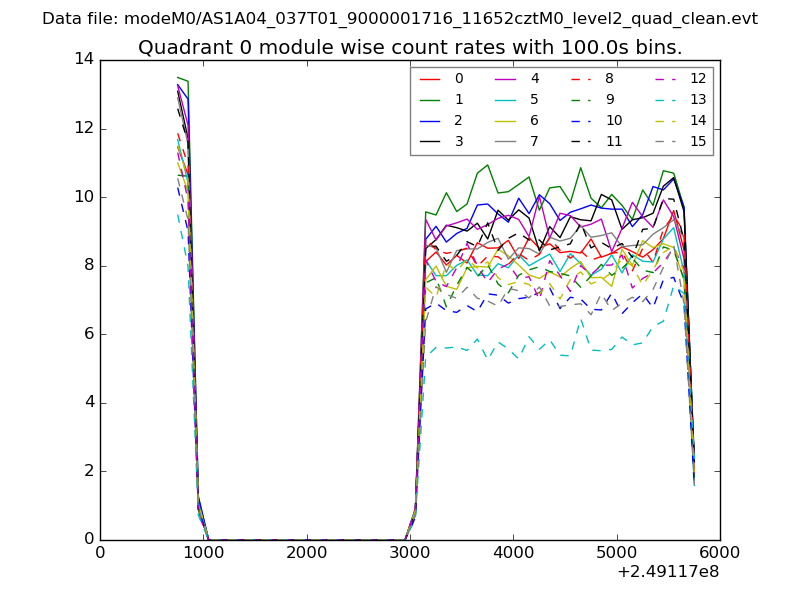 |
 |
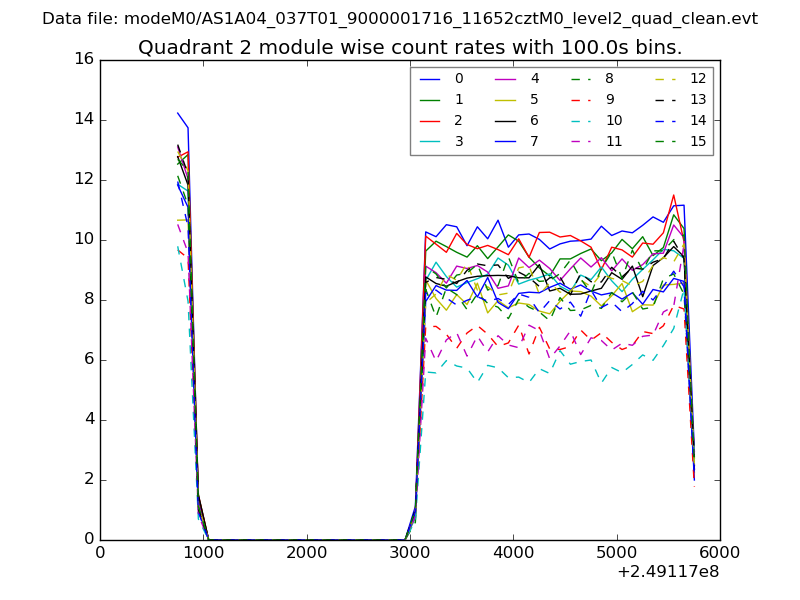
| Module-wise count rates for Quadrant B Data is divided into 100 sec bins |
 |
 |
| Module-wise count rates for Quadrant C Data is divided into 100 sec bins |
 |
 |
| Module-wise count rates for Quadrant D Data is divided into 100 sec bins |
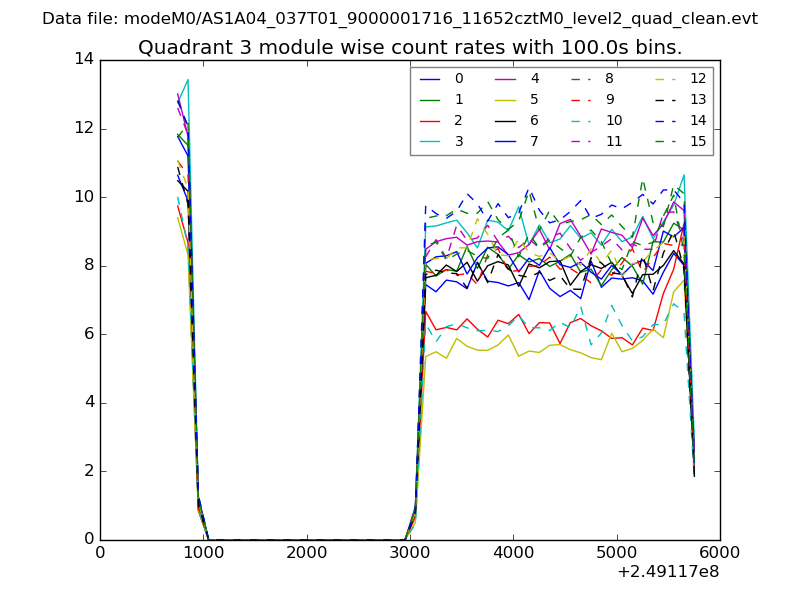 |
 |
| Parameter | Plot |
|---|---|
| CZT HV Monitor | 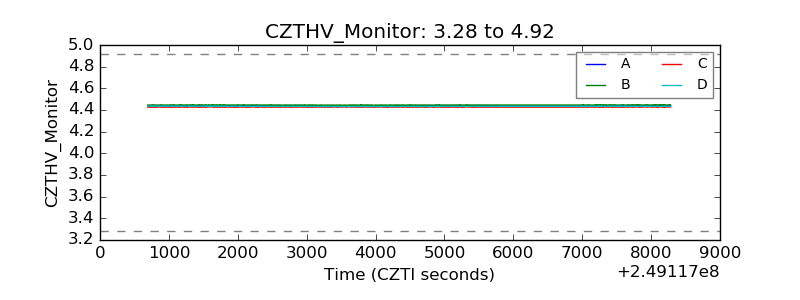 |
| D_VDD | 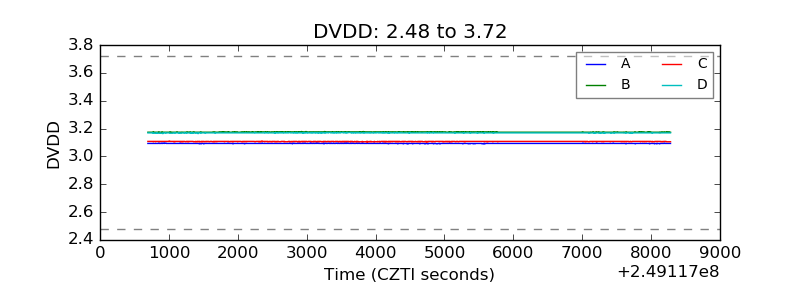 |
| Temperature 1 | 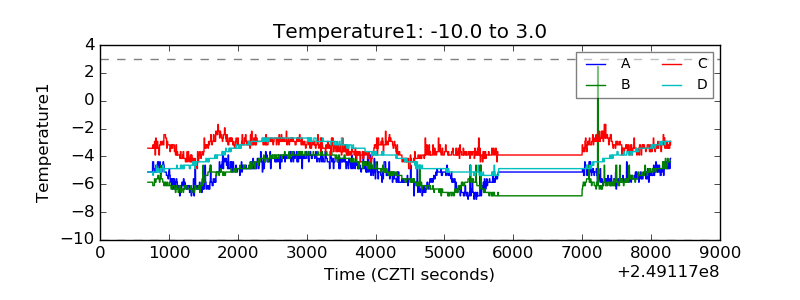 |
| Veto HV Monitor | 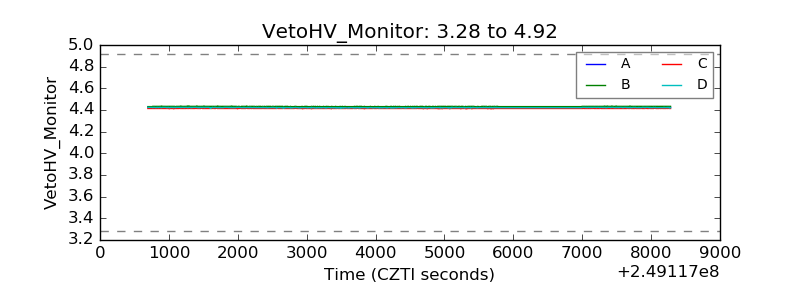 |
| Veto LLD | 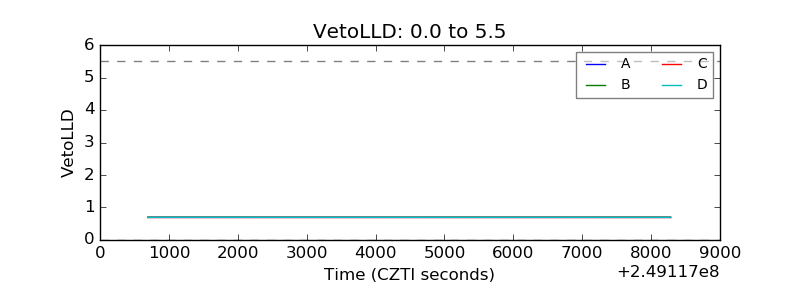 |
| Alpha Counter | 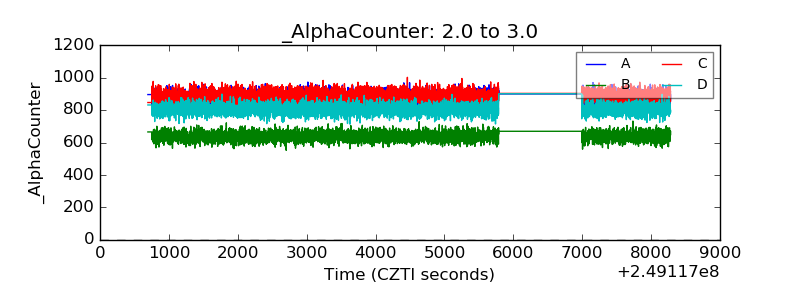 |
| _CPM_Rate | 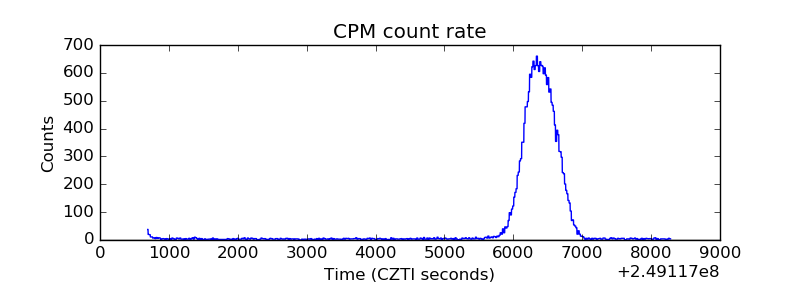 |
| CZT Counter | 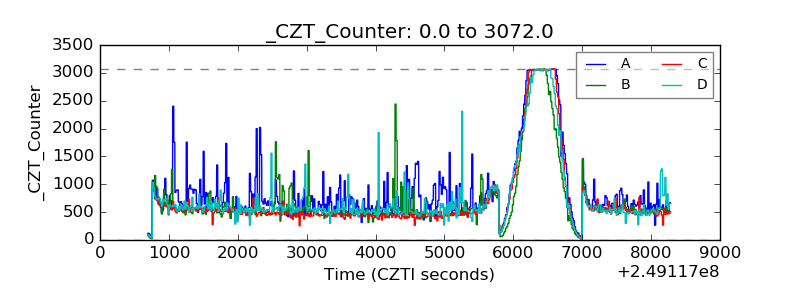 |
| +2.5 Volts monitor |  |
| +5 Volts monitor | 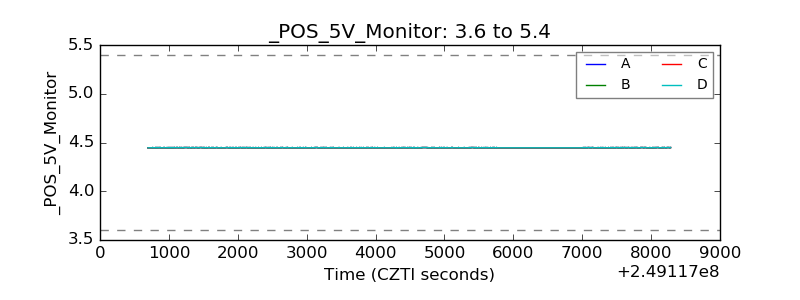 |
| _ROLL_ROT | 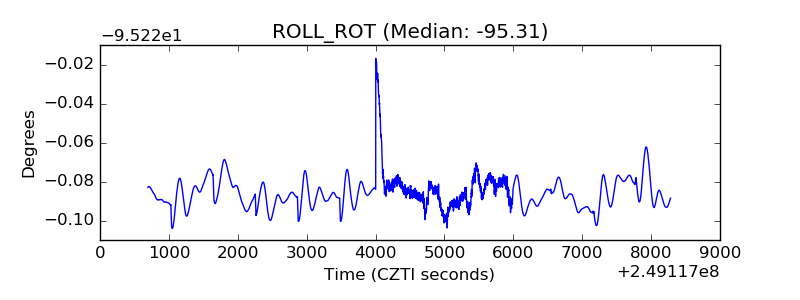 |
| _Roll_DEC | 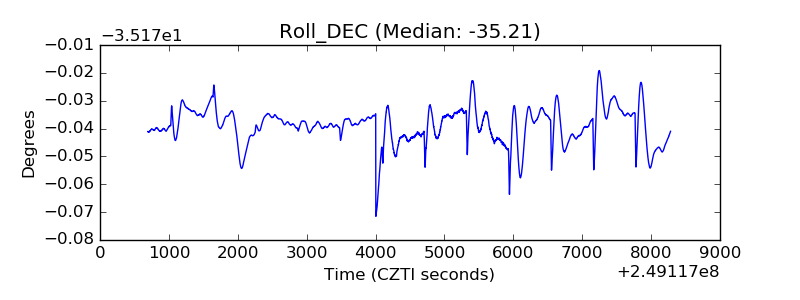 |
| _Roll_RA | 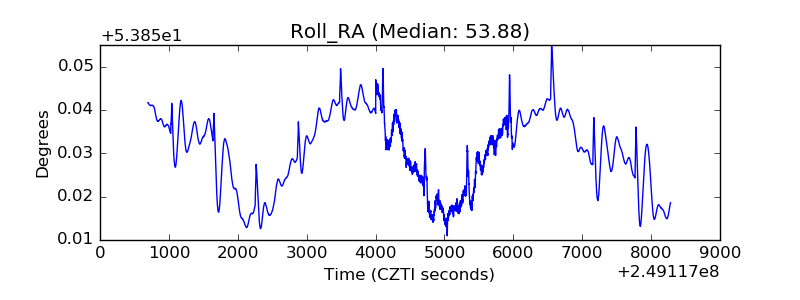 |
| Veto Counter | 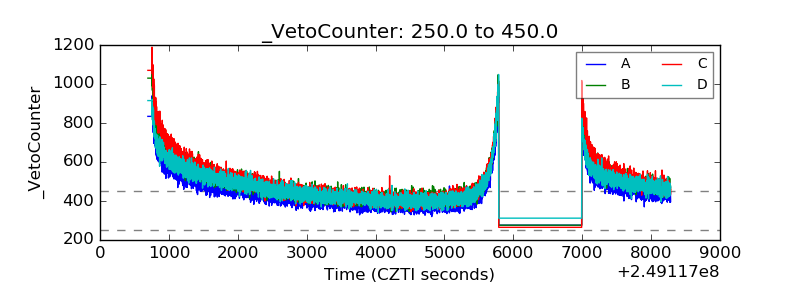 |