| Param | Original file | Final file |
|---|---|---|
| Filename | modeM0/AS1A04_037T01_9000001716_11653cztM0_level2.evt | modeM0/AS1A04_037T01_9000001716_11653cztM0_level2_quad_clean.evt |
| Size (bytes) | 543,067,200 | 69,494,400 |
| Size | 517.9 MB | 66.3 MB |
| Events in quadrant A | 4,164,472 | 412,779 |
| Events in quadrant B | 3,508,057 | 421,350 |
| Events in quadrant C | 3,208,959 | 416,769 |
| Events in quadrant D | 5,124,065 | 399,511 |
| Mode SS | |||
|---|---|---|---|
| Quadrant | BADHDUFLAG | Total packets | Discarded packets |
| A | 0 | 132 | 0 |
| B | 0 | 132 | 0 |
| C | 0 | 132 | 0 |
| D | 0 | 132 | 0 |
| Mode M9 | |||
|---|---|---|---|
| Quadrant | BADHDUFLAG | Total packets | Discarded packets |
| A | 0 | 17 | 0 |
| B | 0 | 17 | 0 |
| C | 0 | 17 | 0 |
| D | 0 | 18 | 0 |
| Mode M0 | |||
|---|---|---|---|
| Quadrant | BADHDUFLAG | Total packets | Discarded packets |
| A | 0 | 16699 | 3 |
| B | 0 | 14290 | 2 |
| C | 0 | 13695 | 2 |
| D | 0 | 19262 | 2 |
| Quadrant | Total seconds | Saturated seconds | Saturation percentage |
|---|---|---|---|
| A | 6507 | 250 | 3.842016% |
| B | 6507 | 221 | 3.396342% |
| C | 6507 | 128 | 1.967112% |
| D | 6507 | 600 | 9.220839% |
Noise dominated data is calculated using 1-second bins in cleaned event files. If a bin has >2000 counts, and if more than 50% of those come from <1% of pixels, then it is considered to be noise-dominated and hence unusable.
| Quadrant | # 1 sec bins | Bins with >0 counts | Bins with >2000 counts | High rate bins dominated by noise | Noise dominated (total time) | Noise dominated (detector-on time) | Marked lightcurve |
|---|---|---|---|---|---|---|---|
| A | 7542 | 6508 | 27 | 27 | 0.36% | 0.41% | 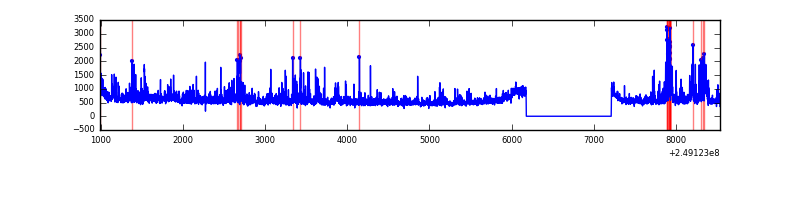 |
| B | 7542 | 6508 | 25 | 25 | 0.33% | 0.38% | 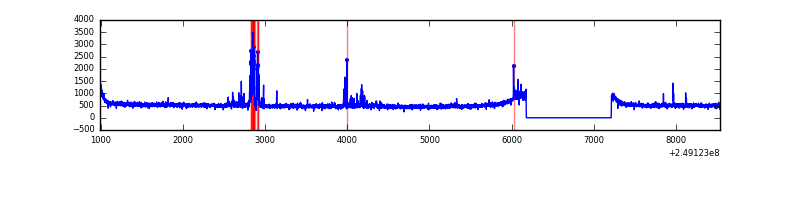 |
| C | 7542 | 6508 | 0 | 0 | 0.00% | 0.00% | 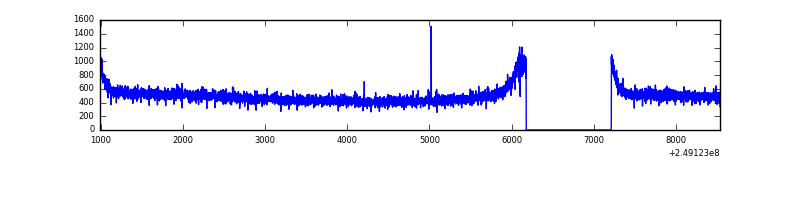 |
| D | 7542 | 6508 | 298 | 298 | 3.95% | 4.58% | 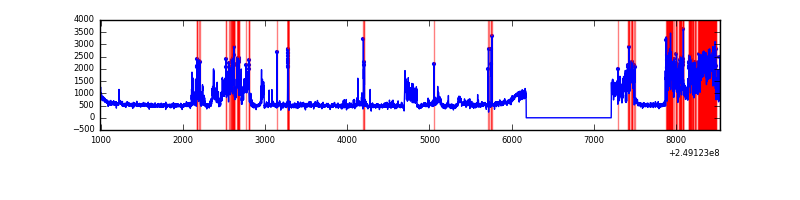 |
Top three noisy pixels from each quadrant. If the there are fewer than three noisy pixels in the level2.evt file, extra rows are filled as -1
| Pixel properties | Quadrant properties | ||||||
|---|---|---|---|---|---|---|---|
| Quadrant | DetID | PixID | Counts | Sigma | Mean | Median | Sigma |
| A | 8 | 5 | 559541 | 3287.87 | 833 | 813 | 169.9 |
| A | 1 | 162 | 145713 | 852.67 | 833 | 813 | 169.9 |
| A | 1 | 178 | 84524 | 492.6 | 833 | 813 | 169.9 |
| B | 4 | 239 | 185796 | 1157.39 | 834 | 813 | 159.8 |
| B | 15 | 204 | 47672 | 293.19 | 834 | 813 | 159.8 |
| B | 12 | 111 | 18794 | 112.5 | 834 | 813 | 159.8 |
| C | 13 | 61 | 5956 | 27.06 | 823 | 827 | 189.5 |
| C | 14 | 234 | 2384 | 8.21 | 823 | 827 | 189.5 |
| C | 3 | 202 | 1953 | 5.94 | 823 | 827 | 189.5 |
| D | 13 | 104 | 1333960 | 6931.94 | 801 | 777 | 192.3 |
| D | 13 | 122 | 291004 | 1509.05 | 801 | 777 | 192.3 |
| D | 8 | 195 | 255812 | 1326.07 | 801 | 777 | 192.3 |
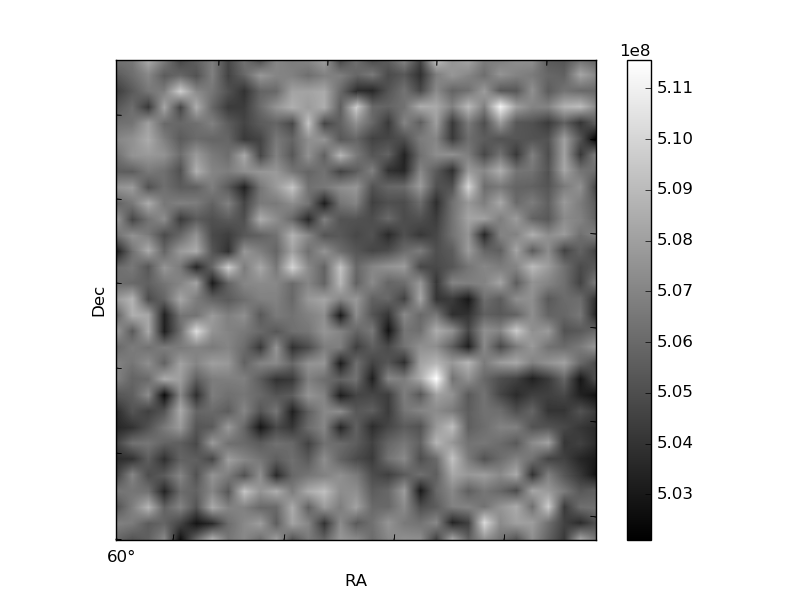
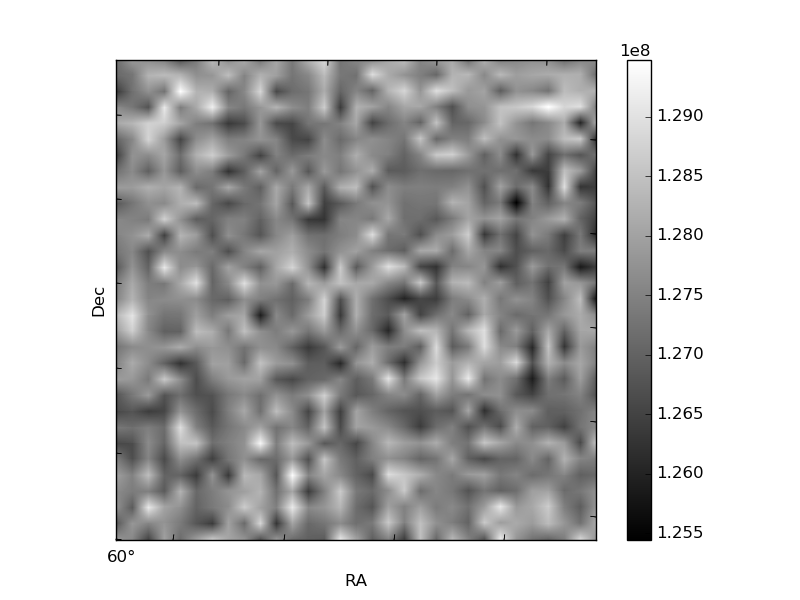
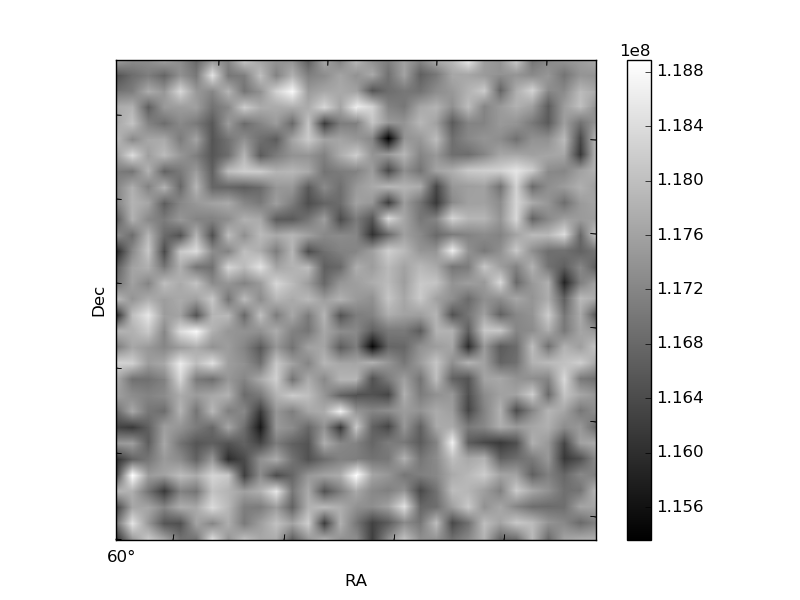
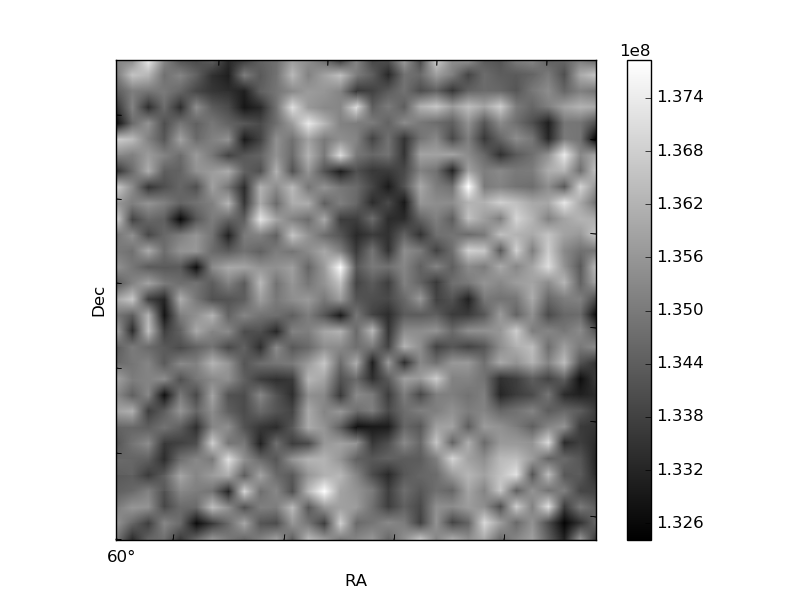
Histogram calculated using DETX and DETY for each event in the final _common_clean file
| Quadrant A | 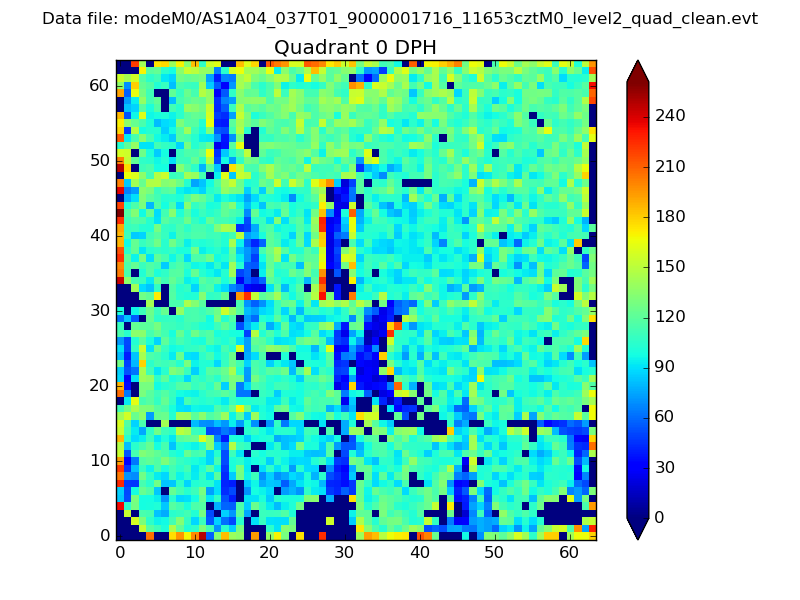 |
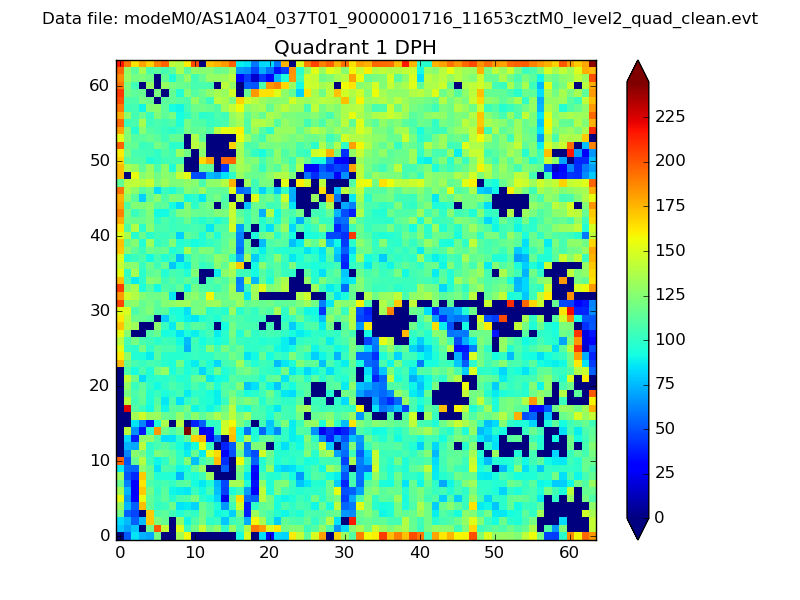 |
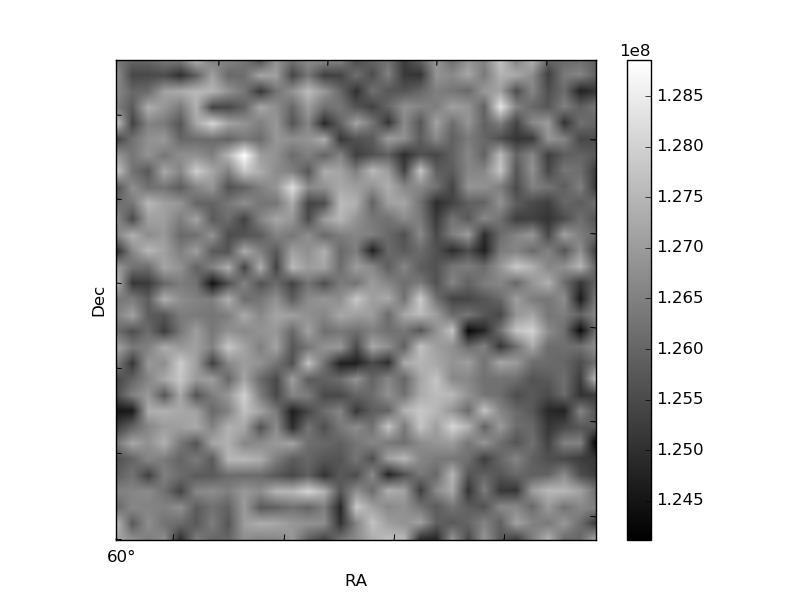
Quadrant B |
|---|---|---|---|
| Quadrant D | 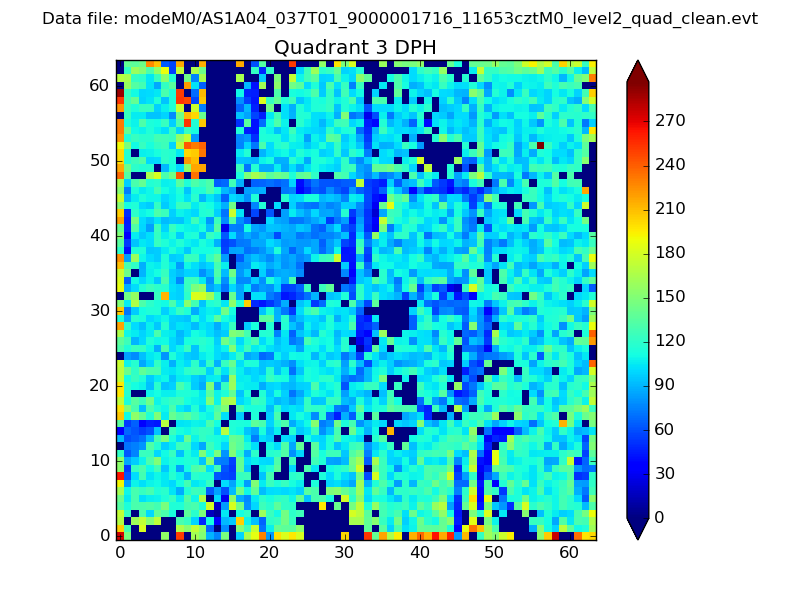 |
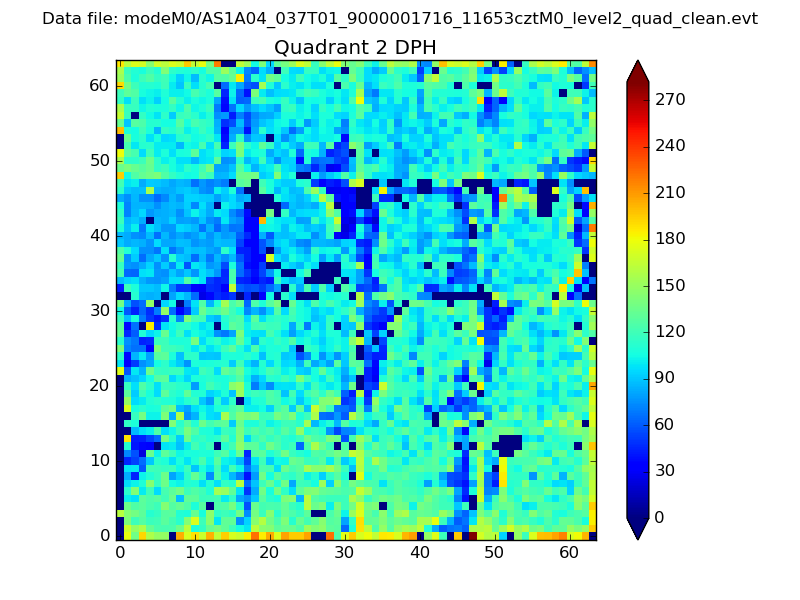 |
Quadrant C |
| Plot type | Count rate plots | Images |
|---|---|---|
| Comparison with Poisson distribution Blue bars denote a histogram of data divided into 1 sec bins. Red curve is a Poisson curve with rate = median count rate of data. |
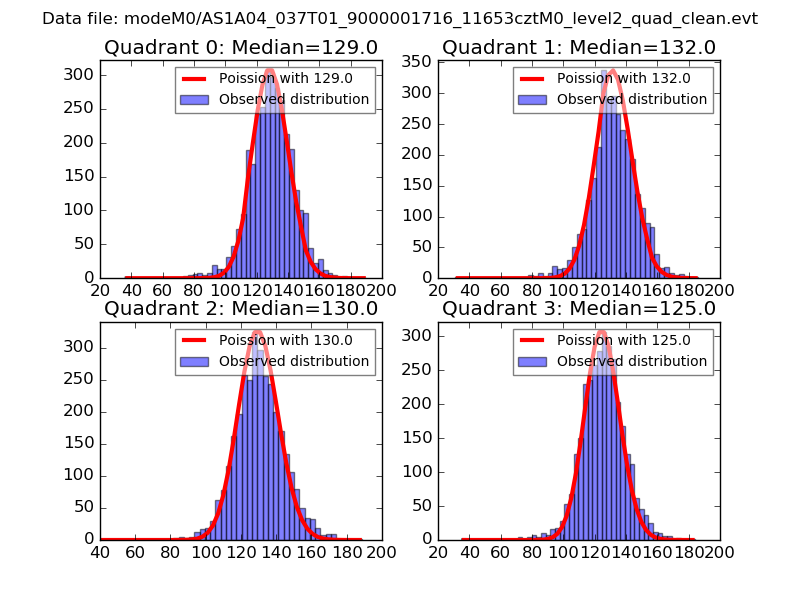 |
 |
| Quadrant-wise count rates Data is divided into 100 sec bins |
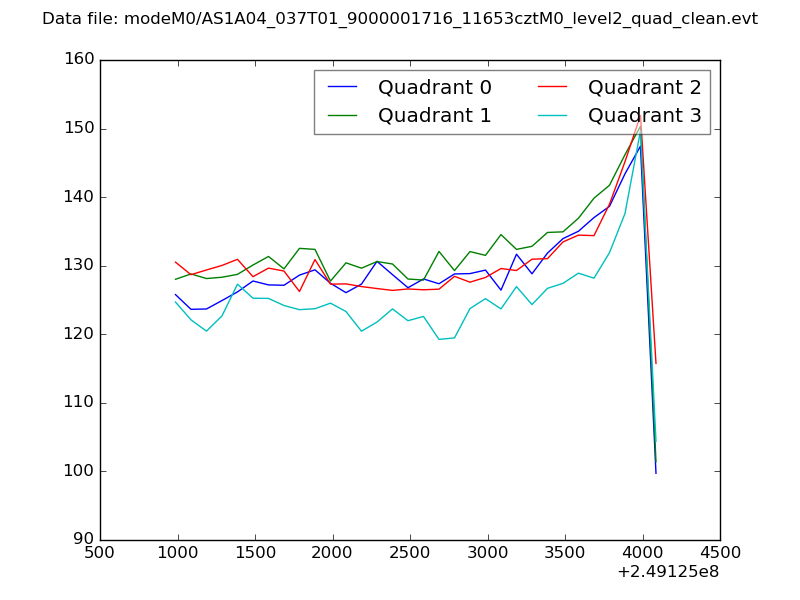 |
|
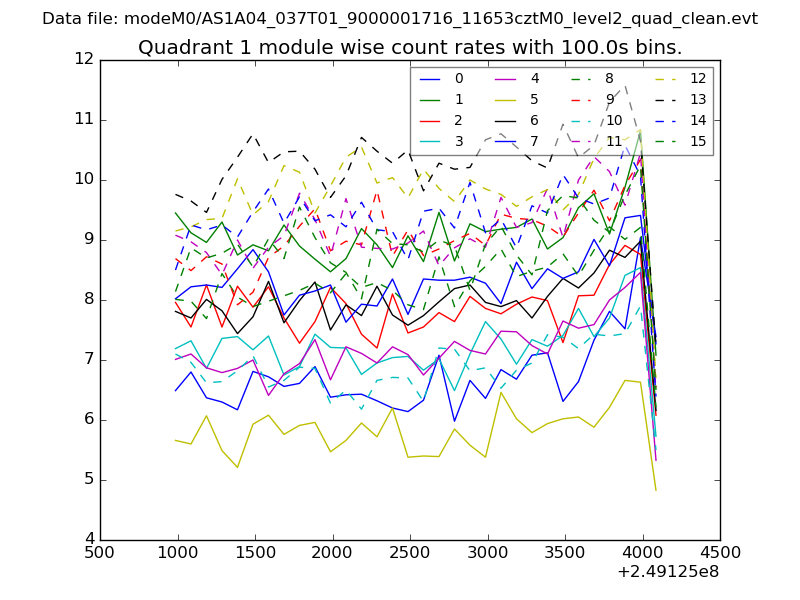
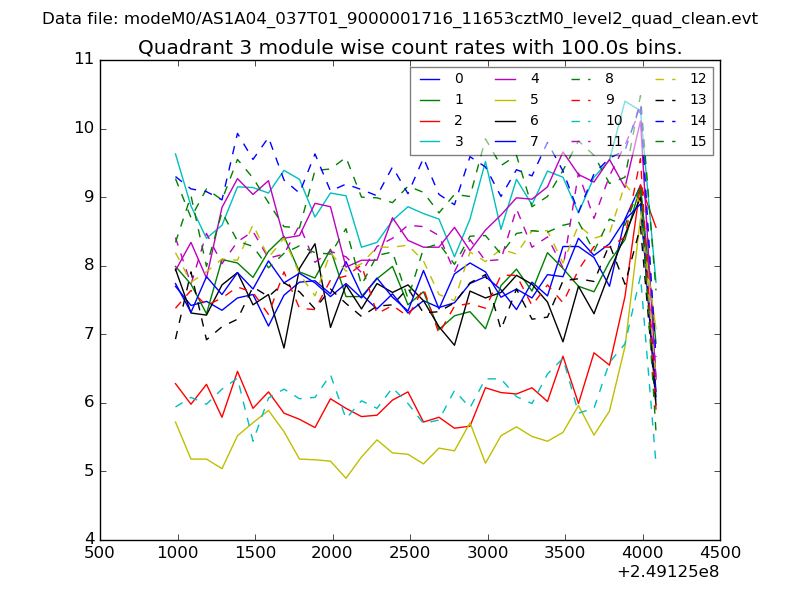
| Module-wise count rates for Quadrant A Data is divided into 100 sec bins |
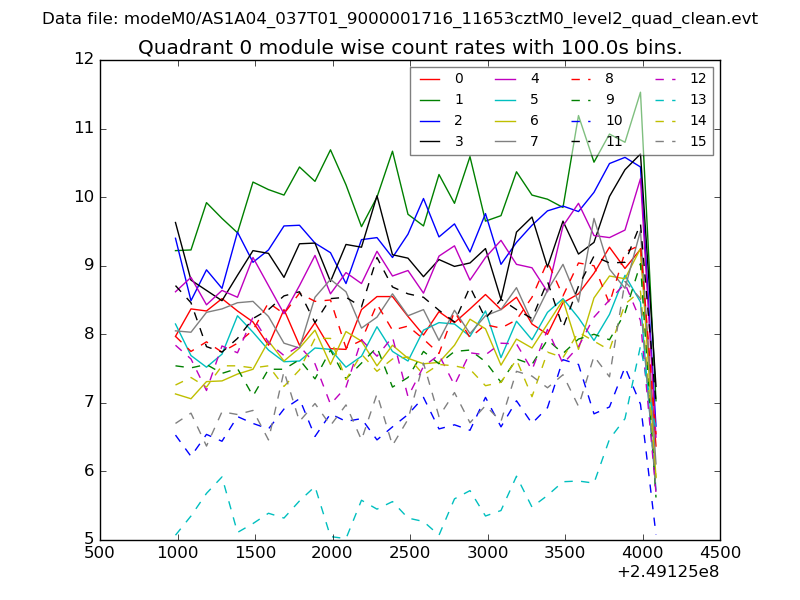 |
 |
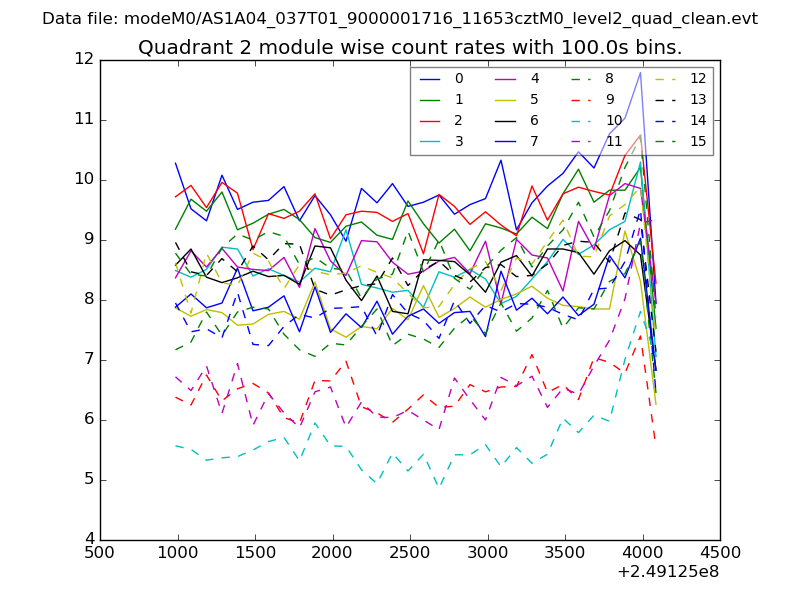
| Module-wise count rates for Quadrant B Data is divided into 100 sec bins |
 |
 |
| Module-wise count rates for Quadrant C Data is divided into 100 sec bins |
 |
 |
| Module-wise count rates for Quadrant D Data is divided into 100 sec bins |
 |
 |
| Parameter | Plot |
|---|---|
| CZT HV Monitor | 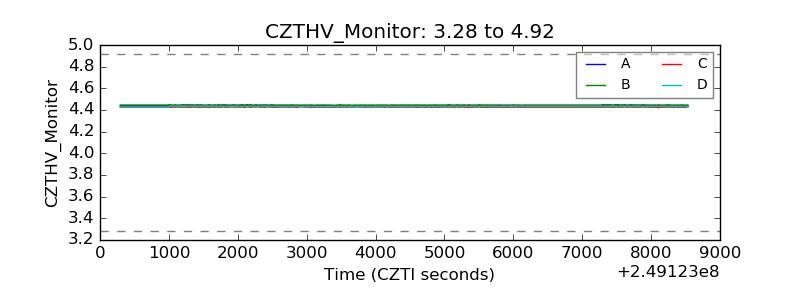 |
| D_VDD | 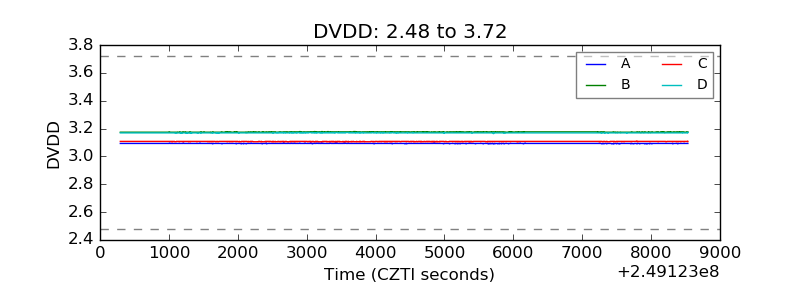 |
| Temperature 1 |  |
| Veto HV Monitor | 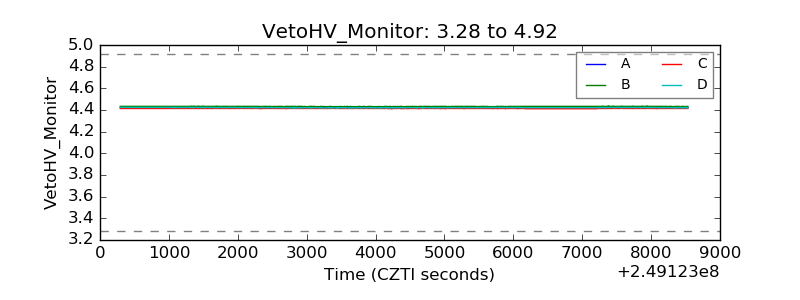 |
| Veto LLD |  |
| Alpha Counter | 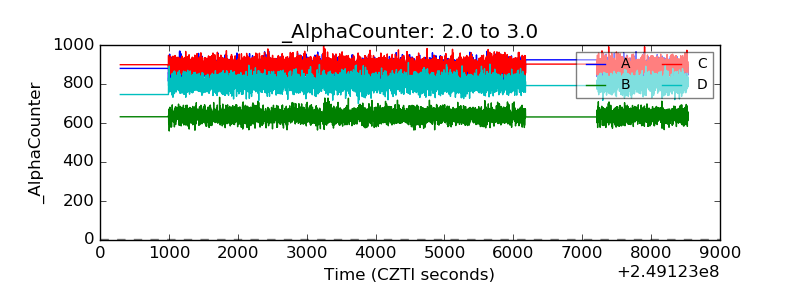 |
| _CPM_Rate | 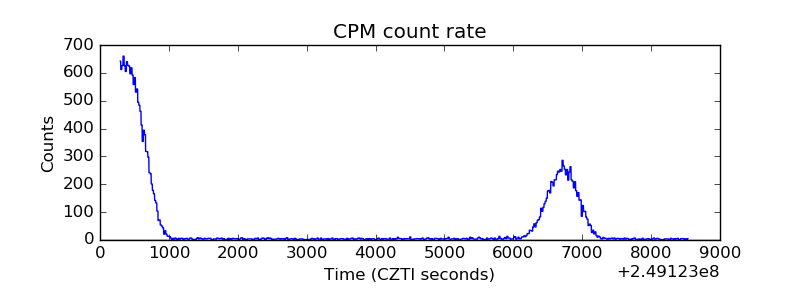 |
| CZT Counter | 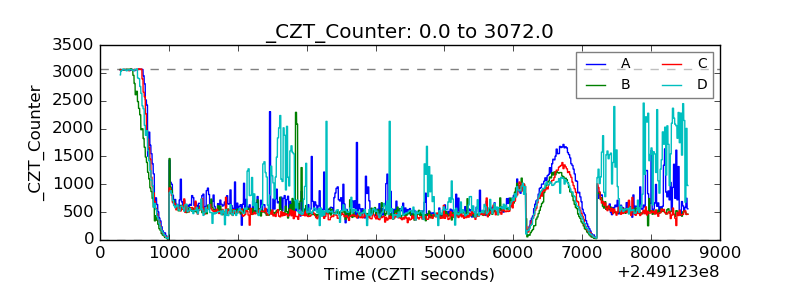 |
| +2.5 Volts monitor |  |
| +5 Volts monitor |  |
| _ROLL_ROT |  |
| _Roll_DEC |  |
| _Roll_RA | 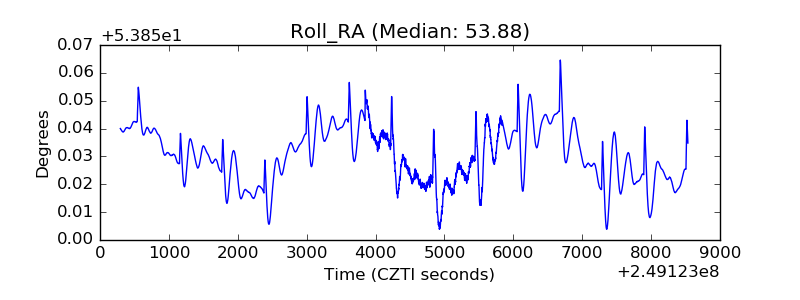 |
| Veto Counter |  |