| Param | Original file | Final file |
|---|---|---|
| Filename | modeM0/AS1A04_037T01_9000001716_11654cztM0_level2.evt | modeM0/AS1A04_037T01_9000001716_11654cztM0_level2_quad_clean.evt |
| Size (bytes) | 803,790,720 | 80,824,320 |
| Size | 766.6 MB | 77.1 MB |
| Events in quadrant A | 7,381,819 | 481,185 |
| Events in quadrant B | 3,848,149 | 516,173 |
| Events in quadrant C | 3,526,858 | 508,529 |
| Events in quadrant D | 9,100,999 | 440,388 |
| Mode SS | |||
|---|---|---|---|
| Quadrant | BADHDUFLAG | Total packets | Discarded packets |
| A | 0 | 146 | 0 |
| B | 0 | 146 | 0 |
| C | 0 | 146 | 0 |
| D | 0 | 146 | 0 |
| Mode M9 | |||
|---|---|---|---|
| Quadrant | BADHDUFLAG | Total packets | Discarded packets |
| A | 0 | 18 | 0 |
| B | 0 | 18 | 0 |
| C | 0 | 18 | 0 |
| D | 0 | 18 | 0 |
| Mode M0 | |||
|---|---|---|---|
| Quadrant | BADHDUFLAG | Total packets | Discarded packets |
| A | 0 | 26914 | 3 |
| B | 0 | 15930 | 2 |
| C | 0 | 15321 | 2 |
| D | 0 | 31926 | 2 |
| Quadrant | Total seconds | Saturated seconds | Saturation percentage |
|---|---|---|---|
| A | 7192 | 1136 | 15.795328% |
| B | 7192 | 380 | 5.283648% |
| C | 7192 | 266 | 3.698554% |
| D | 7192 | 1638 | 22.775306% |
Noise dominated data is calculated using 1-second bins in cleaned event files. If a bin has >2000 counts, and if more than 50% of those come from <1% of pixels, then it is considered to be noise-dominated and hence unusable.
| Quadrant | # 1 sec bins | Bins with >0 counts | Bins with >2000 counts | High rate bins dominated by noise | Noise dominated (total time) | Noise dominated (detector-on time) | Marked lightcurve |
|---|---|---|---|---|---|---|---|
| A | 8918 | 7195 | 532 | 532 | 5.97% | 7.39% | 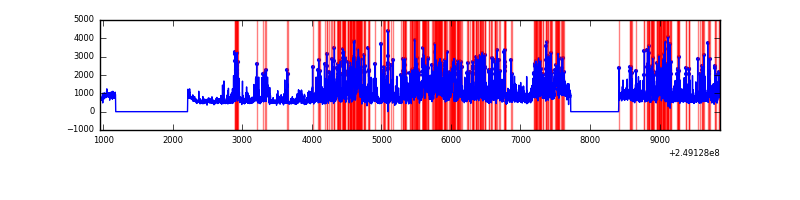 |
| B | 8918 | 7195 | 12 | 12 | 0.13% | 0.17% | 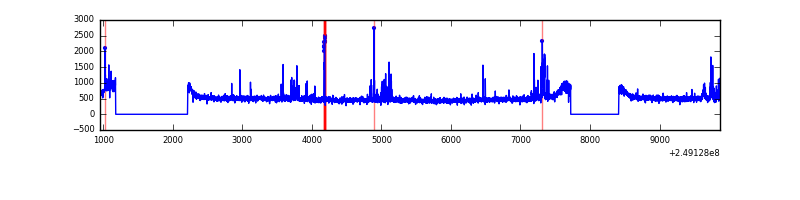 |
| C | 8918 | 7195 | 0 | 0 | 0.00% | 0.00% | 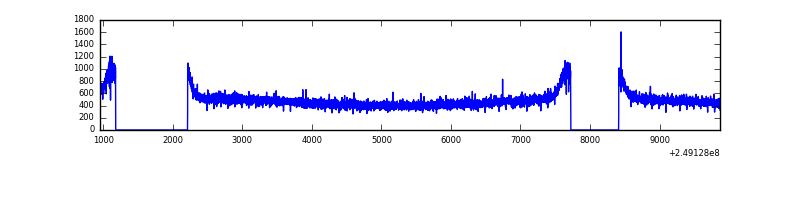 |
| D | 8918 | 7195 | 1164 | 1164 | 13.05% | 16.18% |  |
Top three noisy pixels from each quadrant. If the there are fewer than three noisy pixels in the level2.evt file, extra rows are filled as -1
| Pixel properties | Quadrant properties | ||||||
|---|---|---|---|---|---|---|---|
| Quadrant | DetID | PixID | Counts | Sigma | Mean | Median | Sigma |
| A | 8 | 5 | 3450076 | 19070.68 | 881 | 859 | 180.9 |
| A | 1 | 162 | 198569 | 1093.14 | 881 | 859 | 180.9 |
| A | 1 | 178 | 115869 | 635.89 | 881 | 859 | 180.9 |
| B | 4 | 239 | 191469 | 1068.72 | 912 | 889 | 178.3 |
| B | 15 | 204 | 51317 | 282.79 | 912 | 889 | 178.3 |
| B | 3 | 209 | 34154 | 186.54 | 912 | 889 | 178.3 |
| C | 8 | 128 | 8526 | 36.45 | 900 | 904 | 209.1 |
| C | 13 | 61 | 6494 | 26.73 | 900 | 904 | 209.1 |
| C | 8 | 112 | 4583 | 17.59 | 900 | 904 | 209.1 |
| D | 13 | 104 | 3617669 | 17746.52 | 844 | 818 | 203.8 |
| D | 1 | 52 | 1253886 | 6148.33 | 844 | 818 | 203.8 |
| D | 8 | 195 | 341841 | 1673.27 | 844 | 818 | 203.8 |
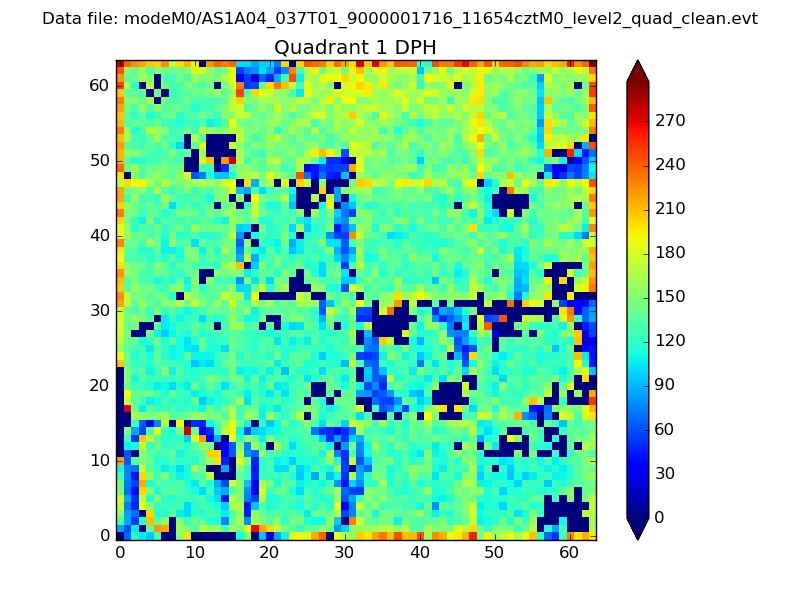
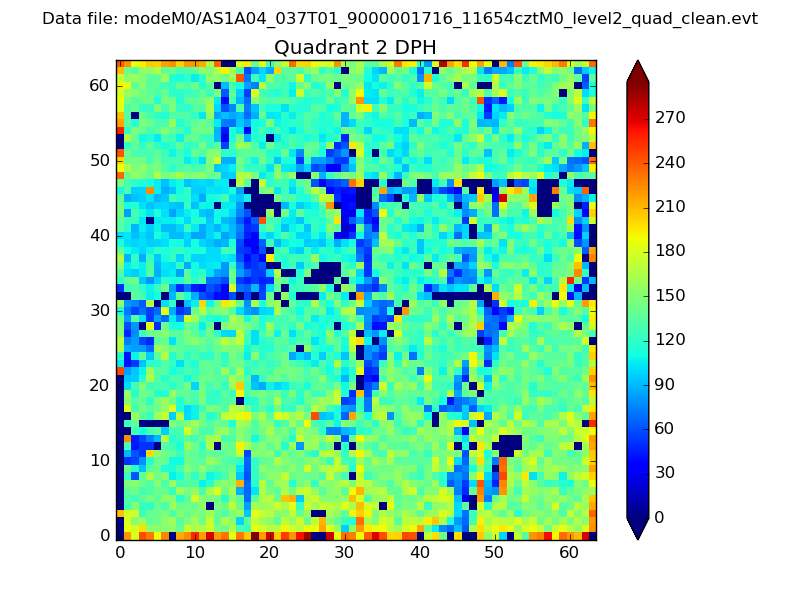
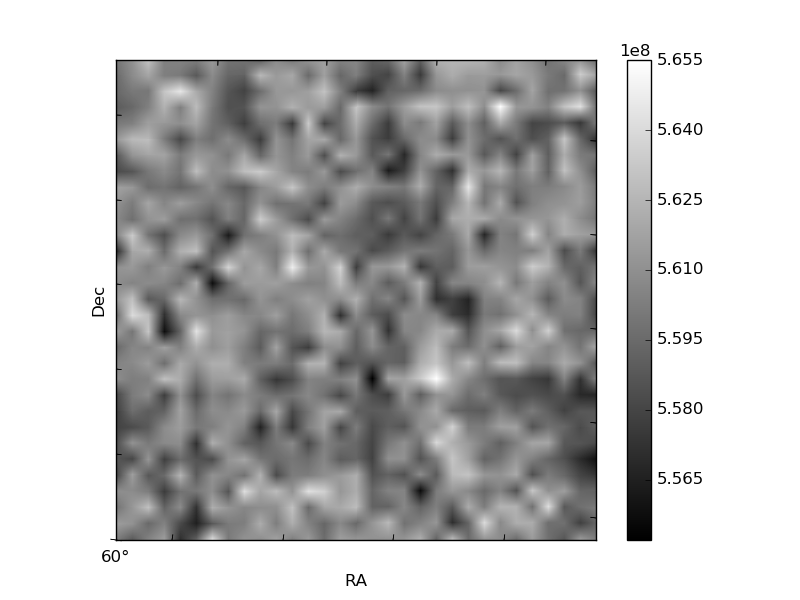
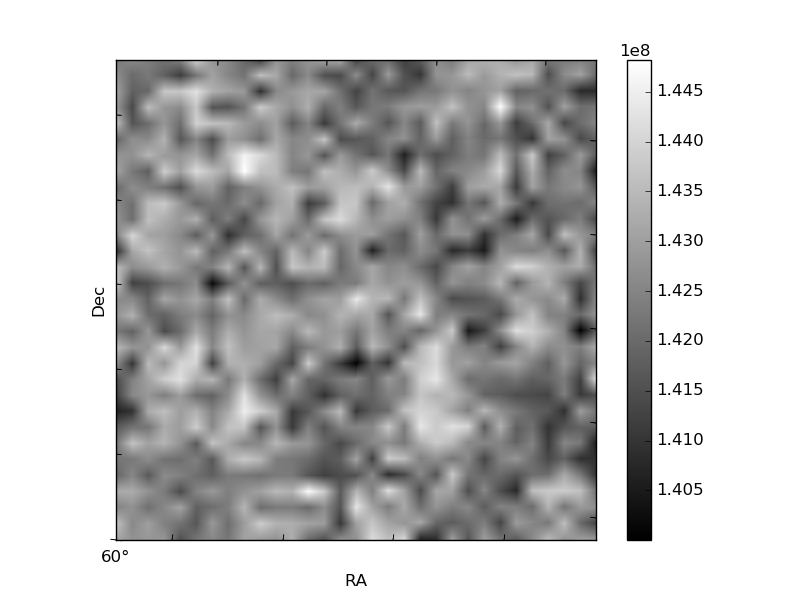
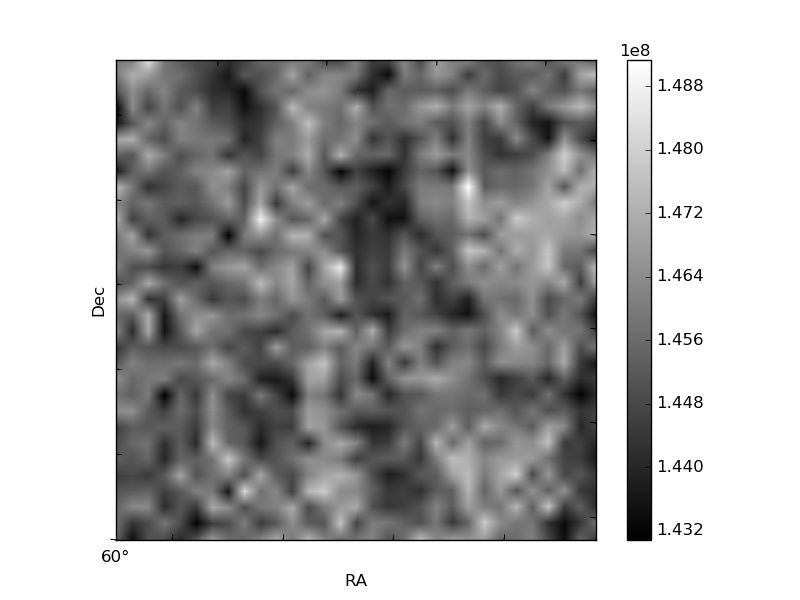
Histogram calculated using DETX and DETY for each event in the final _common_clean file
| Quadrant A | 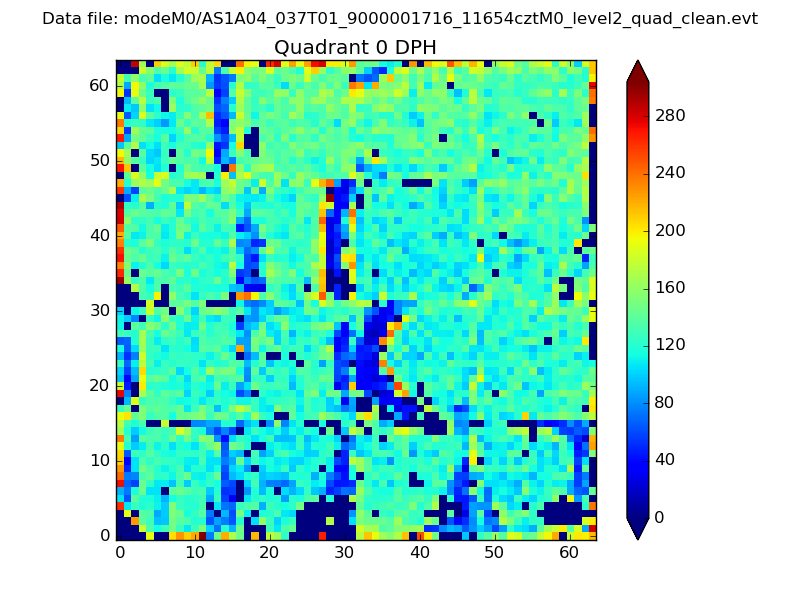 |
 |
Quadrant B |
|---|---|---|---|
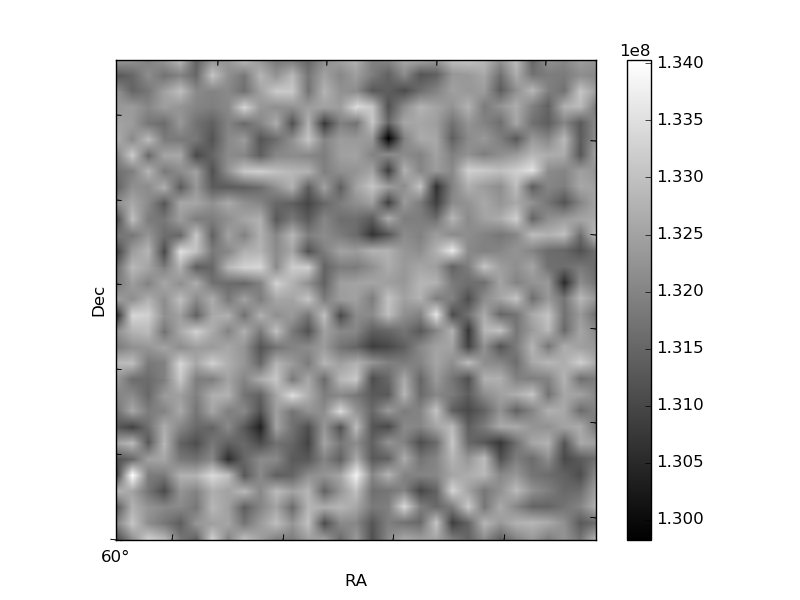
| Quadrant D | 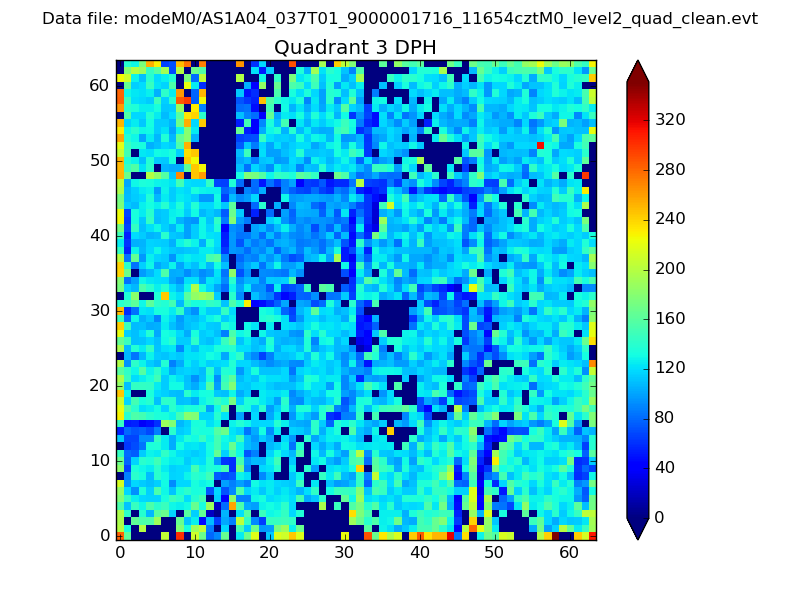 |
 |
Quadrant C |
| Plot type | Count rate plots | Images |
|---|---|---|
| Comparison with Poisson distribution Blue bars denote a histogram of data divided into 1 sec bins. Red curve is a Poisson curve with rate = median count rate of data. |
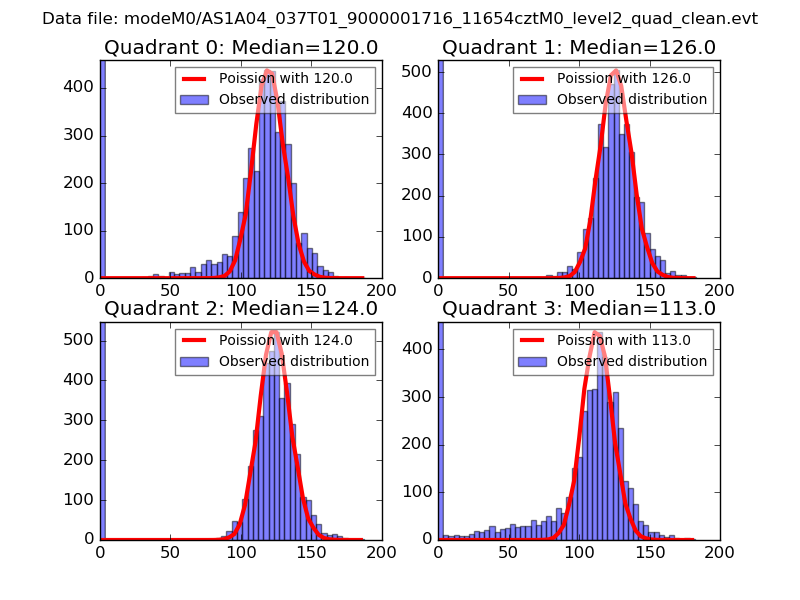 |
 |
| Quadrant-wise count rates Data is divided into 100 sec bins |
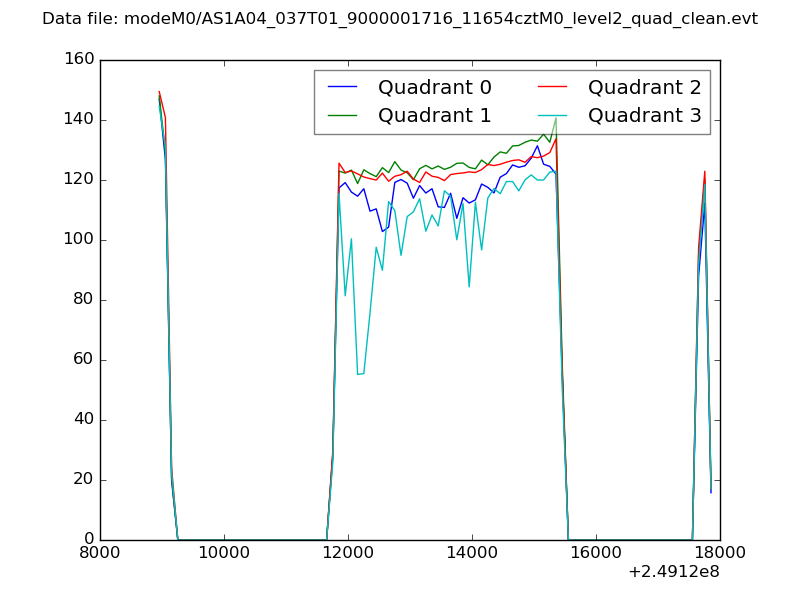 |
|
| Module-wise count rates for Quadrant A Data is divided into 100 sec bins |
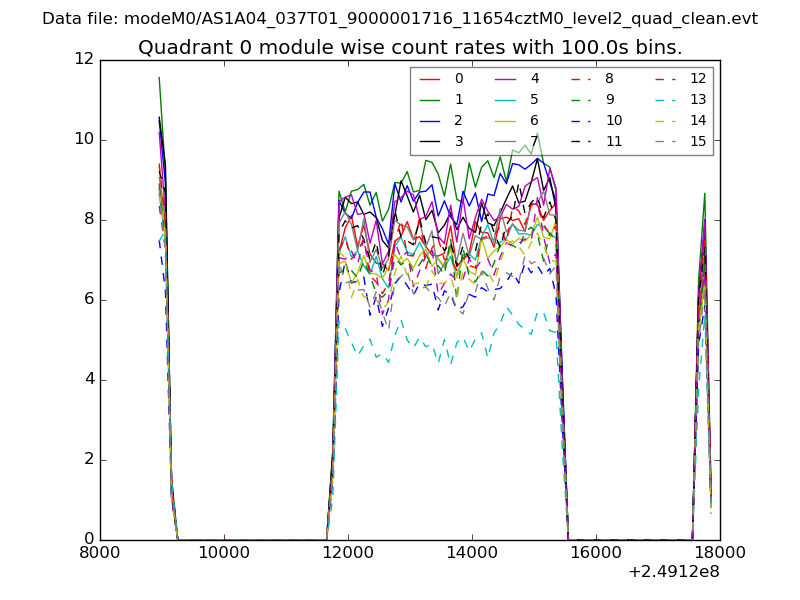 |
 |
| Module-wise count rates for Quadrant B Data is divided into 100 sec bins |
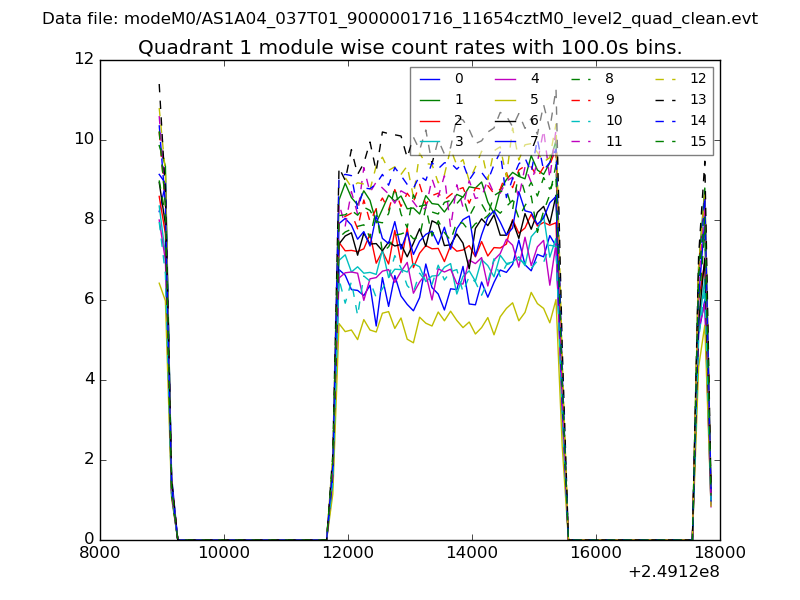 |
 |
| Module-wise count rates for Quadrant C Data is divided into 100 sec bins |
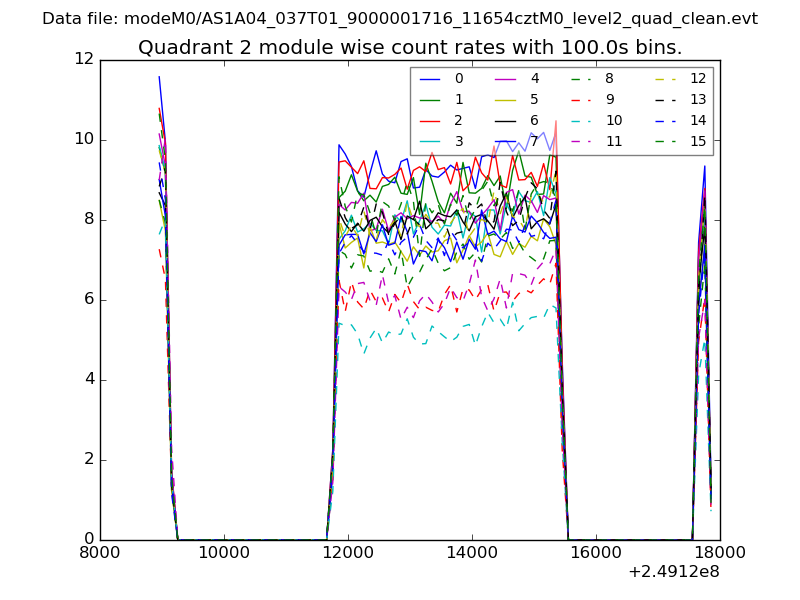 |
 |
| Module-wise count rates for Quadrant D Data is divided into 100 sec bins |
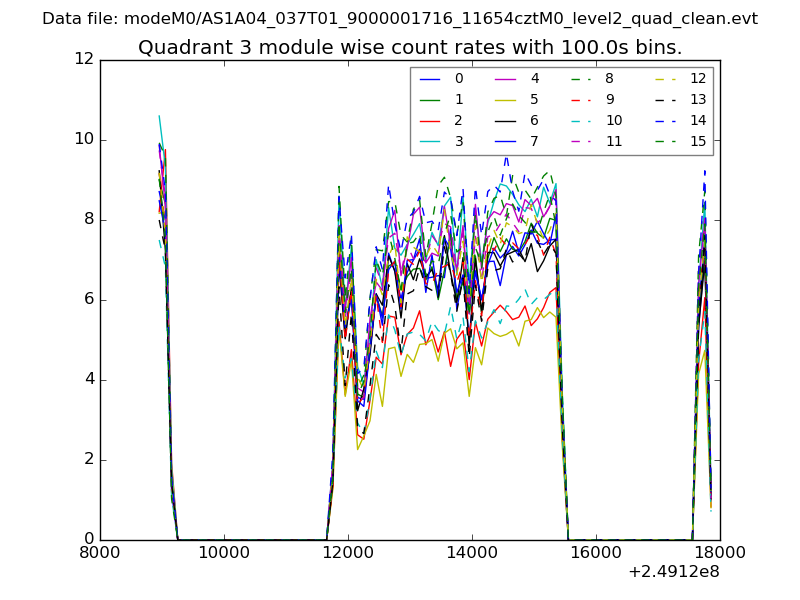 |
 |
| Parameter | Plot |
|---|---|
| CZT HV Monitor | 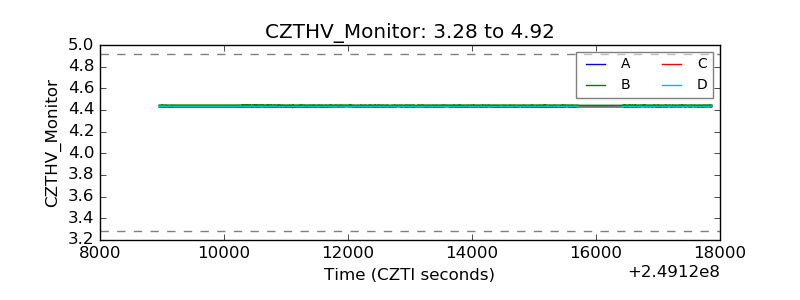 |
| D_VDD | 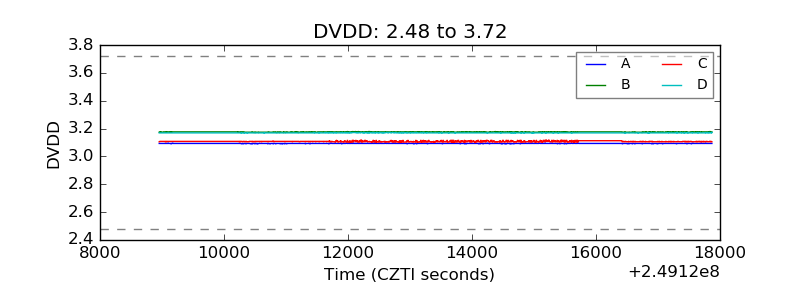 |
| Temperature 1 | 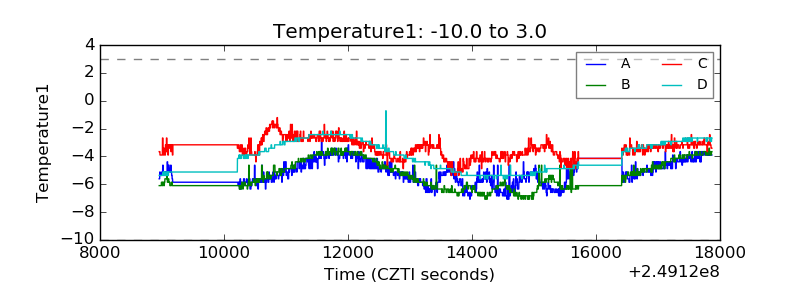 |
| Veto HV Monitor | 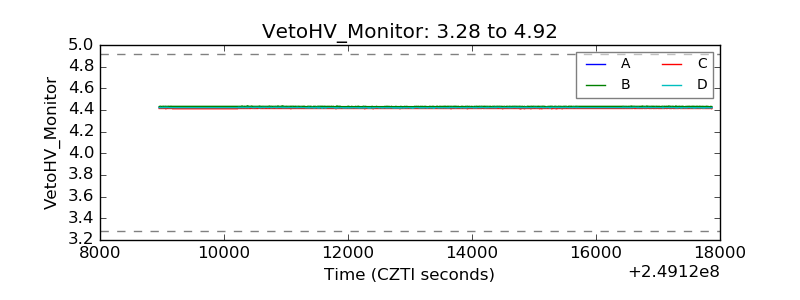 |
| Veto LLD | 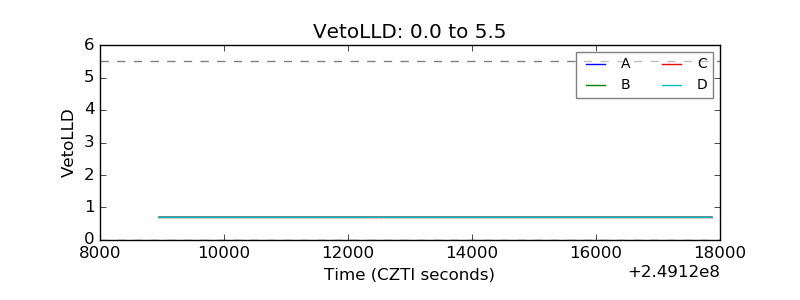 |
| Alpha Counter | 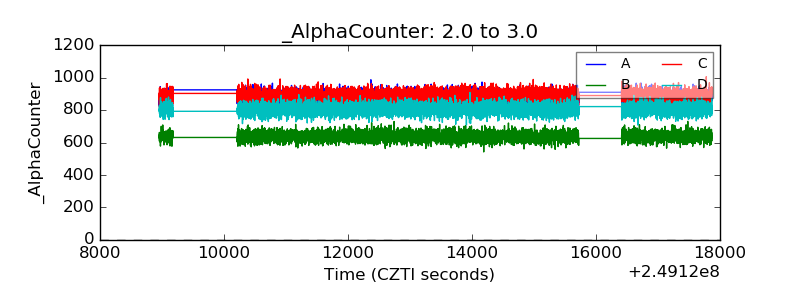 |
| _CPM_Rate | 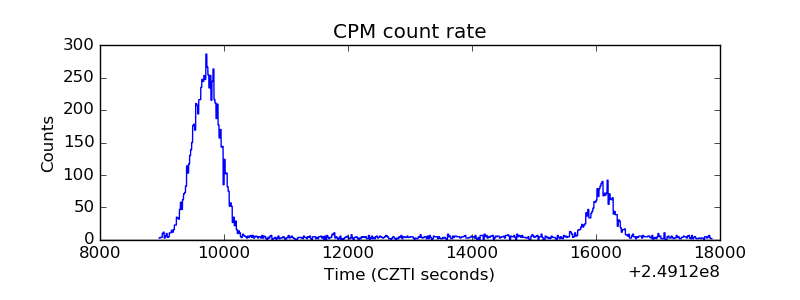 |
| CZT Counter | 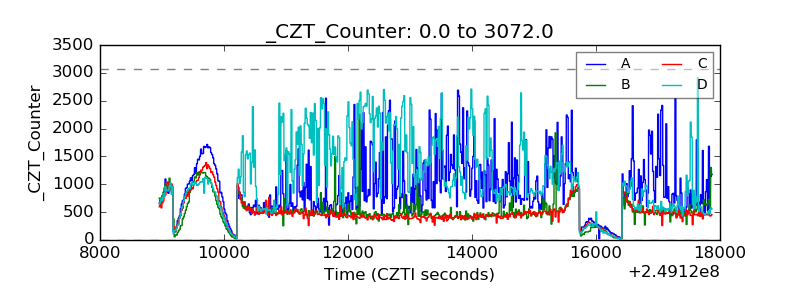 |
| +2.5 Volts monitor |  |
| +5 Volts monitor |  |
| _ROLL_ROT | 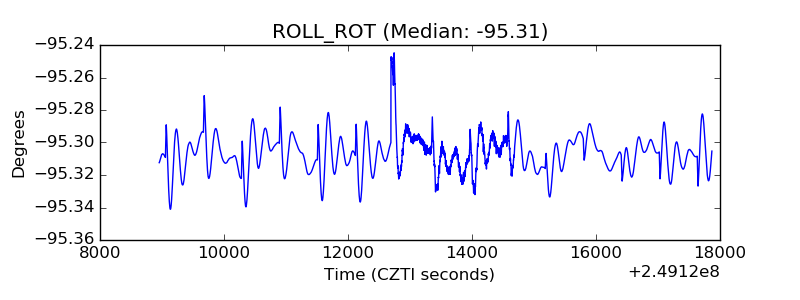 |
| _Roll_DEC | 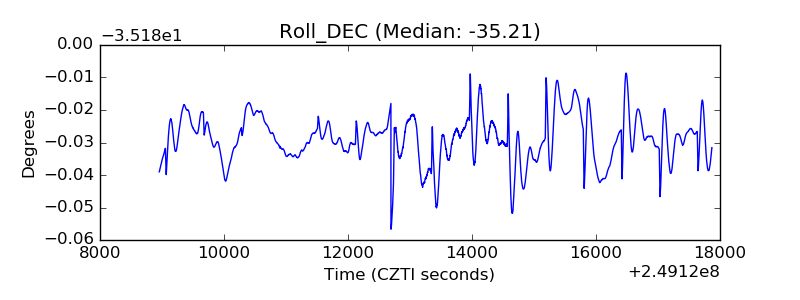 |
| _Roll_RA | 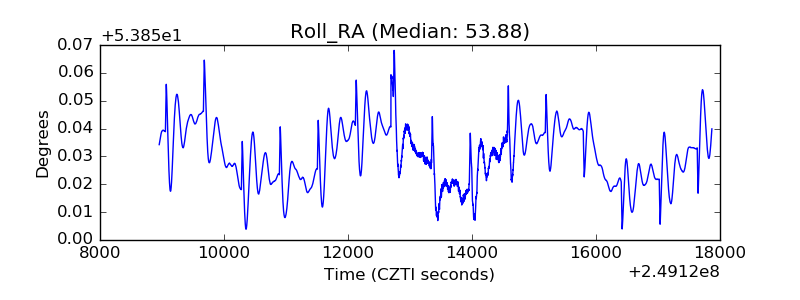 |
| Veto Counter | 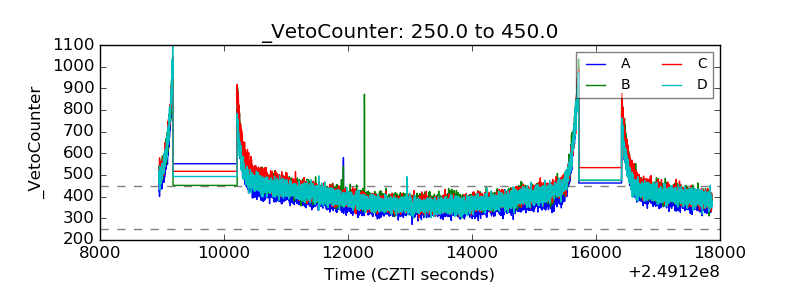 |