| Param | Original file | Final file |
|---|---|---|
| Filename | modeM0/AS1A04_037T01_9000001716_11655cztM0_level2.evt | modeM0/AS1A04_037T01_9000001716_11655cztM0_level2_quad_clean.evt |
| Size (bytes) | 309,358,080 | 36,253,440 |
| Size | 295.0 MB | 34.6 MB |
| Events in quadrant A | 3,391,946 | 207,948 |
| Events in quadrant B | 1,853,319 | 223,115 |
| Events in quadrant C | 1,612,063 | 218,416 |
| Events in quadrant D | 2,284,485 | 211,771 |
| Mode SS | |||
|---|---|---|---|
| Quadrant | BADHDUFLAG | Total packets | Discarded packets |
| A | 0 | 68 | 0 |
| B | 0 | 68 | 0 |
| C | 0 | 68 | 0 |
| D | 0 | 68 | 0 |
| Mode M9 | |||
|---|---|---|---|
| Quadrant | BADHDUFLAG | Total packets | Discarded packets |
| A | 0 | 7 | 0 |
| B | 0 | 7 | 0 |
| C | 0 | 7 | 0 |
| D | 0 | 7 | 0 |
| Mode M0 | |||
|---|---|---|---|
| Quadrant | BADHDUFLAG | Total packets | Discarded packets |
| A | 0 | 12406 | 1 |
| B | 0 | 7602 | 1 |
| C | 0 | 7128 | 1 |
| D | 0 | 8985 | 1 |
| Quadrant | Total seconds | Saturated seconds | Saturation percentage |
|---|---|---|---|
| A | 3326 | 632 | 19.001804% |
| B | 3326 | 208 | 6.253758% |
| C | 3326 | 147 | 4.419723% |
| D | 3326 | 207 | 6.223692% |
Noise dominated data is calculated using 1-second bins in cleaned event files. If a bin has >2000 counts, and if more than 50% of those come from <1% of pixels, then it is considered to be noise-dominated and hence unusable.
| Quadrant | # 1 sec bins | Bins with >0 counts | Bins with >2000 counts | High rate bins dominated by noise | Noise dominated (total time) | Noise dominated (detector-on time) | Marked lightcurve |
|---|---|---|---|---|---|---|---|
| A | 4017 | 3328 | 243 | 243 | 6.05% | 7.30% | 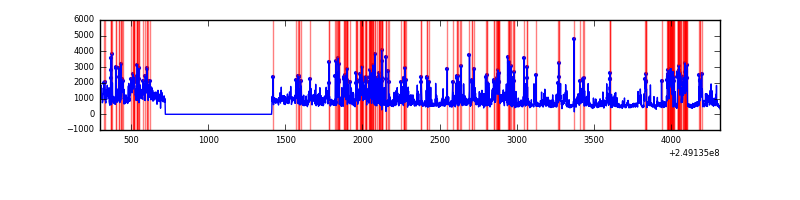 |
| B | 4017 | 3328 | 8 | 8 | 0.20% | 0.24% | 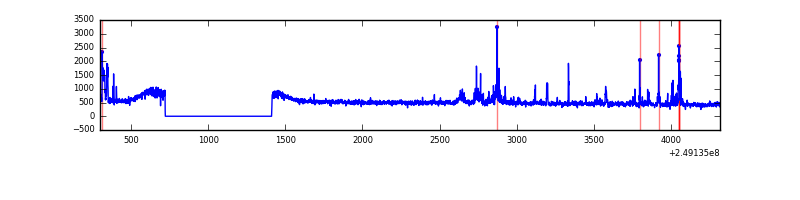 |
| C | 4017 | 3328 | 0 | 0 | 0.00% | 0.00% | 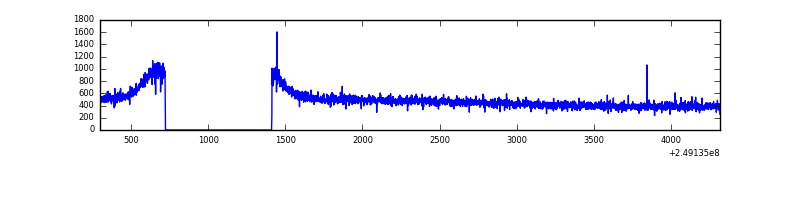 |
| D | 4017 | 3328 | 26 | 26 | 0.65% | 0.78% | 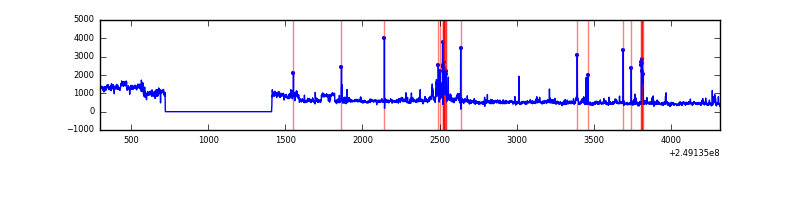 |
Top three noisy pixels from each quadrant. If the there are fewer than three noisy pixels in the level2.evt file, extra rows are filled as -1
| Pixel properties | Quadrant properties | ||||||
|---|---|---|---|---|---|---|---|
| Quadrant | DetID | PixID | Counts | Sigma | Mean | Median | Sigma |
| A | 8 | 5 | 1574892 | 18777.35 | 400 | 388 | 83.9 |
| A | 1 | 162 | 102050 | 1212.4 | 400 | 388 | 83.9 |
| A | 1 | 178 | 59680 | 707.1 | 400 | 388 | 83.9 |
| B | 4 | 239 | 156577 | 1845.42 | 421 | 409 | 84.6 |
| B | 15 | 204 | 24441 | 283.98 | 421 | 409 | 84.6 |
| B | 3 | 209 | 16968 | 195.68 | 421 | 409 | 84.6 |
| C | 1 | 3 | 4261 | 39.17 | 411 | 412 | 98.3 |
| C | 13 | 61 | 2947 | 25.79 | 411 | 412 | 98.3 |
| C | 14 | 225 | 2147 | 17.65 | 411 | 412 | 98.3 |
| D | 1 | 52 | 273446 | 2729.17 | 409 | 397 | 100.0 |
| D | 8 | 195 | 183278 | 1827.92 | 409 | 397 | 100.0 |
| D | 10 | 157 | 84792 | 843.54 | 409 | 397 | 100.0 |
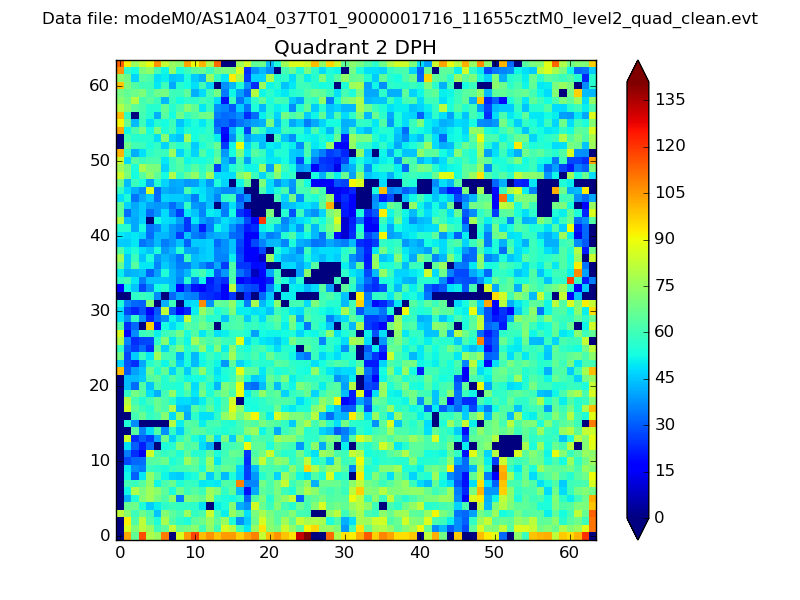
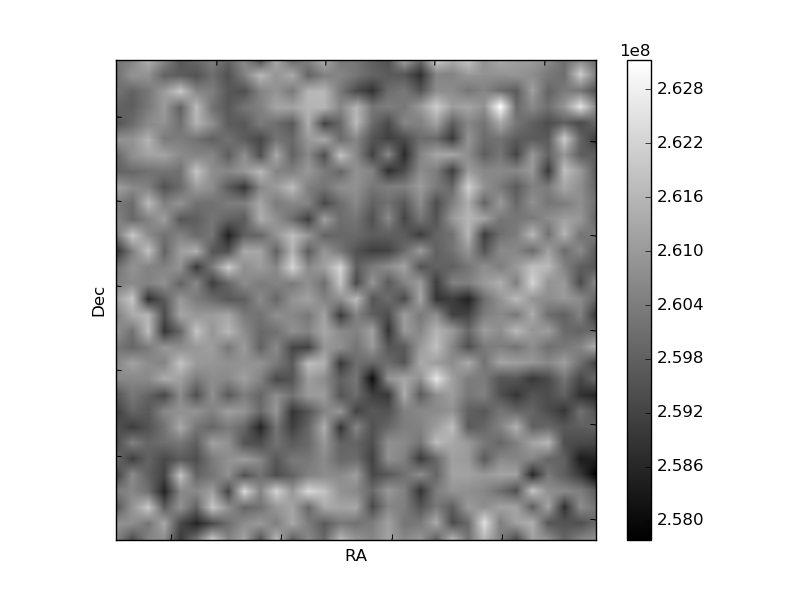
Histogram calculated using DETX and DETY for each event in the final _common_clean file
| Quadrant A | 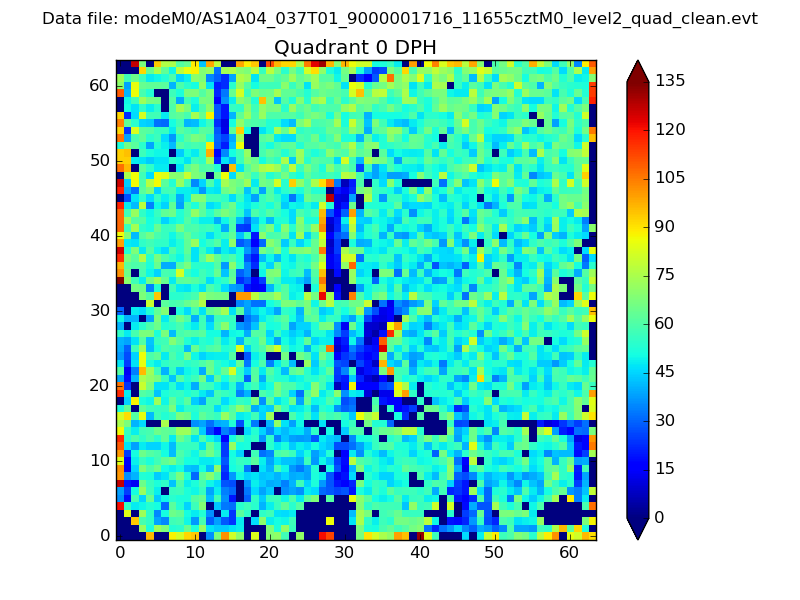 |
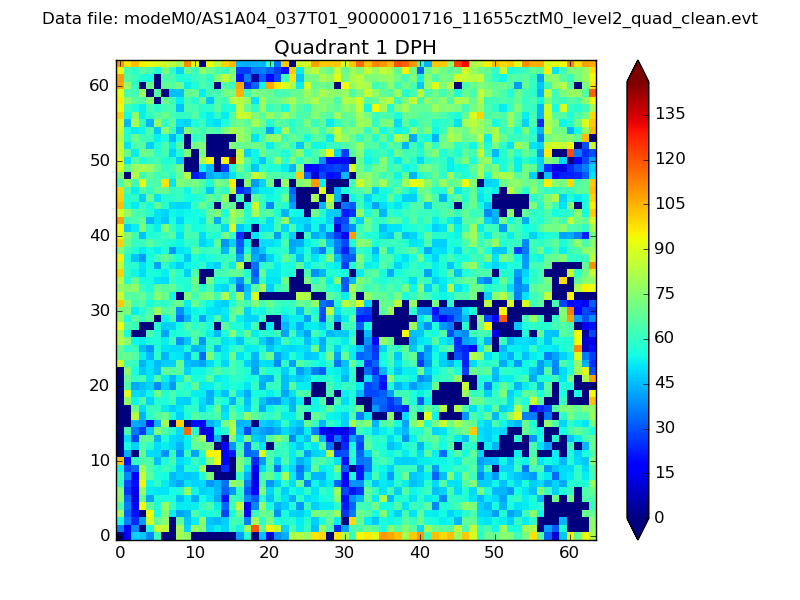 |
Quadrant B |
|---|---|---|---|
| Quadrant D | 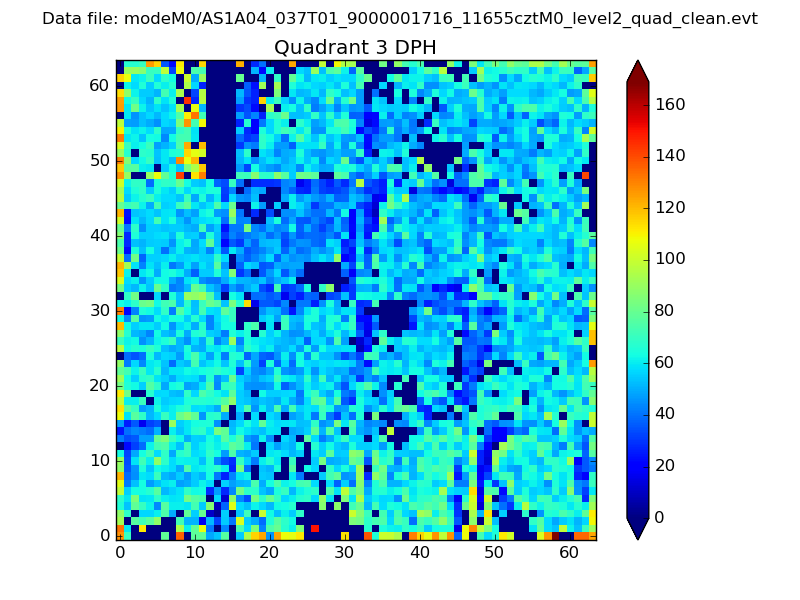 |
 |
Quadrant C |
| Plot type | Count rate plots | Images |
|---|---|---|
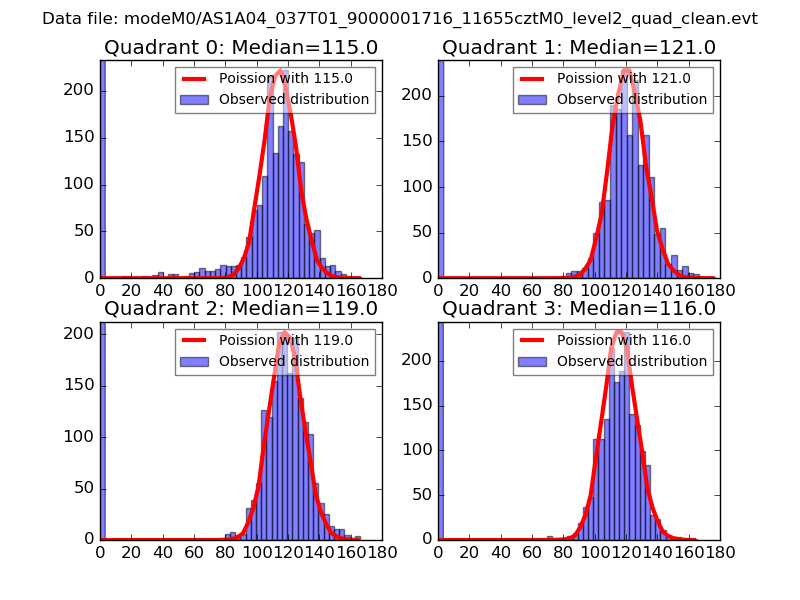
| Comparison with Poisson distribution Blue bars denote a histogram of data divided into 1 sec bins. Red curve is a Poisson curve with rate = median count rate of data. |
 |
 |
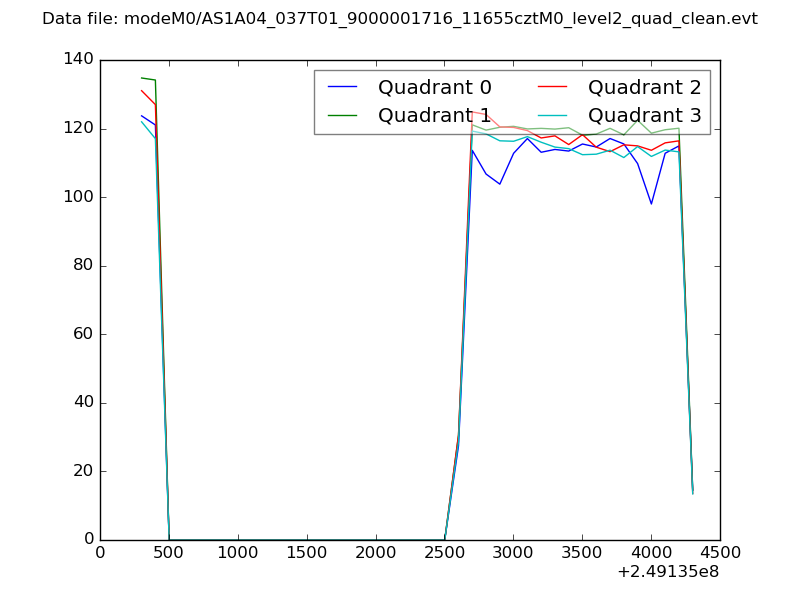
| Quadrant-wise count rates Data is divided into 100 sec bins |
 |
|
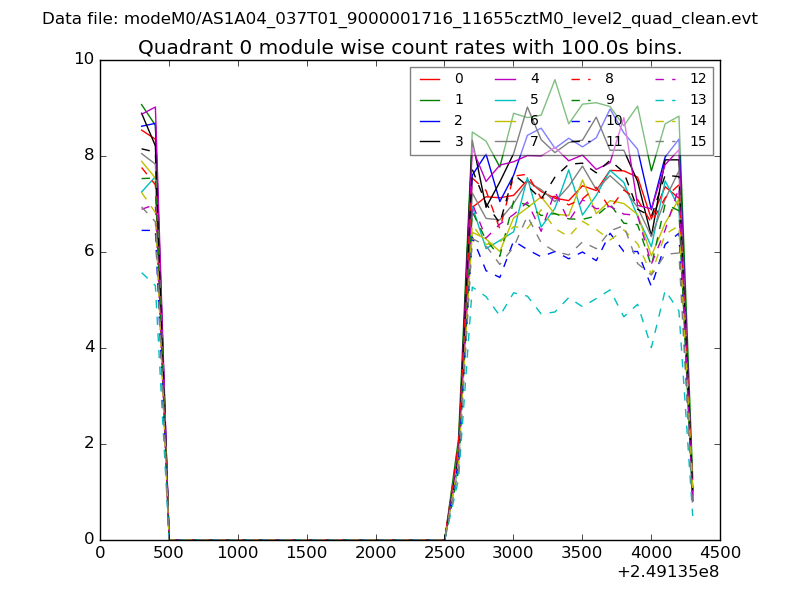
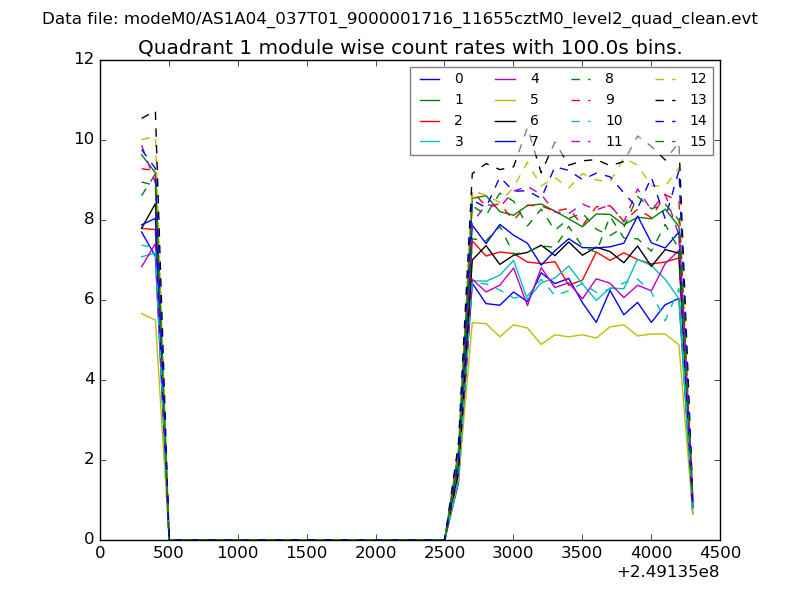
| Module-wise count rates for Quadrant A Data is divided into 100 sec bins |
 |
 |
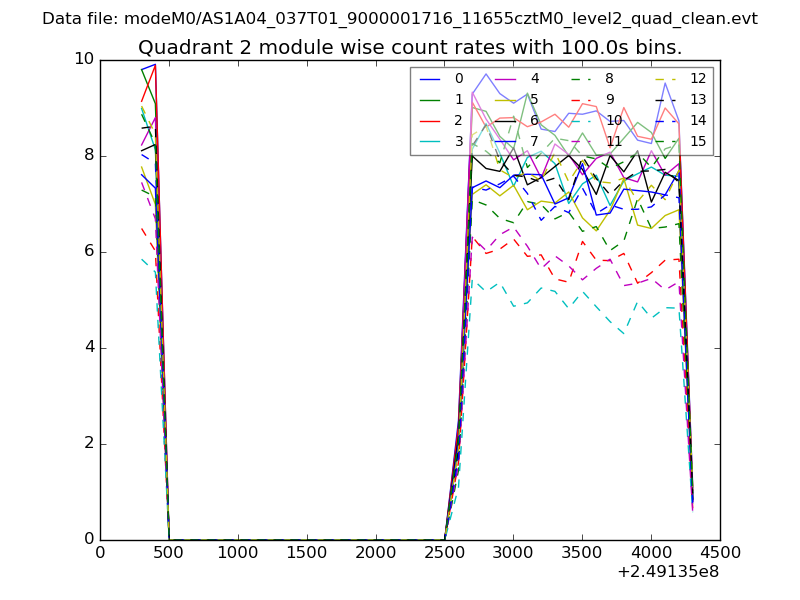
| Module-wise count rates for Quadrant B Data is divided into 100 sec bins |
 |
 |
| Module-wise count rates for Quadrant C Data is divided into 100 sec bins |
 |
 |
| Module-wise count rates for Quadrant D Data is divided into 100 sec bins |
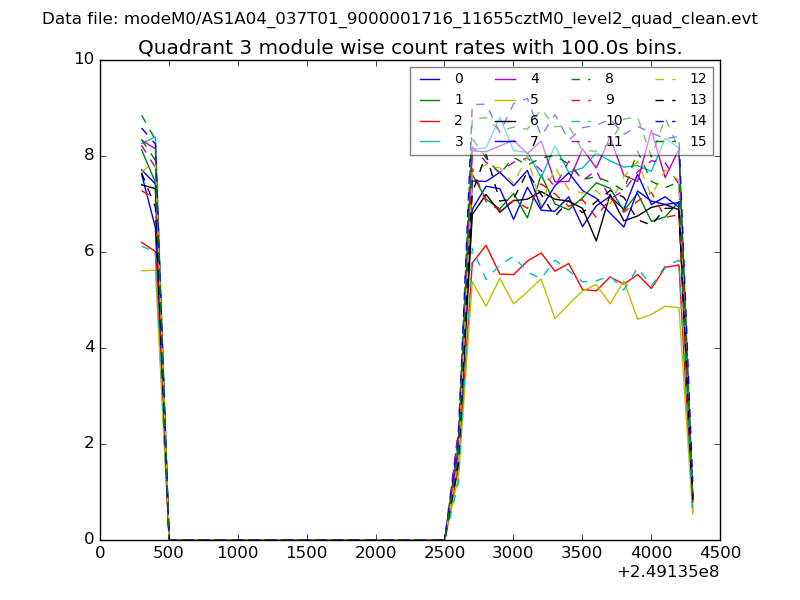 |
 |
| Parameter | Plot |
|---|---|
| CZT HV Monitor | 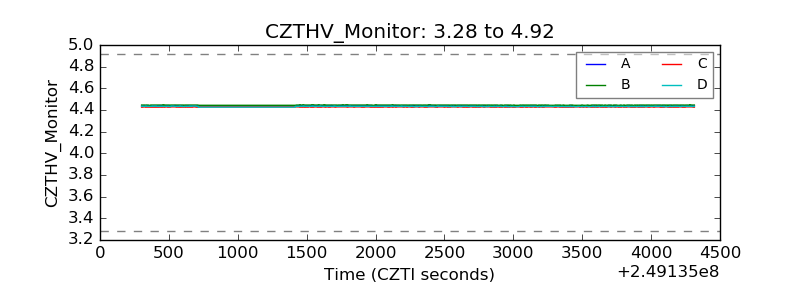 |
| D_VDD | 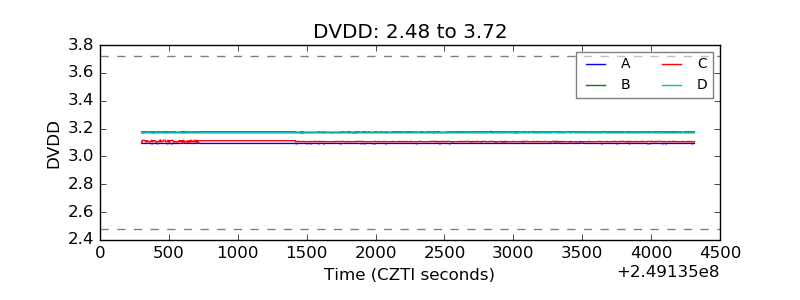 |
| Temperature 1 | 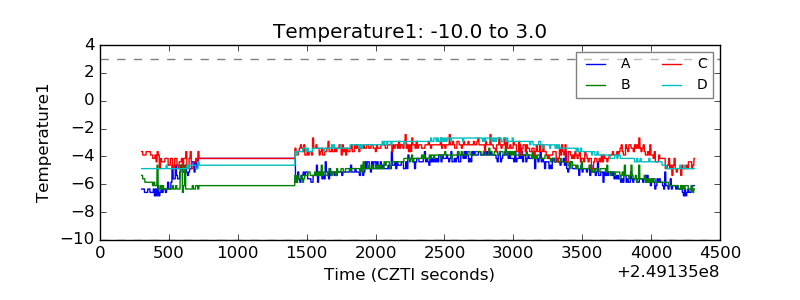 |
| Veto HV Monitor | 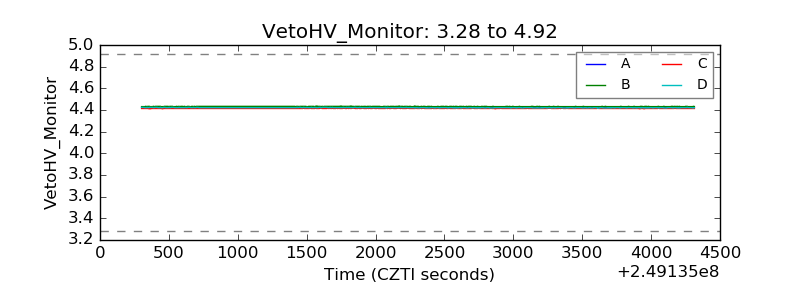 |
| Veto LLD | 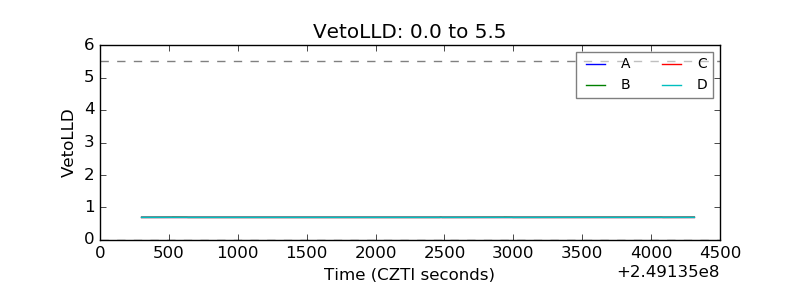 |
| Alpha Counter | 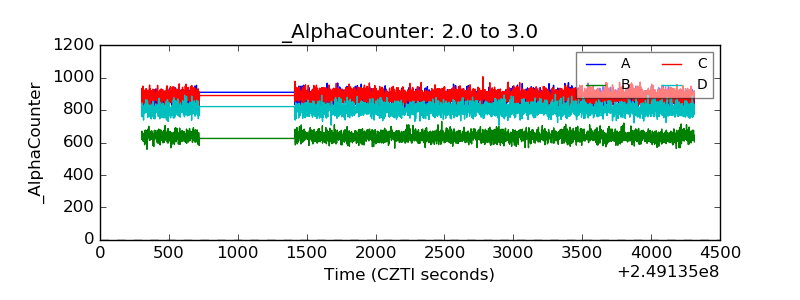 |
| _CPM_Rate | 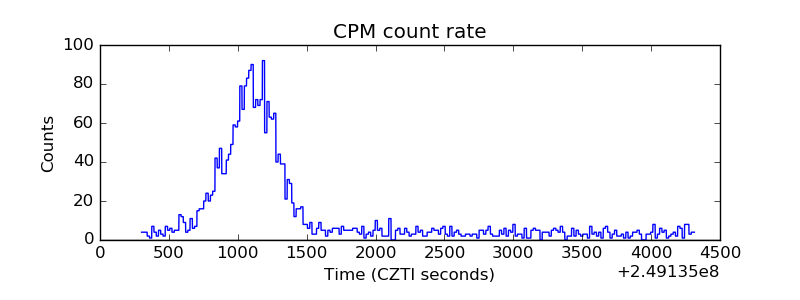 |
| CZT Counter | 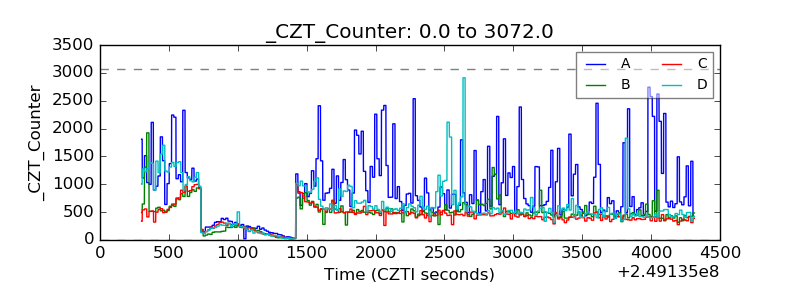 |
| +2.5 Volts monitor |  |
| +5 Volts monitor |  |
| _ROLL_ROT | 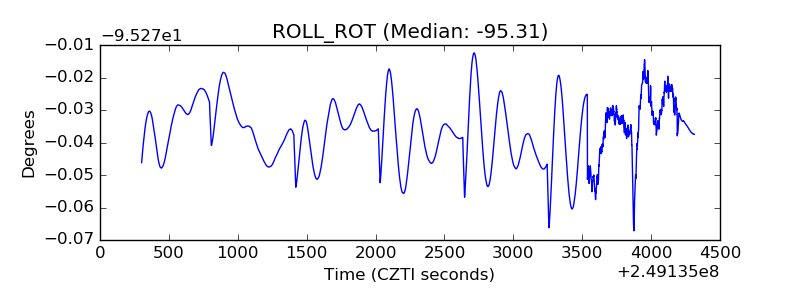 |
| _Roll_DEC | 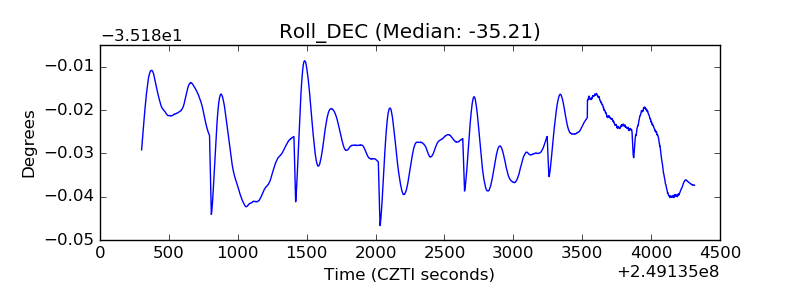 |
| _Roll_RA | 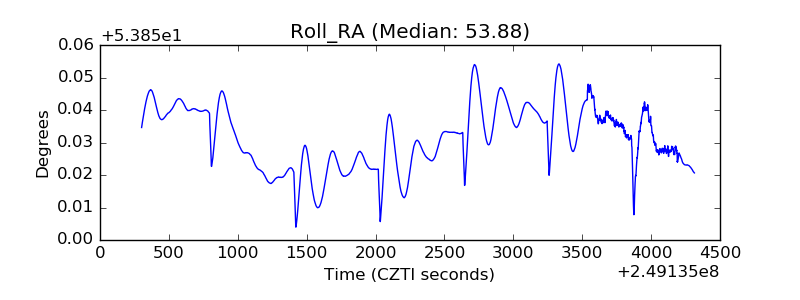 |
| Veto Counter | 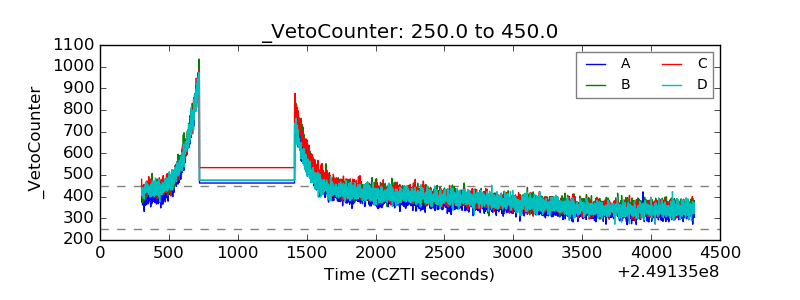 |