| Param | Original file | Final file |
|---|---|---|
| Filename | modeM0/AS1A04_037T02_9000001718cztM0_level2.fits | modeM0/AS1A04_037T02_9000001718cztM0_level2_quad_clean.evt |
| Size (bytes) | 341,795,520 | 327,251,520 |
| Size | 326.0 MB | 312.1 MB |
| Events in quadrant A | 2,003,154 | 1,918,610 |
| Events in quadrant B | 2,008,176 | 1,983,966 |
| Events in quadrant C | 2,059,376 | 1,866,175 |
| Events in quadrant D | 1,698,260 | 1,561,570 |
| Mode M0 | |||
|---|---|---|---|
| Quadrant | BADHDUFLAG | Total packets | Discarded packets |
| A | 0 | 108905 | 0 |
| B | 0 | 79857 | 0 |
| C | 0 | 76563 | 0 |
| D | 0 | 116945 | 0 |
| Mode SS | |||
|---|---|---|---|
| Quadrant | BADHDUFLAG | Total packets | Discarded packets |
| A | 0 | 766 | 0 |
| B | 0 | 766 | 0 |
| C | 0 | 766 | 0 |
| D | 0 | 766 | 0 |
| Mode M9 | |||
|---|---|---|---|
| Quadrant | BADHDUFLAG | Total packets | Discarded packets |
| A | 0 | 42 | 0 |
| B | 0 | 42 | 0 |
| C | 0 | 42 | 0 |
| D | 0 | 42 | 0 |
| Quadrant | Total seconds | Saturated seconds | Saturation percentage |
|---|---|---|---|
| A | 37559 | 2274 | 6.054474% |
| B | 37559 | 392 | 1.043691% |
| C | 37559 | 106 | 0.282223% |
| D | 37559 | 4217 | 11.227668% |
Noise dominated data is calculated using 1-second bins in cleaned event files. If a bin has >2000 counts, and if more than 50% of those come from <1% of pixels, then it is considered to be noise-dominated and hence unusable.
| Quadrant | # 1 sec bins | Bins with >0 counts | Bins with >2000 counts | High rate bins dominated by noise | Noise dominated (total time) | Noise dominated (detector-on time) | Marked lightcurve |
|---|---|---|---|---|---|---|---|
| A | 41749 | 37550 | 0 | 0 | 0.00% | 0.00% |  |
| B | 41749 | 37559 | 0 | 0 | 0.00% | 0.00% |  |
| C | 41749 | 37559 | 0 | 0 | 0.00% | 0.00% |  |
| D | 41749 | 37558 | 0 | 0 | 0.00% | 0.00% |  |
Top three noisy pixels from each quadrant. If the there are fewer than three noisy pixels in the level2.evt file, extra rows are filled as -1
| Pixel properties | Quadrant properties | ||||||
|---|---|---|---|---|---|---|---|
| Quadrant | DetID | PixID | Counts | Sigma | Mean | Median | Sigma |
| A | 0 | 29 | 2023 | 11.38 | 521 | 486 | 135.1 |
| A | 7 | 110 | 1652 | 8.63 | 521 | 486 | 135.1 |
| A | 0 | 30 | 1551 | 7.89 | 521 | 486 | 135.1 |
| B | 2 | 9 | 1749 | 11.35 | 529 | 500 | 110.1 |
| B | 5 | 128 | 1359 | 7.8 | 529 | 500 | 110.1 |
| B | 2 | 8 | 1357 | 7.78 | 529 | 500 | 110.1 |
| C | 1 | 81 | 1558 | 7.33 | 543 | 502 | 144.0 |
| C | 1 | 80 | 1537 | 7.19 | 543 | 502 | 144.0 |
| C | 12 | 241 | 1481 | 6.8 | 543 | 502 | 144.0 |
| D | 3 | 14 | 1350 | 6.97 | 484 | 439 | 130.7 |
| D | 6 | 231 | 1232 | 6.07 | 484 | 439 | 130.7 |
| D | 3 | 31 | 1205 | 5.86 | 484 | 439 | 130.7 |
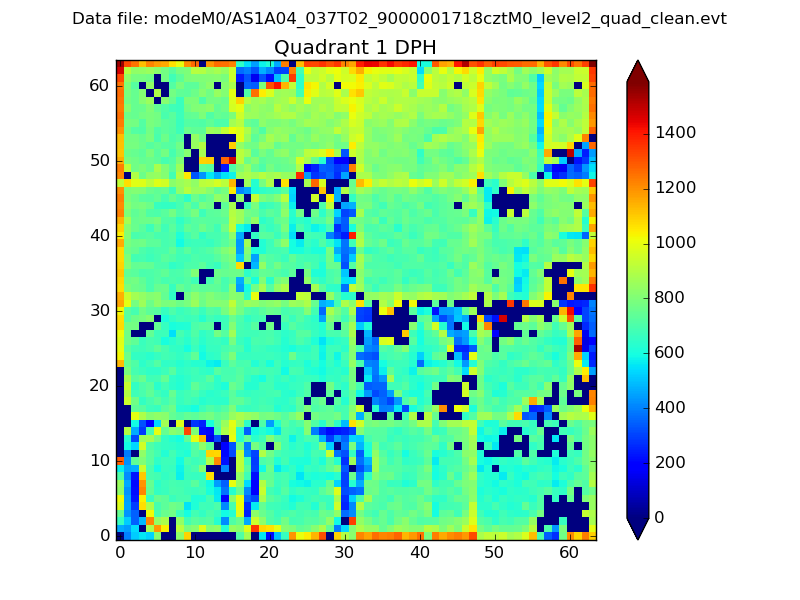
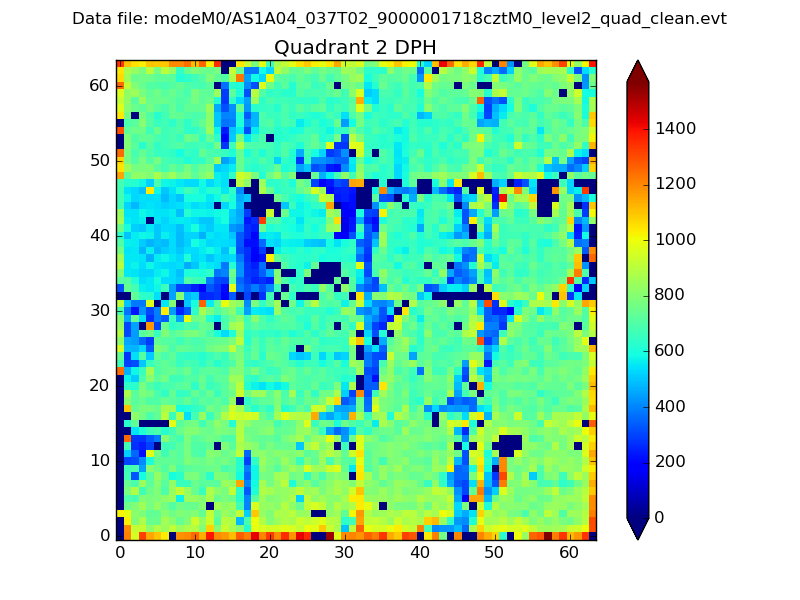
Histogram calculated using DETX and DETY for each event in the final _common_clean file
| Quadrant A |  |
 |
Quadrant B |
|---|---|---|---|
| Quadrant D |  |
 |
Quadrant C |
| Plot type | Count rate plots | Images |
|---|---|---|
| Comparison with Poisson distribution Blue bars denote a histogram of data divided into 1 sec bins. Red curve is a Poisson curve with rate = median count rate of data. |
 |
 |
| Quadrant-wise count rates Data is divided into 100 sec bins |
 |
|
| Module-wise count rates for Quadrant A Data is divided into 100 sec bins |
 |
 |
| Module-wise count rates for Quadrant B Data is divided into 100 sec bins |
 |
 |
| Module-wise count rates for Quadrant C Data is divided into 100 sec bins |
 |
 |
| Module-wise count rates for Quadrant D Data is divided into 100 sec bins |
 |
 |
| Parameter | Plot |
|---|---|
| CZT HV Monitor |  |
| D_VDD | 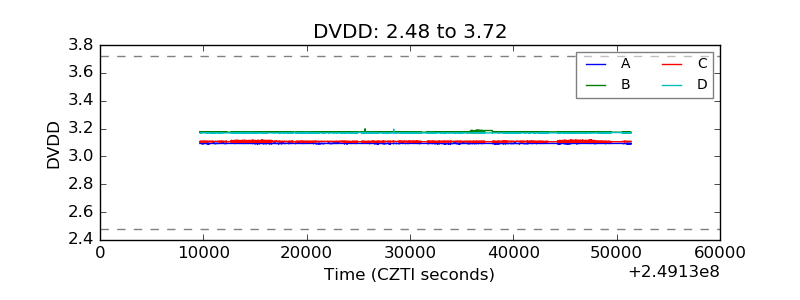 |
| Temperature 1 |  |
| Veto HV Monitor |  |
| Veto LLD |  |
| Alpha Counter |  |
| _CPM_Rate |  |
| CZT Counter |  |
| +2.5 Volts monitor |  |
| +5 Volts monitor |  |
| _ROLL_ROT |  |
| _Roll_DEC |  |
| _Roll_RA |  |
| Veto Counter |  |