| Param | Original file | Final file |
|---|---|---|
| Filename | modeM0/AS1A04_037T02_9000001718_11655cztM0_level2.evt | modeM0/AS1A04_037T02_9000001718_11655cztM0_level2_quad_clean.evt |
| Size (bytes) | 374,837,760 | 46,241,280 |
| Size | 357.5 MB | 44.1 MB |
| Events in quadrant A | 3,687,546 | 274,168 |
| Events in quadrant B | 2,113,862 | 287,831 |
| Events in quadrant C | 1,975,534 | 281,581 |
| Events in quadrant D | 3,294,435 | 265,705 |
| Mode M0 | |||
|---|---|---|---|
| Quadrant | BADHDUFLAG | Total packets | Discarded packets |
| A | 0 | 13731 | 2 |
| B | 0 | 8848 | 1 |
| C | 0 | 8592 | 1 |
| D | 0 | 12540 | 1 |
| Mode SS | |||
|---|---|---|---|
| Quadrant | BADHDUFLAG | Total packets | Discarded packets |
| A | 0 | 84 | 0 |
| B | 0 | 84 | 0 |
| C | 0 | 84 | 0 |
| D | 0 | 84 | 0 |
| Mode M9 | |||
|---|---|---|---|
| Quadrant | BADHDUFLAG | Total packets | Discarded packets |
| A | 0 | 4 | 0 |
| B | 0 | 4 | 0 |
| C | 0 | 4 | 0 |
| D | 0 | 4 | 0 |
| Quadrant | Total seconds | Saturated seconds | Saturation percentage |
|---|---|---|---|
| A | 4121 | 642 | 15.578743% |
| B | 4121 | 97 | 2.353798% |
| C | 4121 | 36 | 0.873574% |
| D | 4121 | 479 | 11.623392% |
Noise dominated data is calculated using 1-second bins in cleaned event files. If a bin has >2000 counts, and if more than 50% of those come from <1% of pixels, then it is considered to be noise-dominated and hence unusable.
| Quadrant | # 1 sec bins | Bins with >0 counts | Bins with >2000 counts | High rate bins dominated by noise | Noise dominated (total time) | Noise dominated (detector-on time) | Marked lightcurve |
|---|---|---|---|---|---|---|---|
| A | 4512 | 4123 | 316 | 316 | 7.00% | 7.66% | 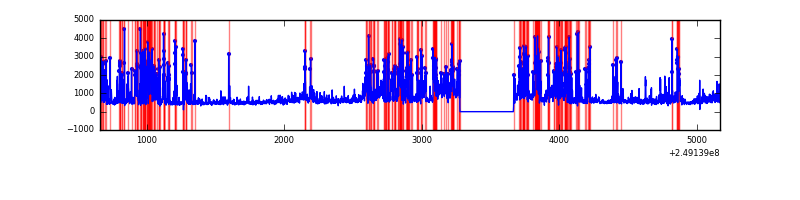 |
| B | 4512 | 4123 | 8 | 8 | 0.18% | 0.19% | 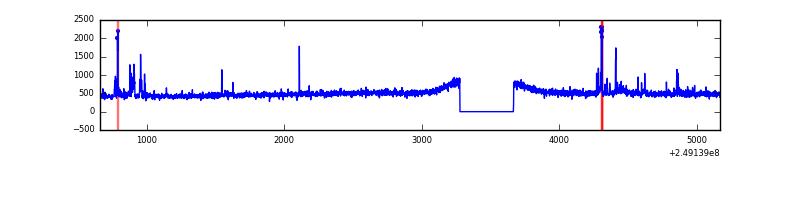 |
| C | 4512 | 4123 | 0 | 0 | 0.00% | 0.00% |  |
| D | 4512 | 4123 | 291 | 291 | 6.45% | 7.06% | 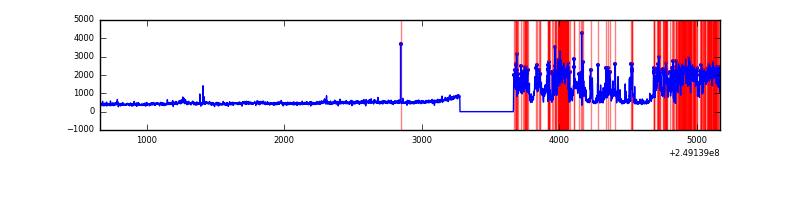 |
Top three noisy pixels from each quadrant. If the there are fewer than three noisy pixels in the level2.evt file, extra rows are filled as -1
| Pixel properties | Quadrant properties | ||||||
|---|---|---|---|---|---|---|---|
| Quadrant | DetID | PixID | Counts | Sigma | Mean | Median | Sigma |
| A | 8 | 5 | 1557629 | 15880.26 | 475 | 464 | 98.1 |
| A | 1 | 162 | 111911 | 1136.55 | 475 | 464 | 98.1 |
| A | 1 | 178 | 65060 | 658.76 | 475 | 464 | 98.1 |
| B | 4 | 239 | 86868 | 861.93 | 512 | 497 | 100.2 |
| B | 15 | 204 | 24252 | 237.06 | 512 | 497 | 100.2 |
| B | 12 | 111 | 11883 | 113.63 | 512 | 497 | 100.2 |
| C | 8 | 128 | 4562 | 34.22 | 504 | 505 | 118.6 |
| C | 13 | 61 | 3783 | 27.65 | 504 | 505 | 118.6 |
| C | 1 | 3 | 2570 | 17.42 | 504 | 505 | 118.6 |
| D | 13 | 104 | 1289895 | 10957.91 | 483 | 466 | 117.7 |
| D | 1 | 52 | 64278 | 542.29 | 483 | 466 | 117.7 |
| D | 8 | 195 | 48685 | 409.78 | 483 | 466 | 117.7 |
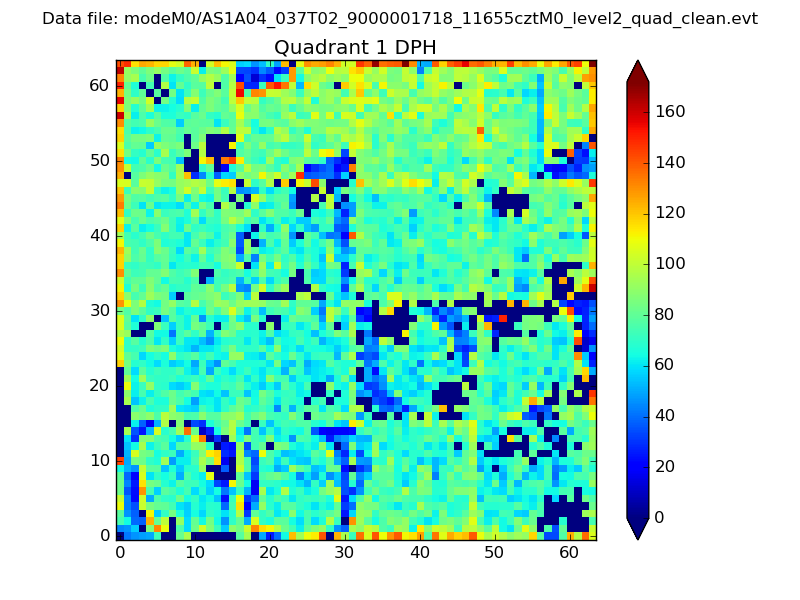
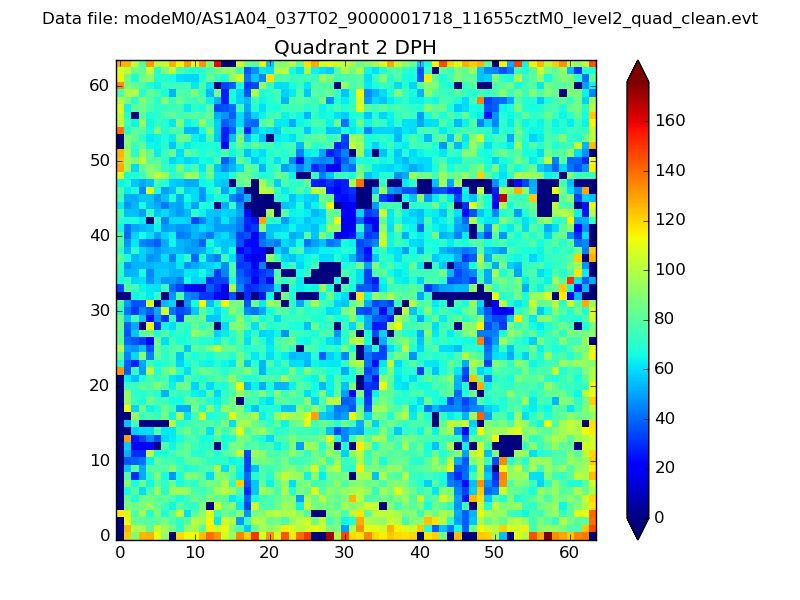
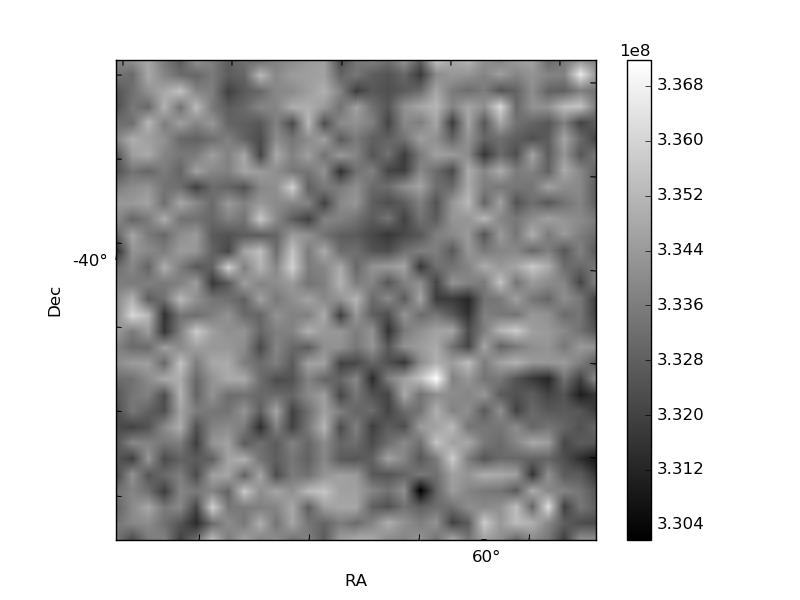
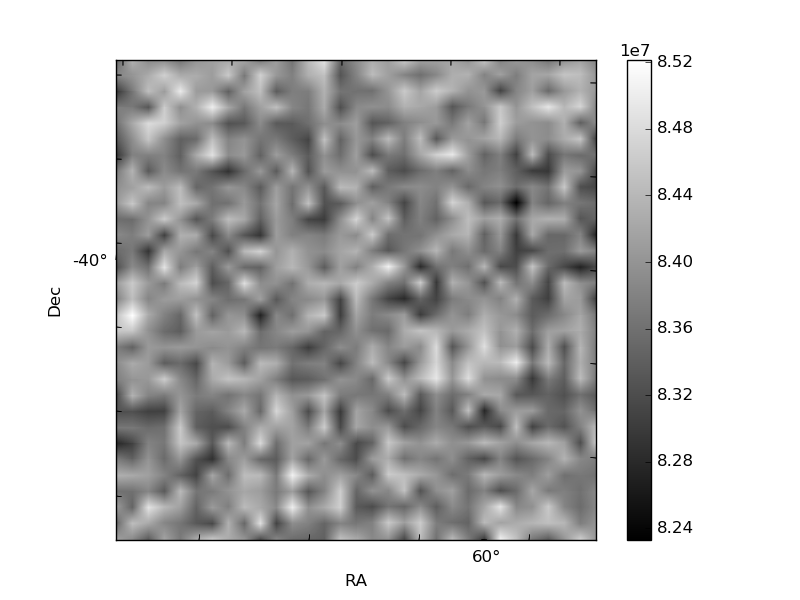
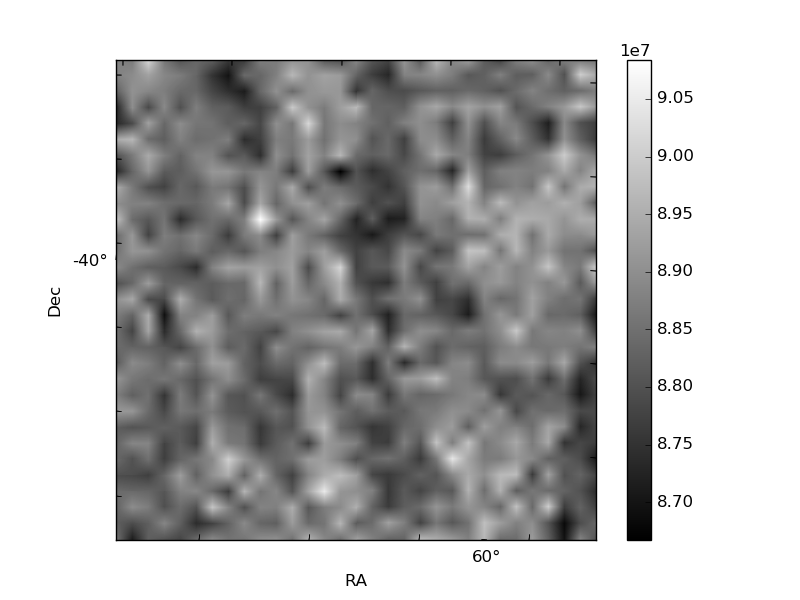
Histogram calculated using DETX and DETY for each event in the final _common_clean file
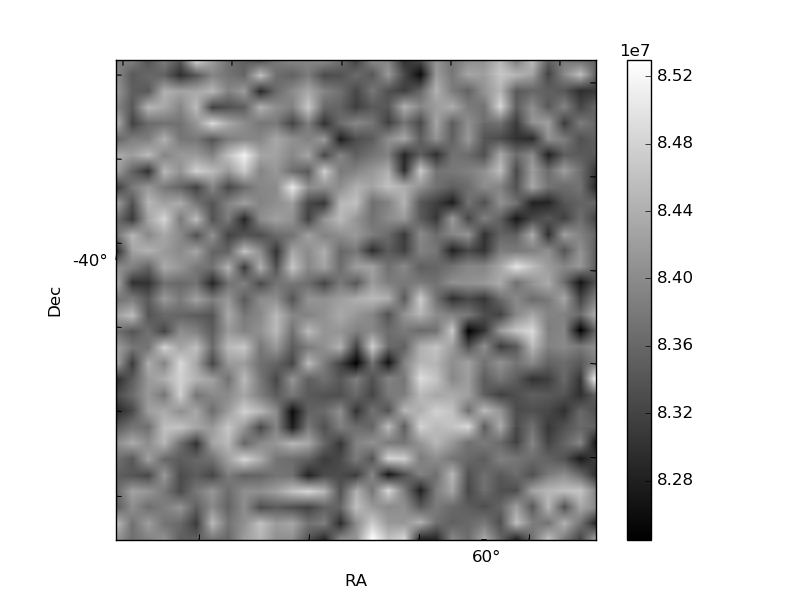
| Quadrant A | 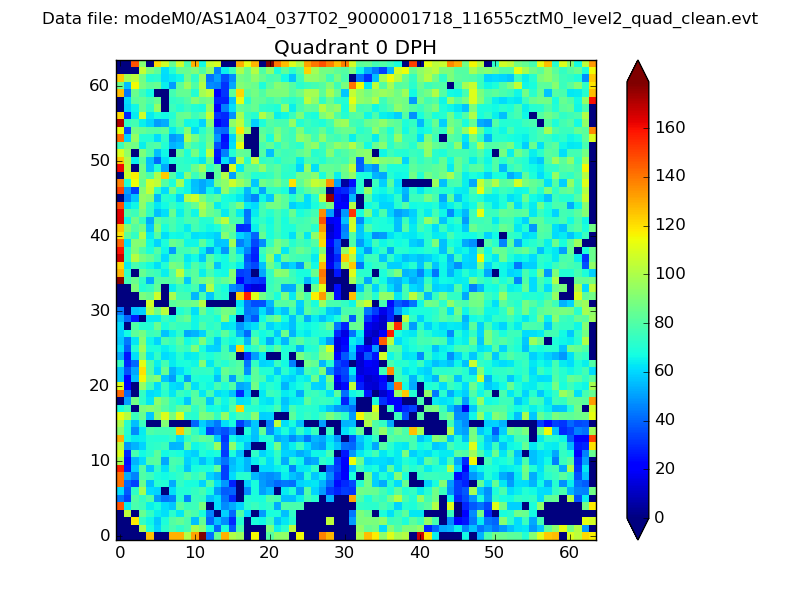 |
 |
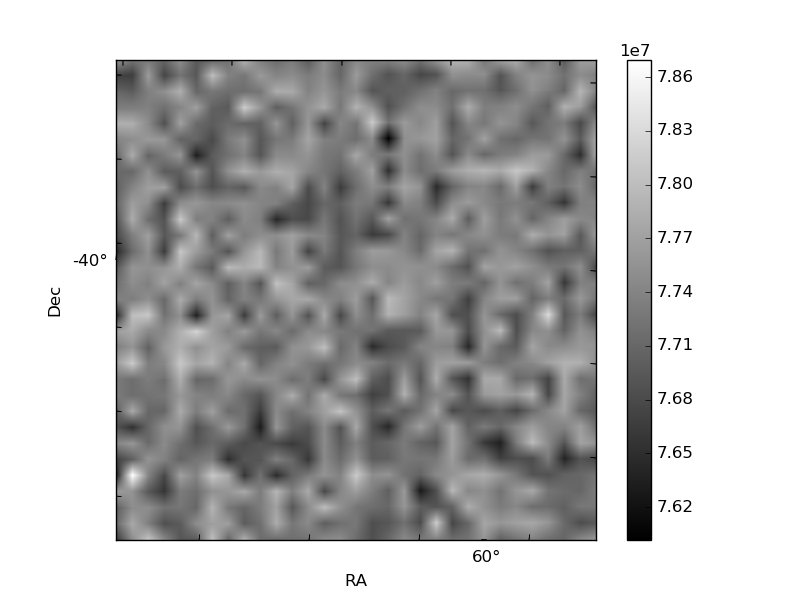
Quadrant B |
|---|---|---|---|
| Quadrant D | 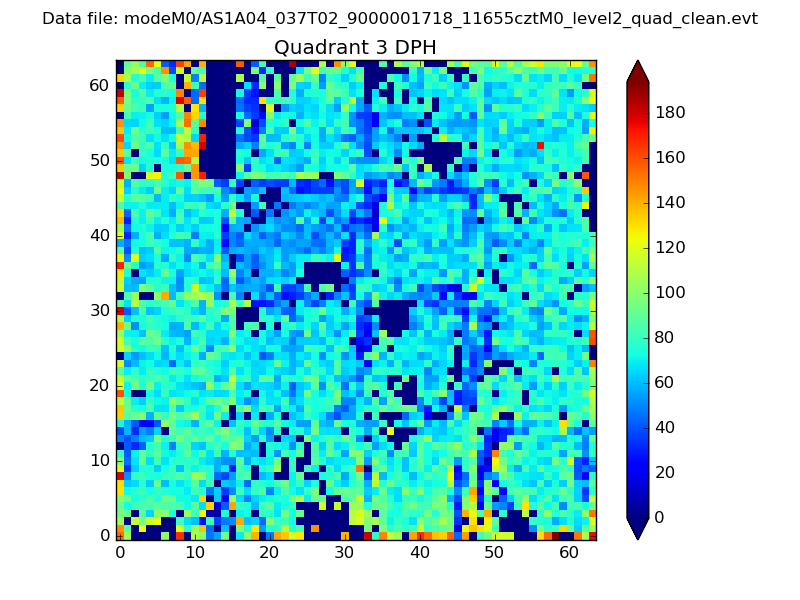 |
 |
Quadrant C |
| Plot type | Count rate plots | Images |
|---|---|---|
| Comparison with Poisson distribution Blue bars denote a histogram of data divided into 1 sec bins. Red curve is a Poisson curve with rate = median count rate of data. |
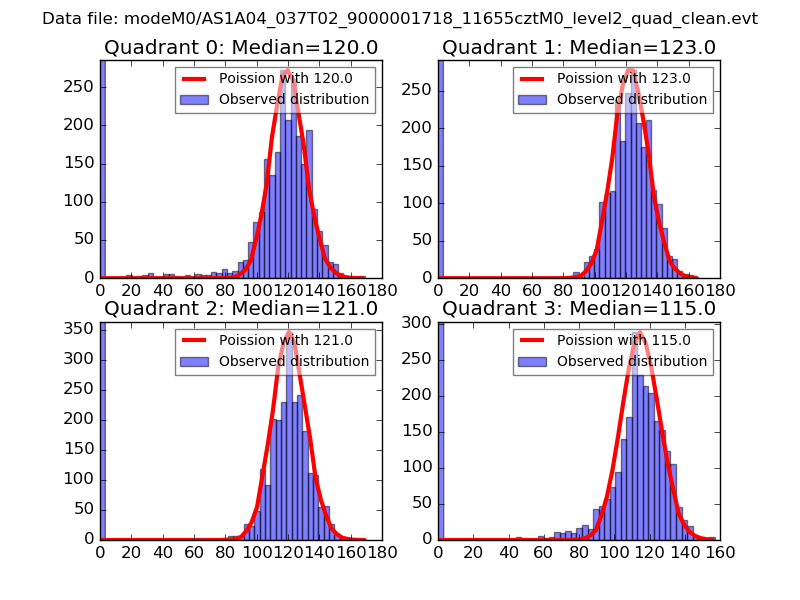 |
 |
| Quadrant-wise count rates Data is divided into 100 sec bins |
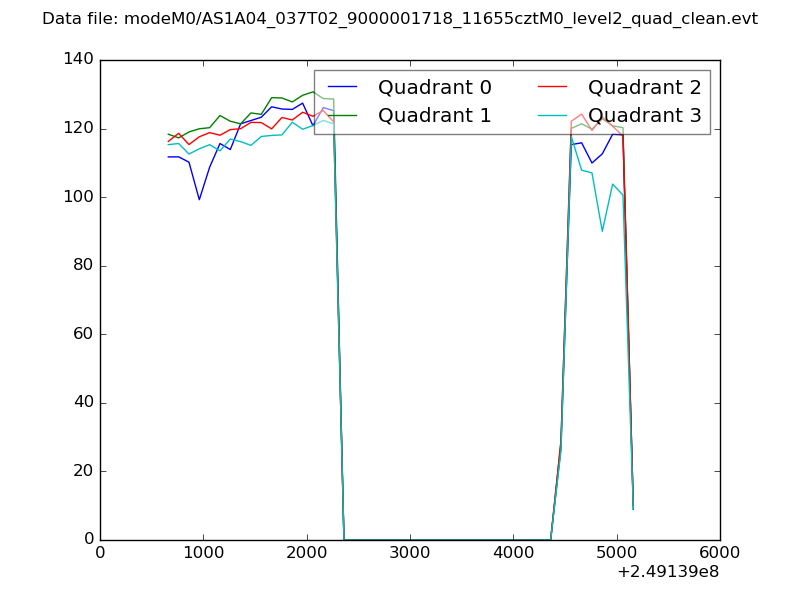 |
|
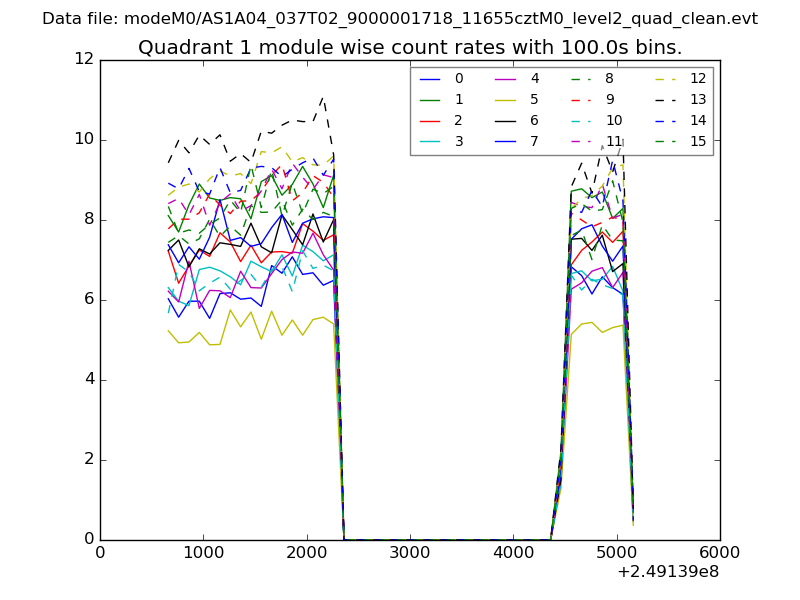
| Module-wise count rates for Quadrant A Data is divided into 100 sec bins |
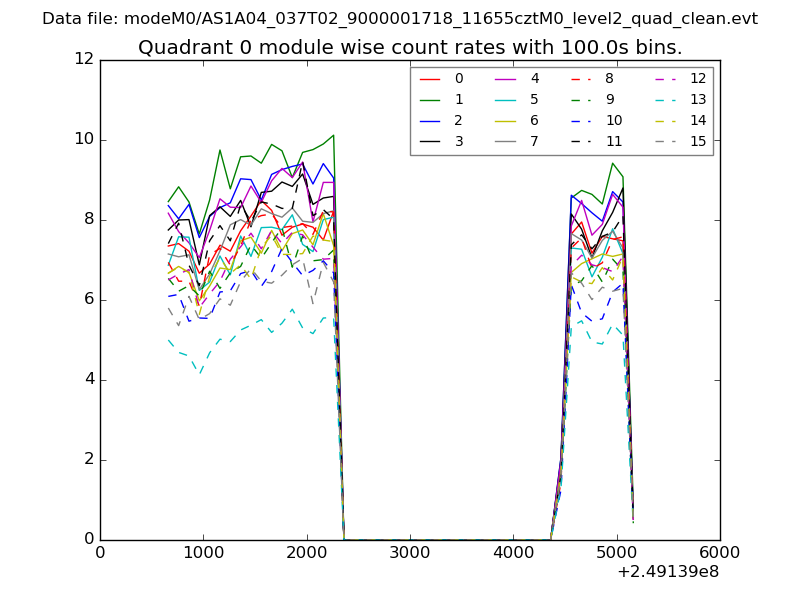 |
 |
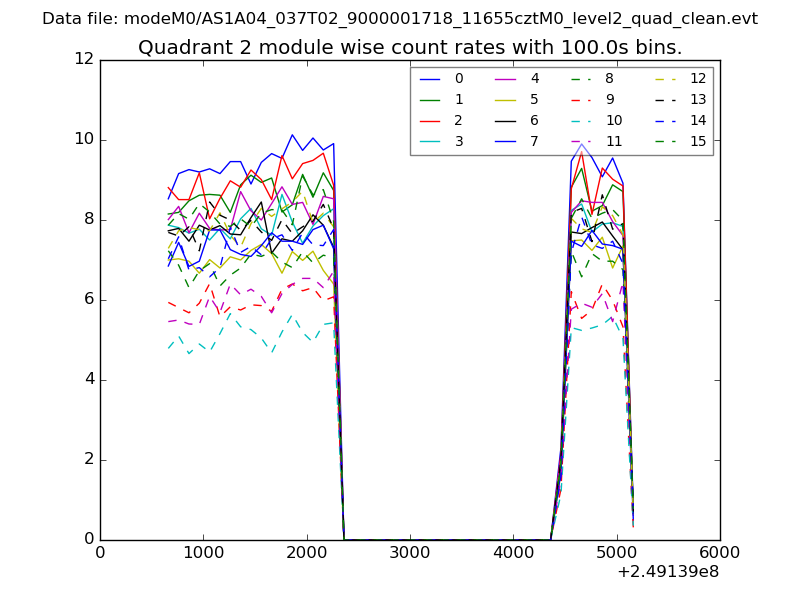
| Module-wise count rates for Quadrant B Data is divided into 100 sec bins |
 |
 |
| Module-wise count rates for Quadrant C Data is divided into 100 sec bins |
 |
 |
| Module-wise count rates for Quadrant D Data is divided into 100 sec bins |
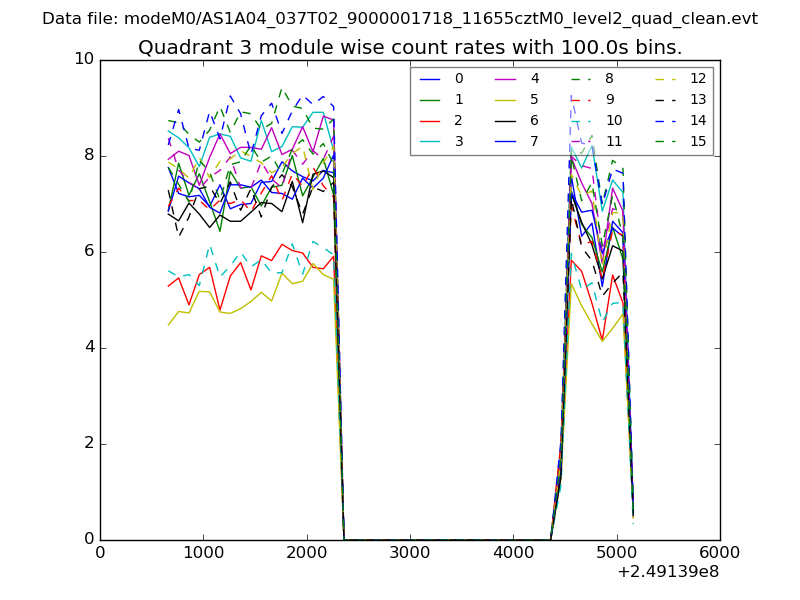 |
 |
| Parameter | Plot |
|---|---|
| CZT HV Monitor | 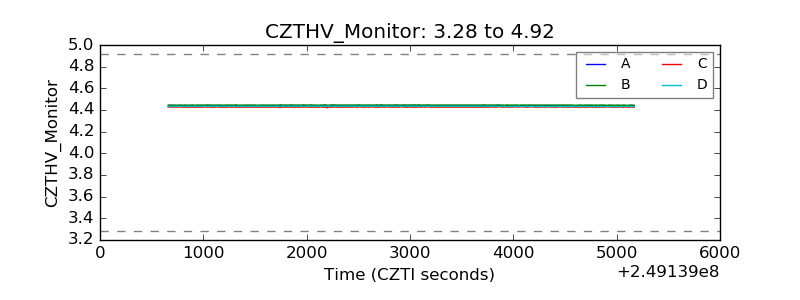 |
| D_VDD | 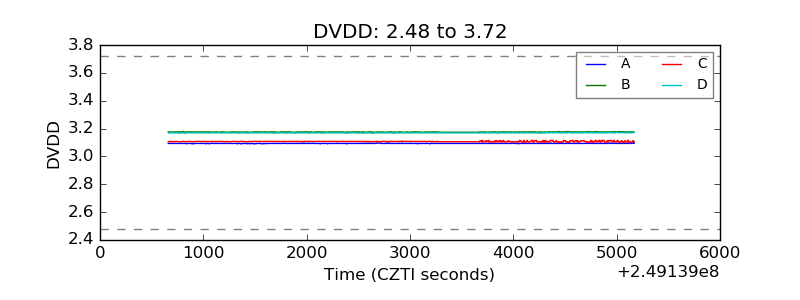 |
| Temperature 1 |  |
| Veto HV Monitor | 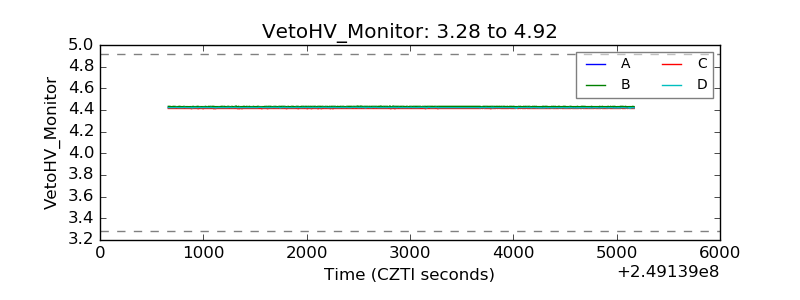 |
| Veto LLD | 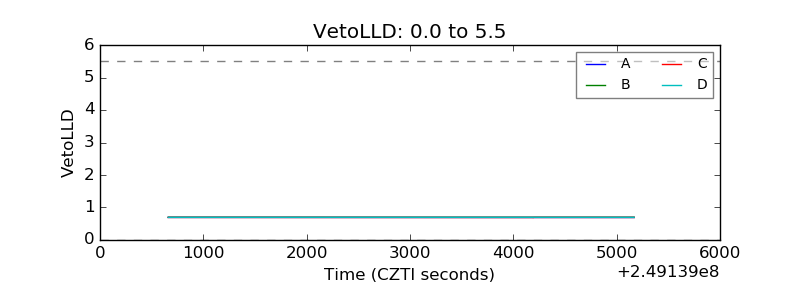 |
| Alpha Counter | 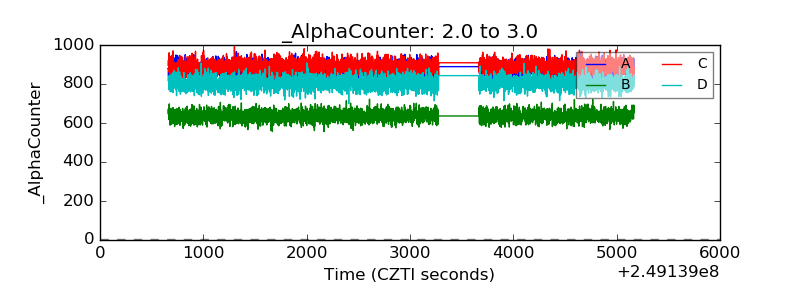 |
| _CPM_Rate | 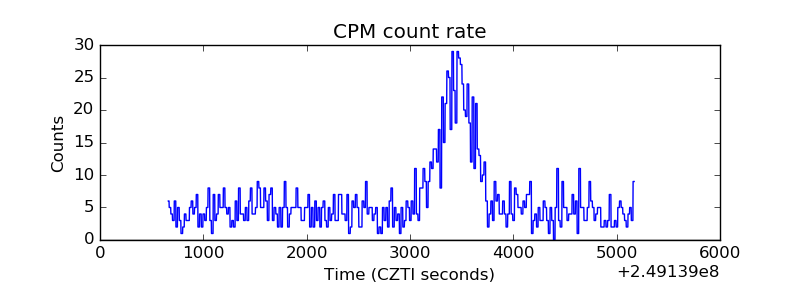 |
| CZT Counter | 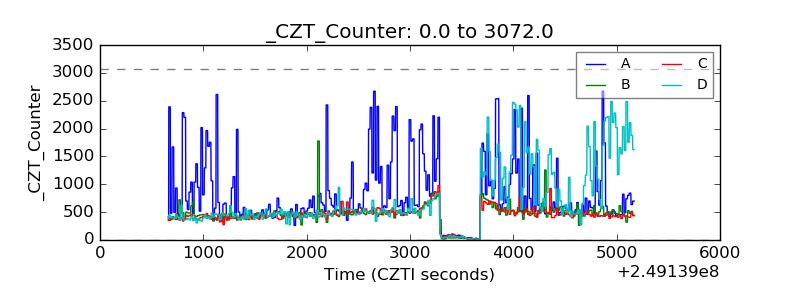 |
| +2.5 Volts monitor |  |
| +5 Volts monitor |  |
| _ROLL_ROT | 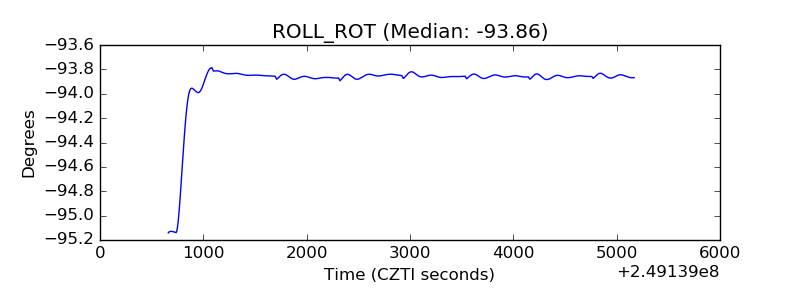 |
| _Roll_DEC | 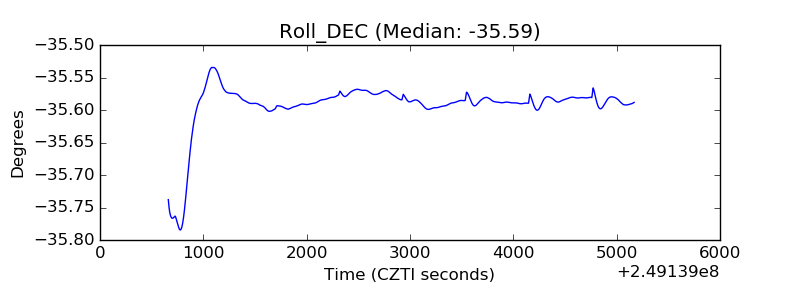 |
| _Roll_RA | 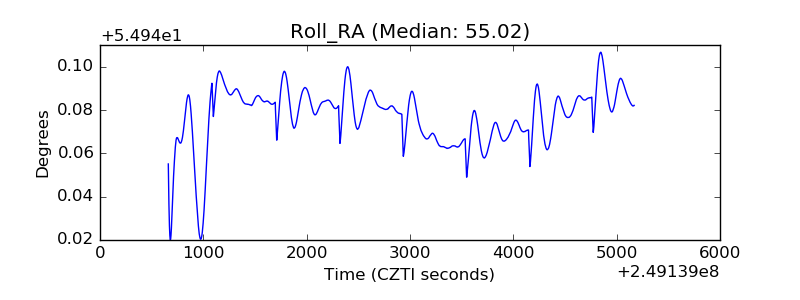 |
| Veto Counter | 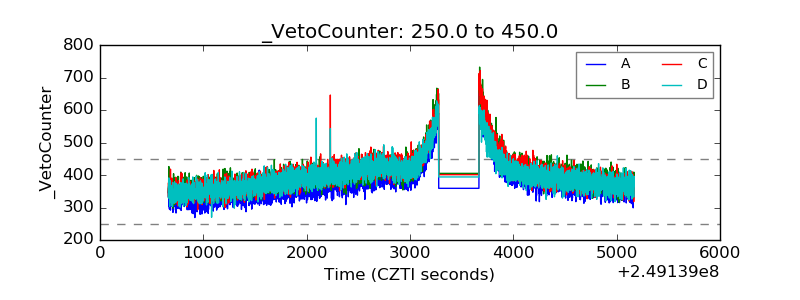 |