| Param | Original file | Final file |
|---|---|---|
| Filename | modeM0/AS1A04_037T02_9000001718_11656cztM0_level2.evt | modeM0/AS1A04_037T02_9000001718_11656cztM0_level2_quad_clean.evt |
| Size (bytes) | 782,213,760 | 93,847,680 |
| Size | 746.0 MB | 89.5 MB |
| Events in quadrant A | 5,954,296 | 574,953 |
| Events in quadrant B | 4,077,803 | 601,457 |
| Events in quadrant C | 3,674,478 | 588,212 |
| Events in quadrant D | 9,445,010 | 523,986 |
| Mode M0 | |||
|---|---|---|---|
| Quadrant | BADHDUFLAG | Total packets | Discarded packets |
| A | 0 | 23017 | 3 |
| B | 0 | 17230 | 2 |
| C | 0 | 16490 | 2 |
| D | 0 | 33462 | 2 |
| Mode SS | |||
|---|---|---|---|
| Quadrant | BADHDUFLAG | Total packets | Discarded packets |
| A | 0 | 164 | 0 |
| B | 0 | 164 | 0 |
| C | 0 | 164 | 0 |
| D | 0 | 164 | 0 |
| Mode M9 | |||
|---|---|---|---|
| Quadrant | BADHDUFLAG | Total packets | Discarded packets |
| A | 0 | 6 | 0 |
| B | 0 | 6 | 0 |
| C | 0 | 6 | 0 |
| D | 0 | 6 | 0 |
| Quadrant | Total seconds | Saturated seconds | Saturation percentage |
|---|---|---|---|
| A | 7948 | 662 | 8.329139% |
| B | 7948 | 173 | 2.176648% |
| C | 7948 | 52 | 0.654253% |
| D | 7948 | 2030 | 25.541017% |
Noise dominated data is calculated using 1-second bins in cleaned event files. If a bin has >2000 counts, and if more than 50% of those come from <1% of pixels, then it is considered to be noise-dominated and hence unusable.
| Quadrant | # 1 sec bins | Bins with >0 counts | Bins with >2000 counts | High rate bins dominated by noise | Noise dominated (total time) | Noise dominated (detector-on time) | Marked lightcurve |
|---|---|---|---|---|---|---|---|
| A | 8574 | 7952 | 321 | 321 | 3.74% | 4.04% | 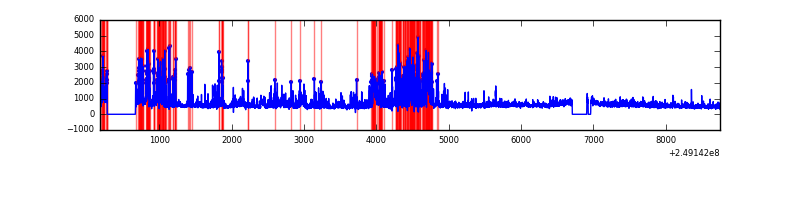 |
| B | 8574 | 7952 | 22 | 22 | 0.26% | 0.28% | 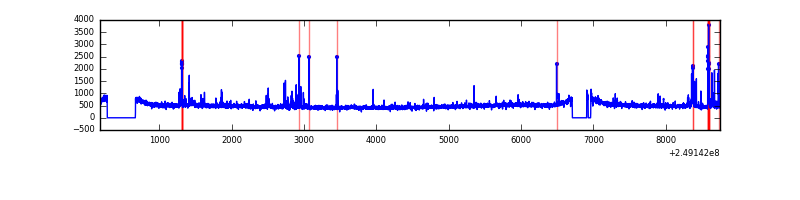 |
| C | 8574 | 7952 | 0 | 0 | 0.00% | 0.00% |  |
| D | 8574 | 7952 | 1507 | 1507 | 17.58% | 18.95% | 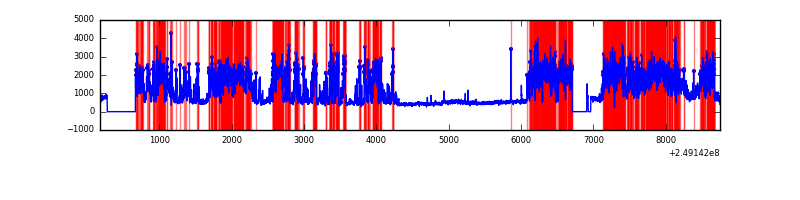 |
Top three noisy pixels from each quadrant. If the there are fewer than three noisy pixels in the level2.evt file, extra rows are filled as -1
| Pixel properties | Quadrant properties | ||||||
|---|---|---|---|---|---|---|---|
| Quadrant | DetID | PixID | Counts | Sigma | Mean | Median | Sigma |
| A | 8 | 5 | 1693542 | 8872.92 | 931 | 909 | 190.8 |
| A | 1 | 162 | 257213 | 1343.57 | 931 | 909 | 190.8 |
| A | 1 | 178 | 151108 | 787.36 | 931 | 909 | 190.8 |
| B | 4 | 239 | 213391 | 1133.24 | 963 | 937 | 187.5 |
| B | 15 | 204 | 76775 | 404.52 | 963 | 937 | 187.5 |
| B | 12 | 111 | 22330 | 114.11 | 963 | 937 | 187.5 |
| C | 8 | 128 | 9853 | 40.85 | 936 | 939 | 218.2 |
| C | 13 | 61 | 6987 | 27.72 | 936 | 939 | 218.2 |
| C | 15 | 225 | 5264 | 19.82 | 936 | 939 | 218.2 |
| D | 13 | 104 | 5803698 | 28422.7 | 848 | 822 | 204.2 |
| D | 8 | 195 | 147819 | 720.0 | 848 | 822 | 204.2 |
| D | 1 | 52 | 84897 | 411.8 | 848 | 822 | 204.2 |
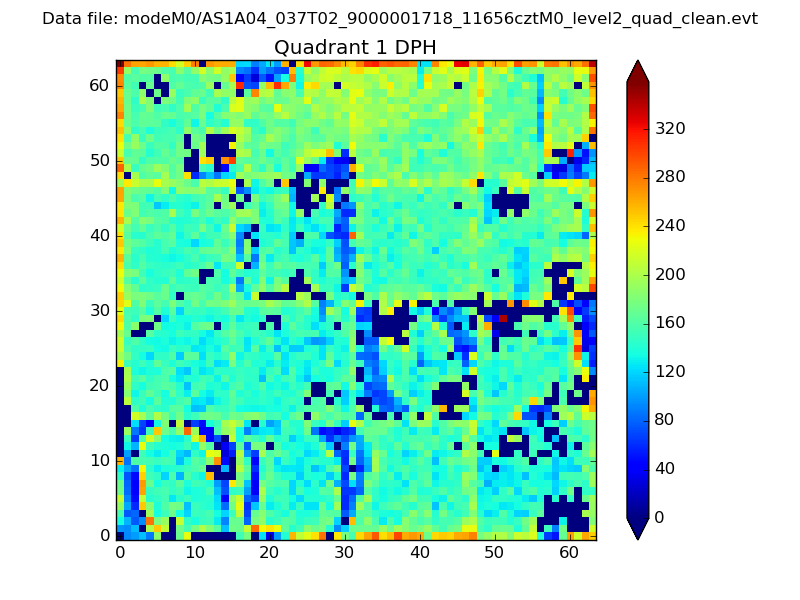
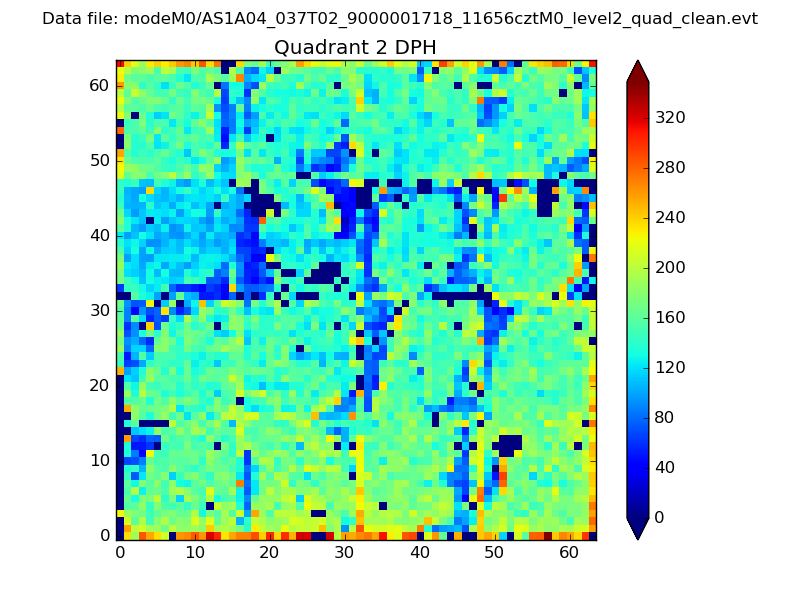
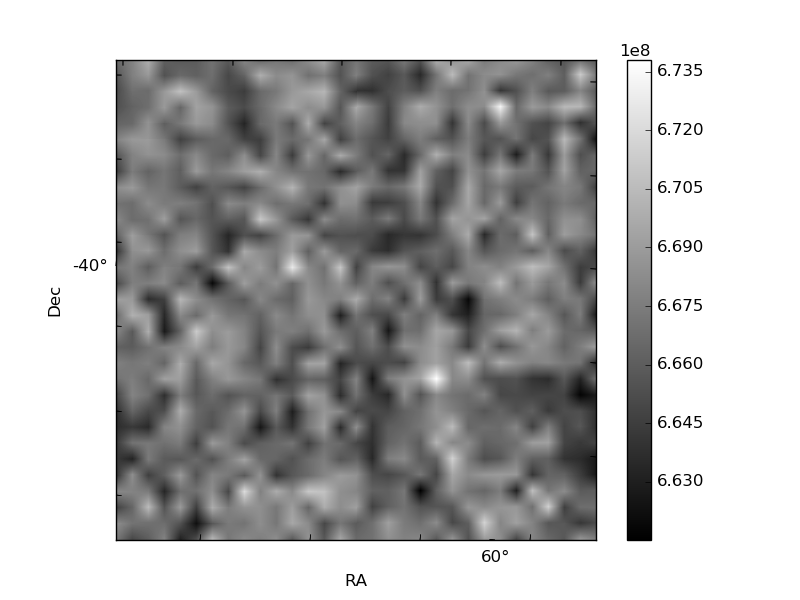
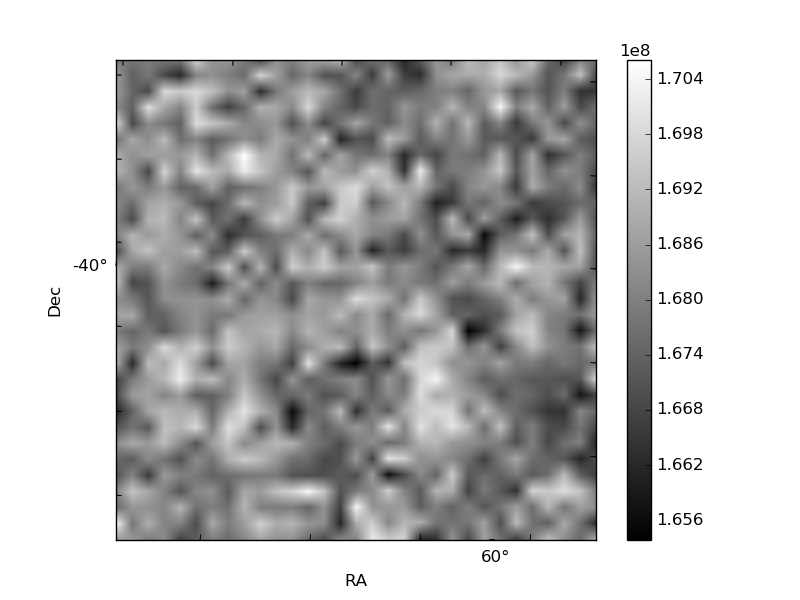
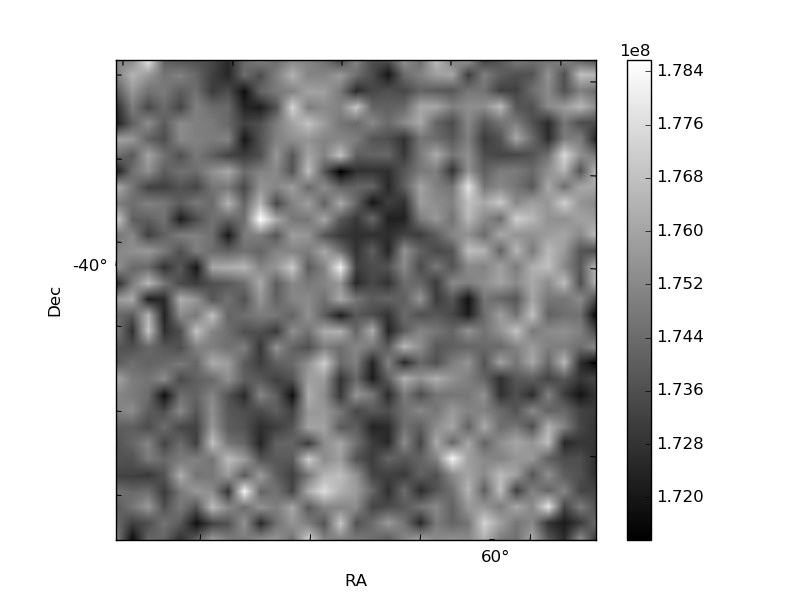
Histogram calculated using DETX and DETY for each event in the final _common_clean file
| Quadrant A | 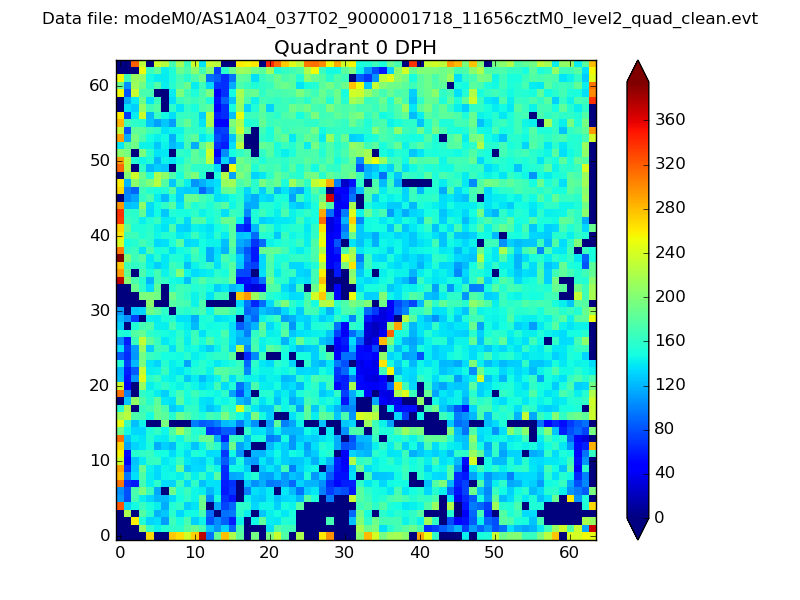 |
 |
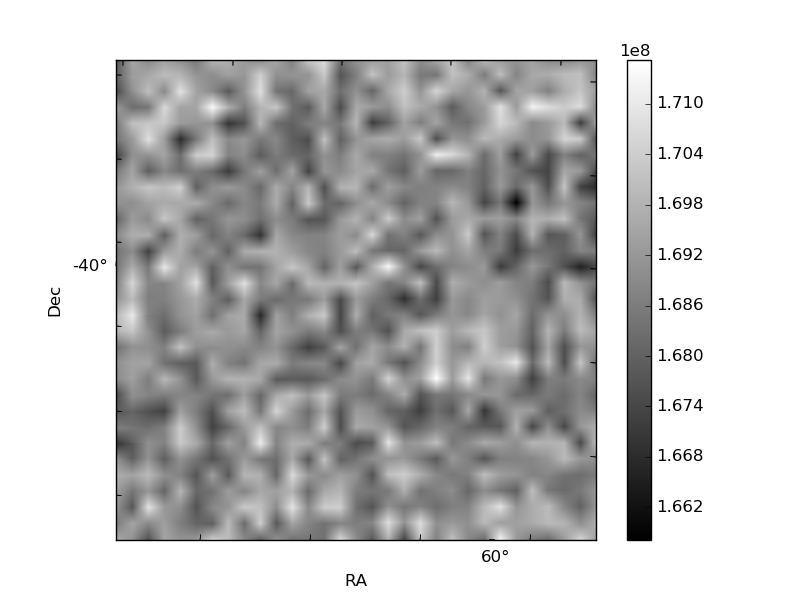
Quadrant B |
|---|---|---|---|
| Quadrant D | 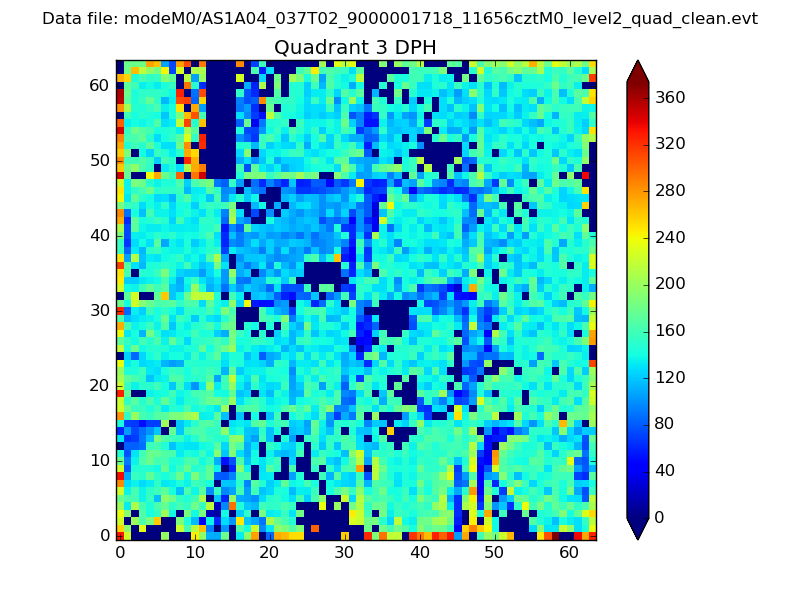 |
 |
Quadrant C |
| Plot type | Count rate plots | Images |
|---|---|---|
| Comparison with Poisson distribution Blue bars denote a histogram of data divided into 1 sec bins. Red curve is a Poisson curve with rate = median count rate of data. |
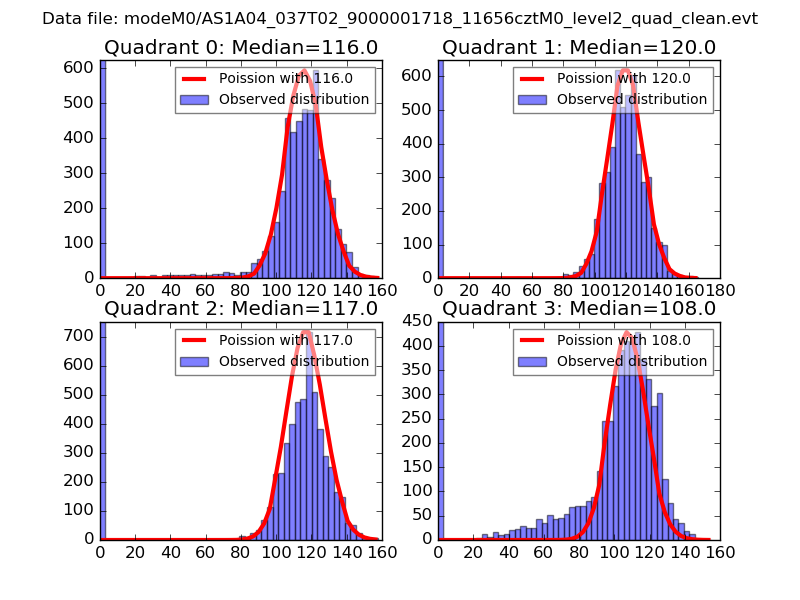 |
 |
| Quadrant-wise count rates Data is divided into 100 sec bins |
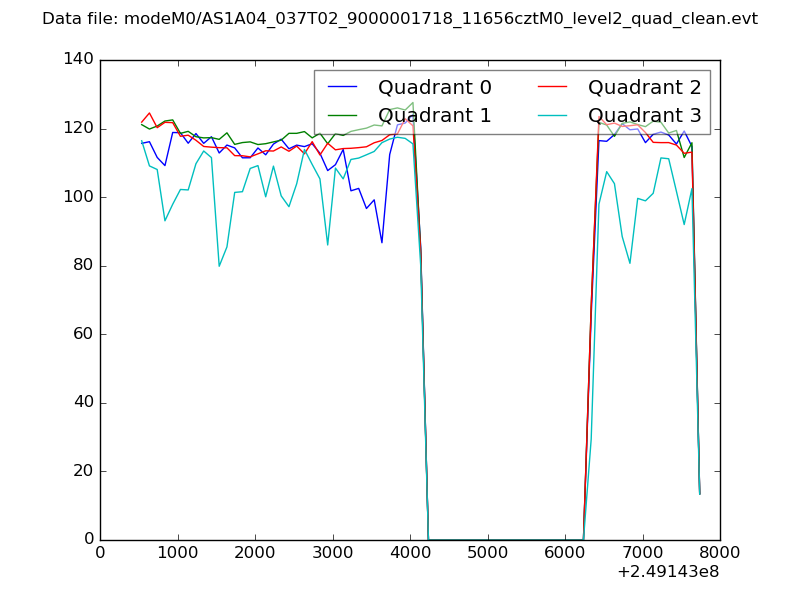 |
|
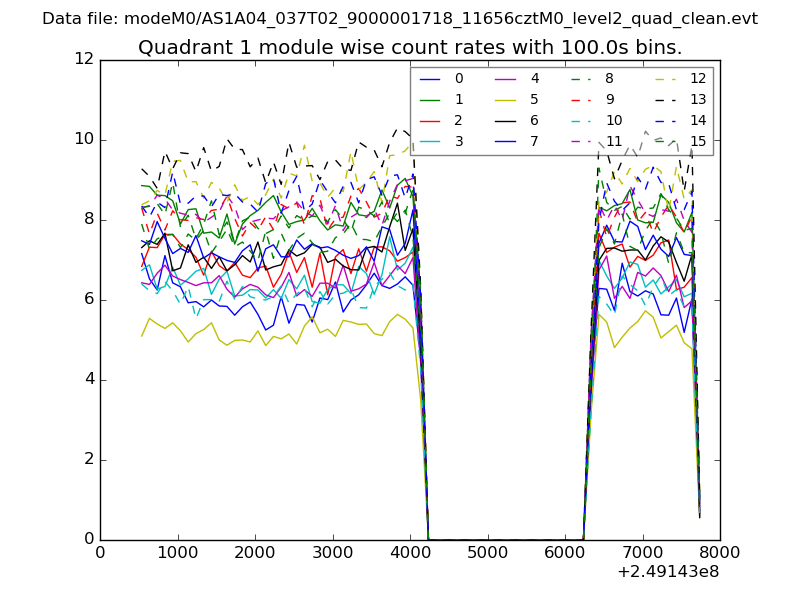
| Module-wise count rates for Quadrant A Data is divided into 100 sec bins |
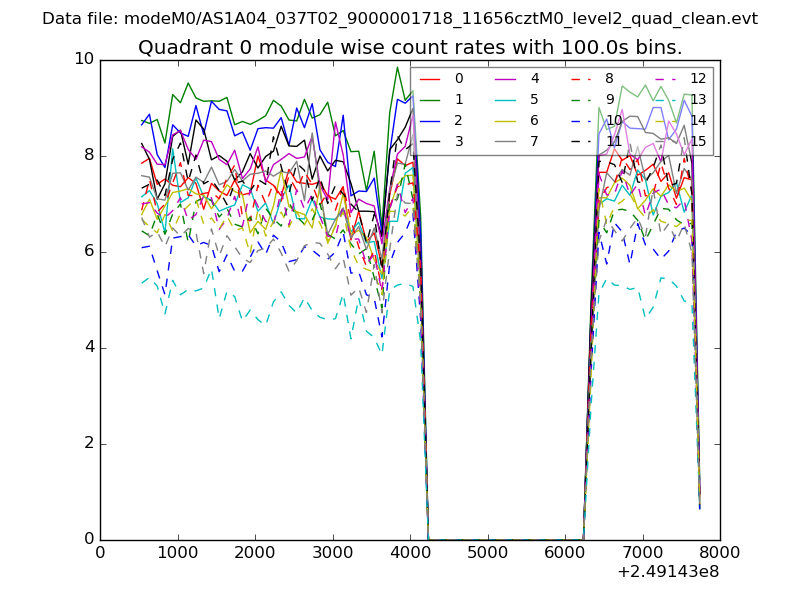 |
 |
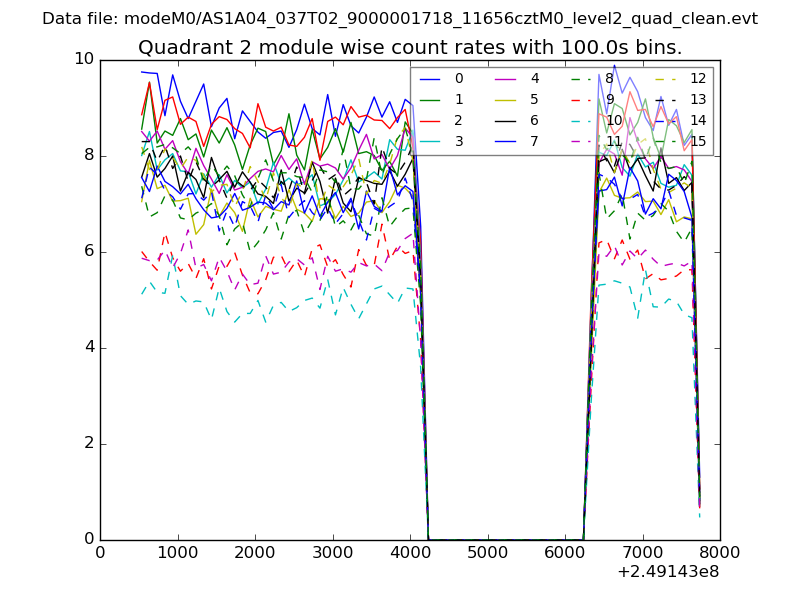
| Module-wise count rates for Quadrant B Data is divided into 100 sec bins |
 |
 |
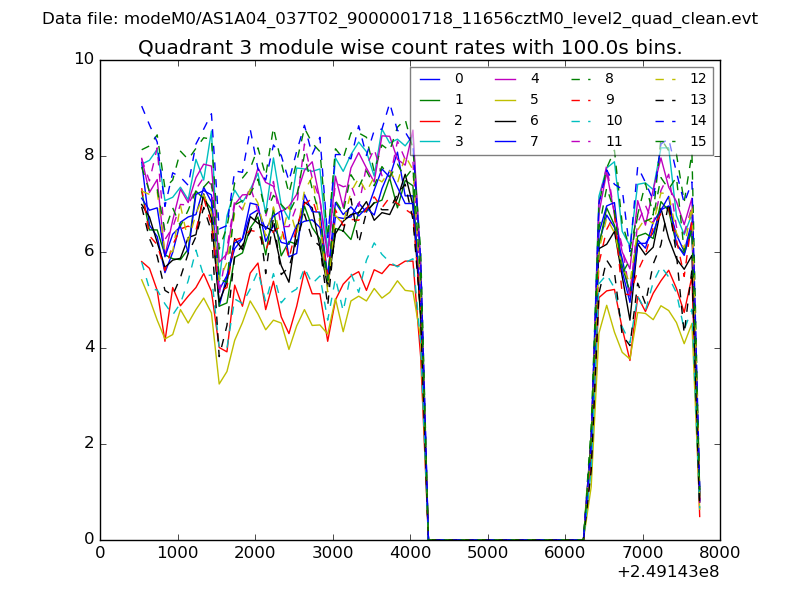
| Module-wise count rates for Quadrant C Data is divided into 100 sec bins |
 |
 |
| Module-wise count rates for Quadrant D Data is divided into 100 sec bins |
 |
 |
| Parameter | Plot |
|---|---|
| CZT HV Monitor | 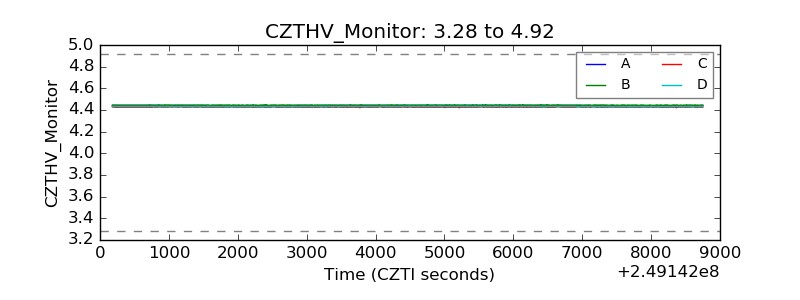 |
| D_VDD | 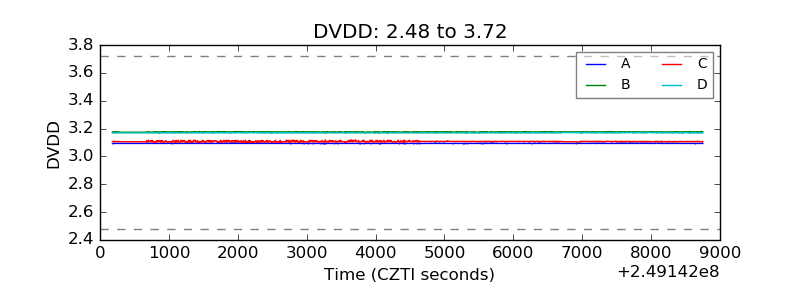 |
| Temperature 1 | 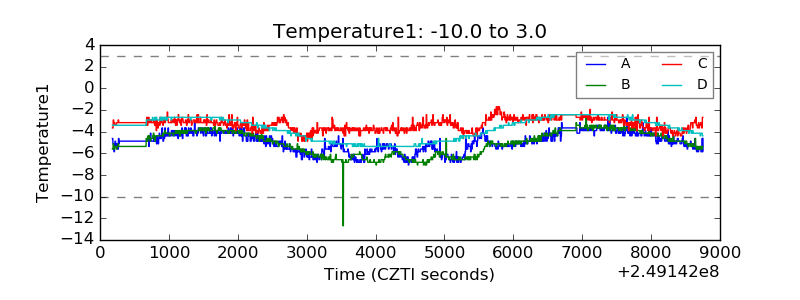 |
| Veto HV Monitor | 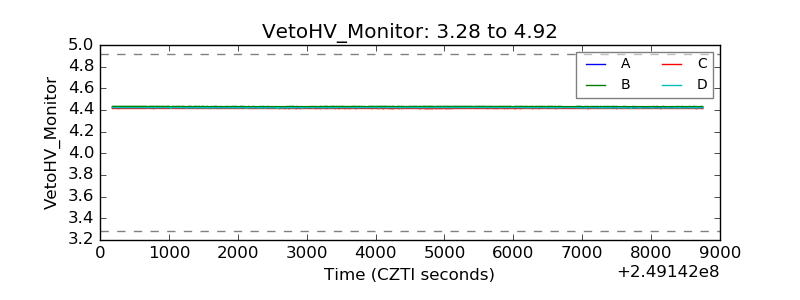 |
| Veto LLD | 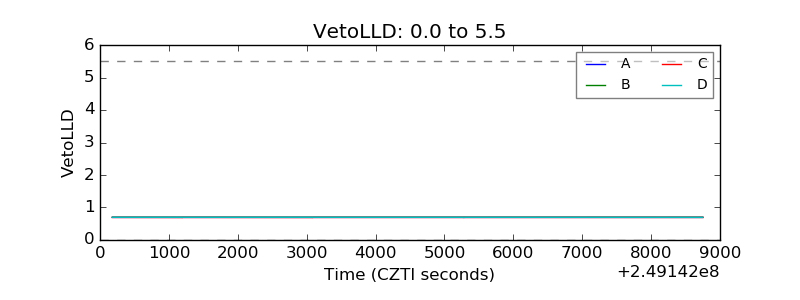 |
| Alpha Counter | 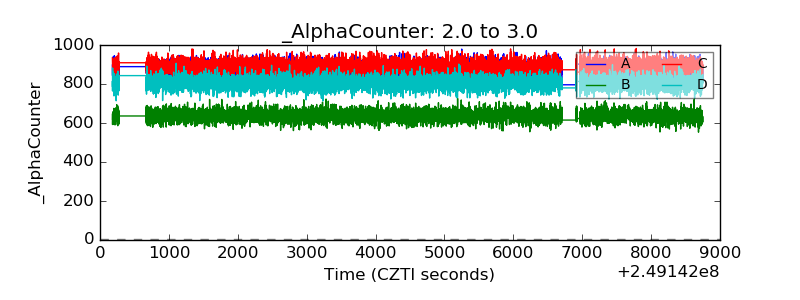 |
| _CPM_Rate | 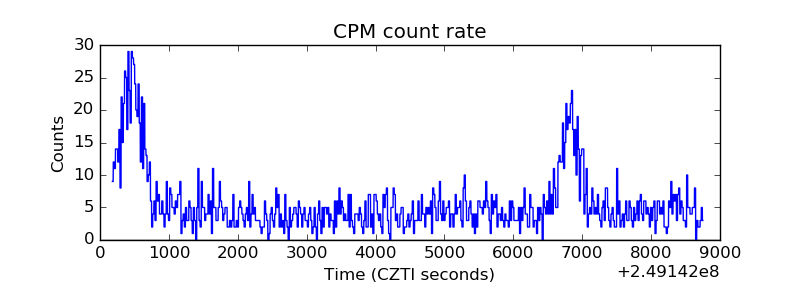 |
| CZT Counter | 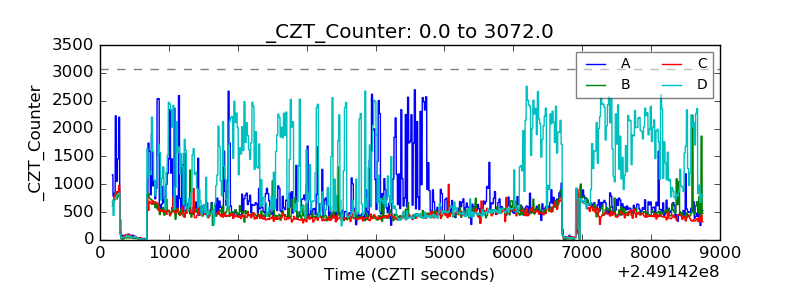 |
| +2.5 Volts monitor |  |
| +5 Volts monitor |  |
| _ROLL_ROT | 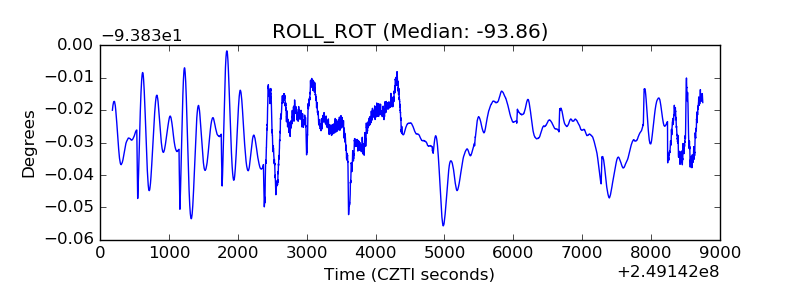 |
| _Roll_DEC |  |
| _Roll_RA | 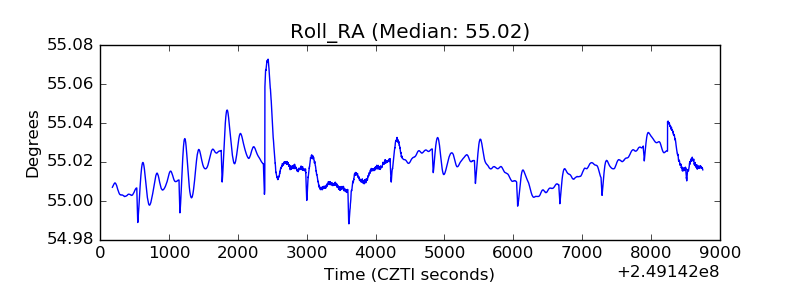 |
| Veto Counter | 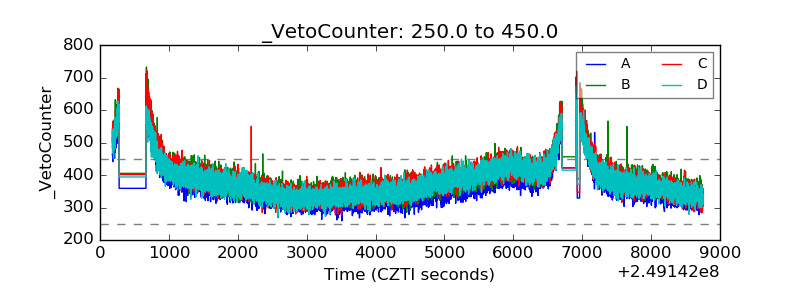 |