| Param | Original file | Final file |
|---|---|---|
| Filename | modeM0/AS1A04_037T02_9000001718_11660cztM0_level2.evt | modeM0/AS1A04_037T02_9000001718_11660cztM0_level2_quad_clean.evt |
| Size (bytes) | 1,451,983,680 | 215,714,880 |
| Size | 1.4 GB | 205.7 MB |
| Events in quadrant A | 12,551,905 | 1,334,606 |
| Events in quadrant B | 8,810,983 | 1,380,557 |
| Events in quadrant C | 7,984,829 | 1,338,138 |
| Events in quadrant D | 13,412,220 | 1,240,057 |
| Mode M0 | |||
|---|---|---|---|
| Quadrant | BADHDUFLAG | Total packets | Discarded packets |
| A | 0 | 49613 | 4 |
| B | 0 | 37997 | 3 |
| C | 0 | 36365 | 3 |
| D | 0 | 52714 | 3 |
| Mode SS | |||
|---|---|---|---|
| Quadrant | BADHDUFLAG | Total packets | Discarded packets |
| A | 0 | 366 | 0 |
| B | 0 | 366 | 0 |
| C | 0 | 366 | 0 |
| D | 0 | 366 | 0 |
| Mode M9 | |||
|---|---|---|---|
| Quadrant | BADHDUFLAG | Total packets | Discarded packets |
| A | 0 | 22 | 0 |
| B | 0 | 22 | 0 |
| C | 0 | 22 | 0 |
| D | 0 | 22 | 0 |
| Quadrant | Total seconds | Saturated seconds | Saturation percentage |
|---|---|---|---|
| A | 17980 | 724 | 4.026696% |
| B | 17980 | 124 | 0.689655% |
| C | 17980 | 31 | 0.172414% |
| D | 17980 | 1554 | 8.642937% |
Noise dominated data is calculated using 1-second bins in cleaned event files. If a bin has >2000 counts, and if more than 50% of those come from <1% of pixels, then it is considered to be noise-dominated and hence unusable.
| Quadrant | # 1 sec bins | Bins with >0 counts | Bins with >2000 counts | High rate bins dominated by noise | Noise dominated (total time) | Noise dominated (detector-on time) | Marked lightcurve |
|---|---|---|---|---|---|---|---|
| A | 20141 | 17983 | 380 | 380 | 1.89% | 2.11% |  |
| B | 20141 | 17984 | 21 | 21 | 0.10% | 0.12% |  |
| C | 20141 | 17984 | 0 | 0 | 0.00% | 0.00% |  |
| D | 20141 | 17984 | 1259 | 1259 | 6.25% | 7.00% |  |
Top three noisy pixels from each quadrant. If the there are fewer than three noisy pixels in the level2.evt file, extra rows are filled as -1
| Pixel properties | Quadrant properties | ||||||
|---|---|---|---|---|---|---|---|
| Quadrant | DetID | PixID | Counts | Sigma | Mean | Median | Sigma |
| A | 8 | 5 | 3017386 | 7178.95 | 2072 | 2030 | 420.0 |
| A | 1 | 162 | 579415 | 1374.64 | 2072 | 2030 | 420.0 |
| A | 1 | 178 | 344184 | 814.6 | 2072 | 2030 | 420.0 |
| B | 4 | 239 | 329465 | 802.36 | 2111 | 2055 | 408.1 |
| B | 15 | 204 | 101627 | 244.01 | 2111 | 2055 | 408.1 |
| B | 0 | 214 | 97820 | 234.68 | 2111 | 2055 | 408.1 |
| C | 13 | 61 | 14884 | 26.93 | 2046 | 2057 | 476.3 |
| C | 12 | 4 | 8383 | 13.28 | 2046 | 2057 | 476.3 |
| C | 8 | 128 | 5700 | 7.65 | 2046 | 2057 | 476.3 |
| D | 13 | 104 | 5200072 | 10923.68 | 1972 | 1918 | 475.9 |
| D | 10 | 199 | 288855 | 602.98 | 1972 | 1918 | 475.9 |
| D | 10 | 157 | 131729 | 272.79 | 1972 | 1918 | 475.9 |
Histogram calculated using DETX and DETY for each event in the final _common_clean file
| Quadrant A |  |
 |
Quadrant B |
|---|---|---|---|
| Quadrant D |  |
 |
Quadrant C |
| Plot type | Count rate plots | Images |
|---|---|---|
| Comparison with Poisson distribution Blue bars denote a histogram of data divided into 1 sec bins. Red curve is a Poisson curve with rate = median count rate of data. |
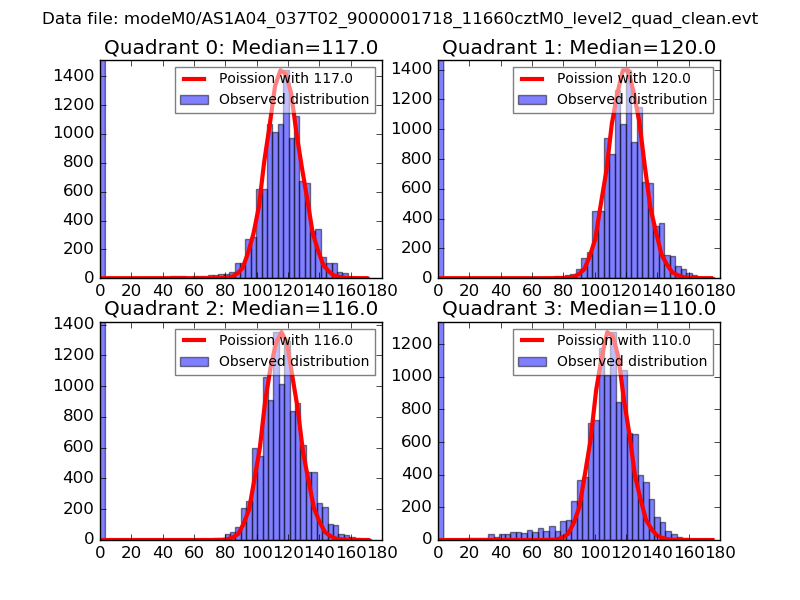 |
 |
| Quadrant-wise count rates Data is divided into 100 sec bins |
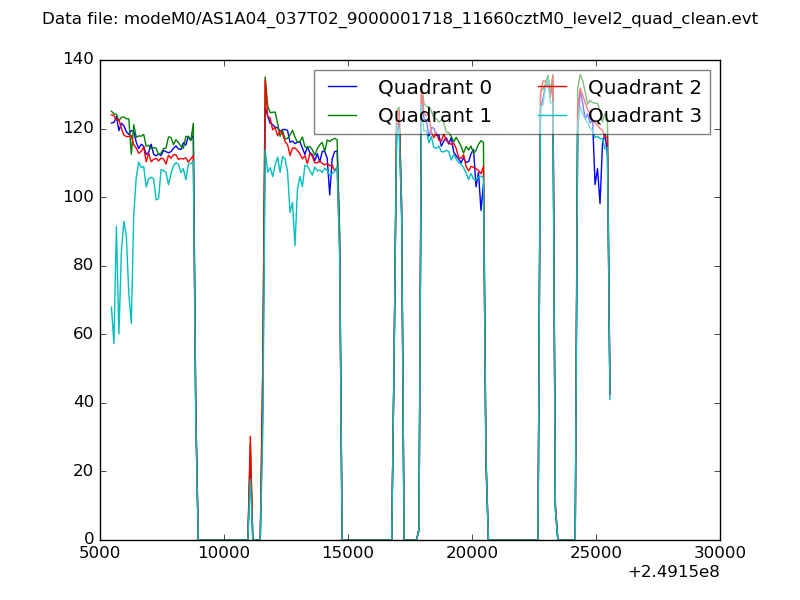 |
|
| Module-wise count rates for Quadrant A Data is divided into 100 sec bins |
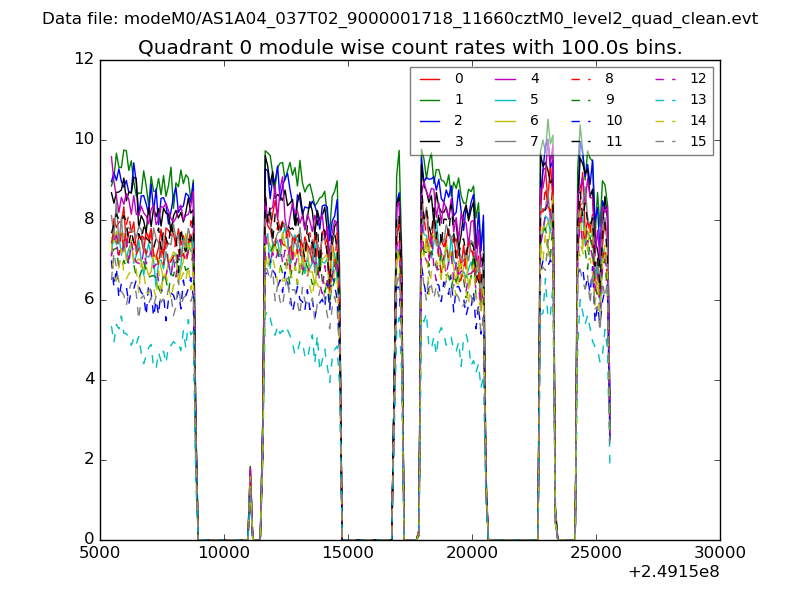 |
 |
| Module-wise count rates for Quadrant B Data is divided into 100 sec bins |
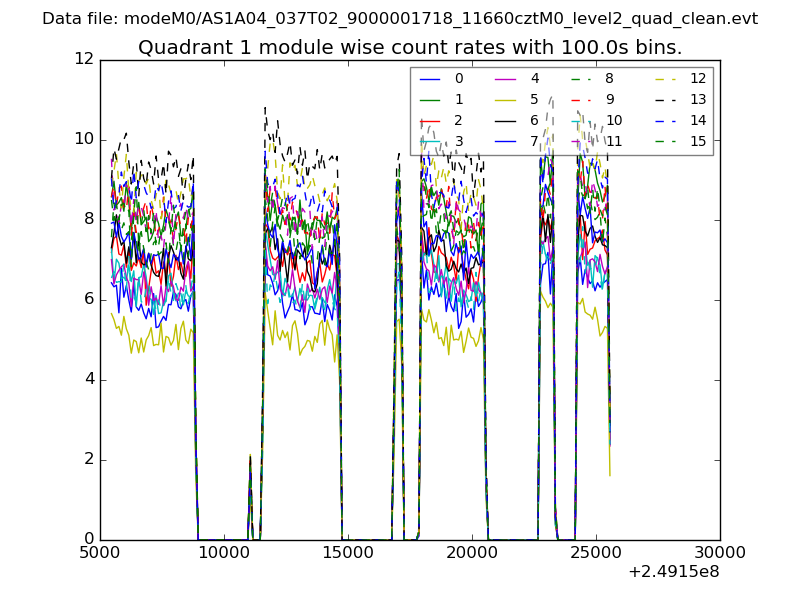 |
 |
| Module-wise count rates for Quadrant C Data is divided into 100 sec bins |
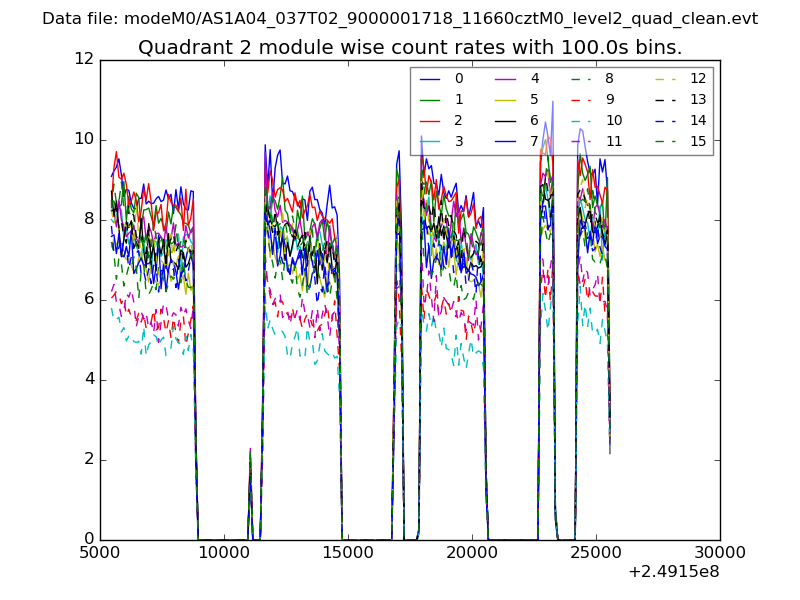 |
 |
| Module-wise count rates for Quadrant D Data is divided into 100 sec bins |
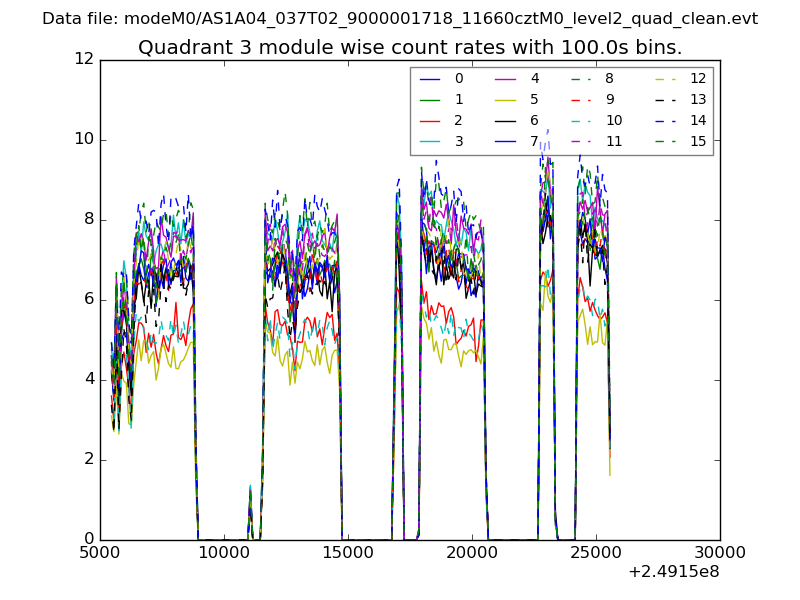 |
 |
| Parameter | Plot |
|---|---|
| CZT HV Monitor | 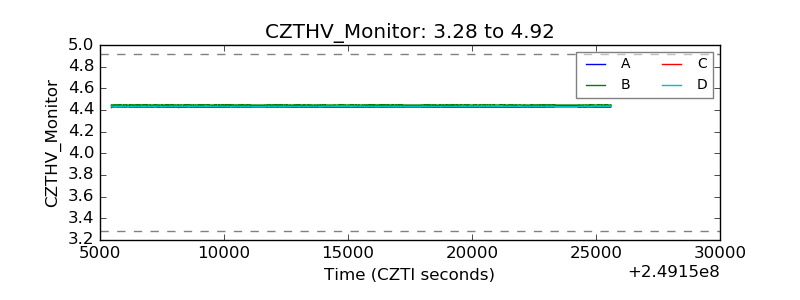 |
| D_VDD |  |
| Temperature 1 |  |
| Veto HV Monitor |  |
| Veto LLD |  |
| Alpha Counter | 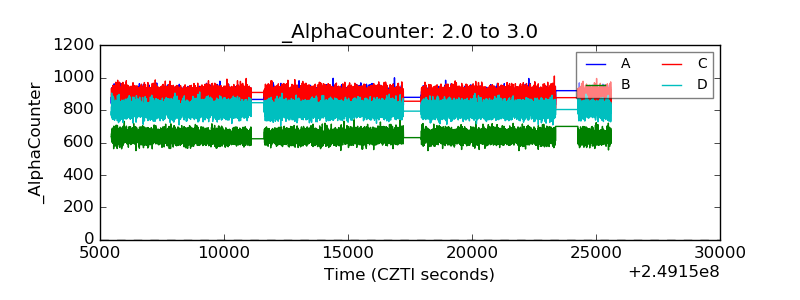 |
| _CPM_Rate | 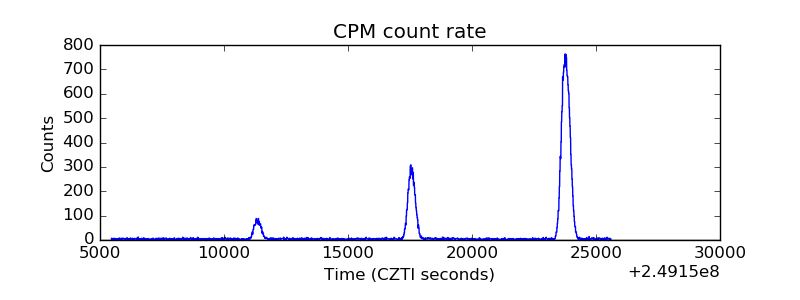 |
| CZT Counter |  |
| +2.5 Volts monitor |  |
| +5 Volts monitor |  |
| _ROLL_ROT | 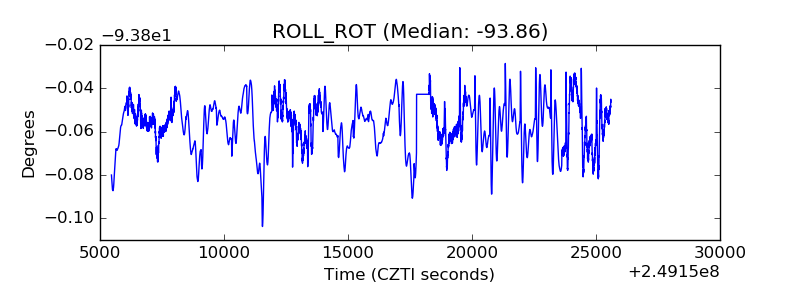 |
| _Roll_DEC | 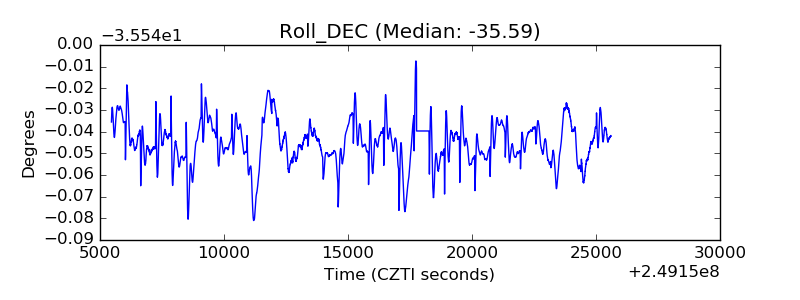 |
| _Roll_RA |  |
| Veto Counter | 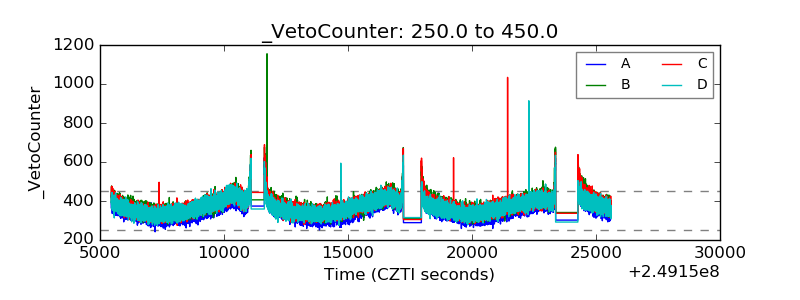 |