| Param | Original file | Final file |
|---|---|---|
| Filename | modeM0/AS1A04_037T02_9000001718_11663cztM0_level2.evt | modeM0/AS1A04_037T02_9000001718_11663cztM0_level2_quad_clean.evt |
| Size (bytes) | 72,849,600 | 18,077,760 |
| Size | 69.5 MB | 17.2 MB |
| Events in quadrant A | 825,742 | 115,490 |
| Events in quadrant B | 460,871 | 124,661 |
| Events in quadrant C | 428,190 | 121,910 |
| Events in quadrant D | 429,056 | 116,677 |
| Mode M0 | |||
|---|---|---|---|
| Quadrant | BADHDUFLAG | Total packets | Discarded packets |
| A | 0 | 3074 | 1 |
| B | 0 | 1864 | 1 |
| C | 0 | 1786 | 1 |
| D | 0 | 1811 | 1 |
| Mode SS | |||
|---|---|---|---|
| Quadrant | BADHDUFLAG | Total packets | Discarded packets |
| A | 0 | 18 | 0 |
| B | 0 | 18 | 0 |
| C | 0 | 18 | 0 |
| D | 0 | 18 | 0 |
| Mode M9 | |||
|---|---|---|---|
| Quadrant | BADHDUFLAG | Total packets | Discarded packets |
| A | 0 | 2 | 0 |
| B | 0 | 2 | 0 |
| C | 0 | 2 | 0 |
| D | 0 | 3 | 0 |
| Quadrant | Total seconds | Saturated seconds | Saturation percentage |
|---|---|---|---|
| A | 869 | 63 | 7.249712% |
| B | 869 | 3 | 0.345224% |
| C | 869 | 2 | 0.230150% |
| D | 869 | 2 | 0.230150% |
Noise dominated data is calculated using 1-second bins in cleaned event files. If a bin has >2000 counts, and if more than 50% of those come from <1% of pixels, then it is considered to be noise-dominated and hence unusable.
| Quadrant | # 1 sec bins | Bins with >0 counts | Bins with >2000 counts | High rate bins dominated by noise | Noise dominated (total time) | Noise dominated (detector-on time) | Marked lightcurve |
|---|---|---|---|---|---|---|---|
| A | 870 | 870 | 46 | 46 | 5.29% | 5.29% | 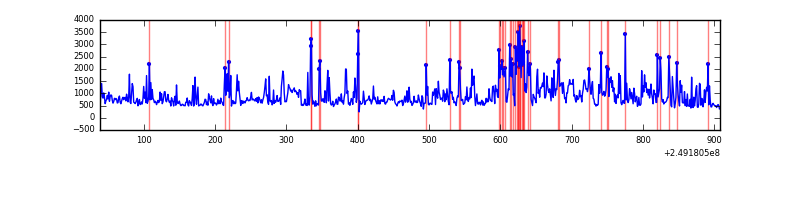 |
| B | 870 | 870 | 0 | 0 | 0.00% | 0.00% | 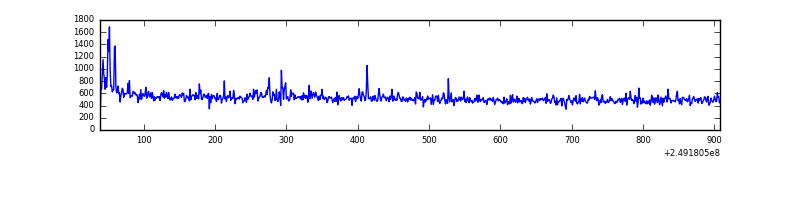 |
| C | 870 | 870 | 0 | 0 | 0.00% | 0.00% | 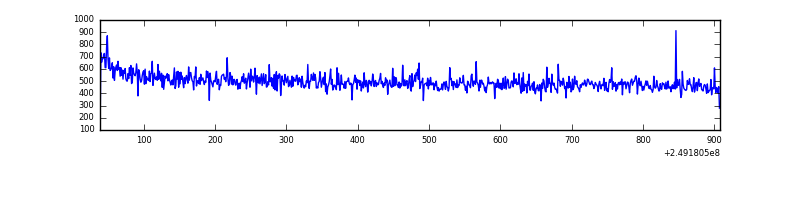 |
| D | 870 | 870 | 1 | 1 | 0.11% | 0.11% | 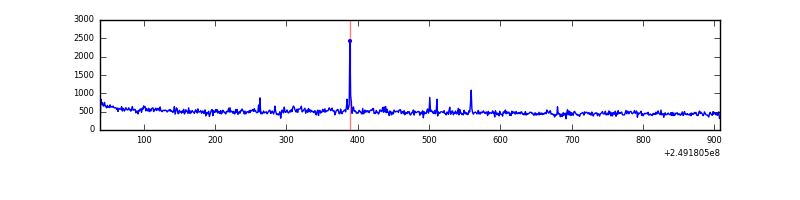 |
Top three noisy pixels from each quadrant. If the there are fewer than three noisy pixels in the level2.evt file, extra rows are filled as -1
| Pixel properties | Quadrant properties | ||||||
|---|---|---|---|---|---|---|---|
| Quadrant | DetID | PixID | Counts | Sigma | Mean | Median | Sigma |
| A | 8 | 5 | 367895 | 15420.57 | 107 | 105 | 23.9 |
| A | 1 | 162 | 16928 | 705.35 | 107 | 105 | 23.9 |
| A | 1 | 178 | 9646 | 400.03 | 107 | 105 | 23.9 |
| B | 0 | 244 | 6571 | 271.87 | 112 | 110 | 23.8 |
| B | 0 | 214 | 6425 | 265.72 | 112 | 110 | 23.8 |
| B | 4 | 239 | 4436 | 182.03 | 112 | 110 | 23.8 |
| C | 13 | 61 | 828 | 26.48 | 109 | 109 | 27.2 |
| C | 12 | 4 | 510 | 14.77 | 109 | 109 | 27.2 |
| C | 14 | 67 | 312 | 7.48 | 109 | 109 | 27.2 |
| D | 8 | 195 | 11128 | 410.75 | 106 | 103 | 26.8 |
| D | 13 | 104 | 7945 | 292.16 | 106 | 103 | 26.8 |
| D | 10 | 157 | 4110 | 149.29 | 106 | 103 | 26.8 |
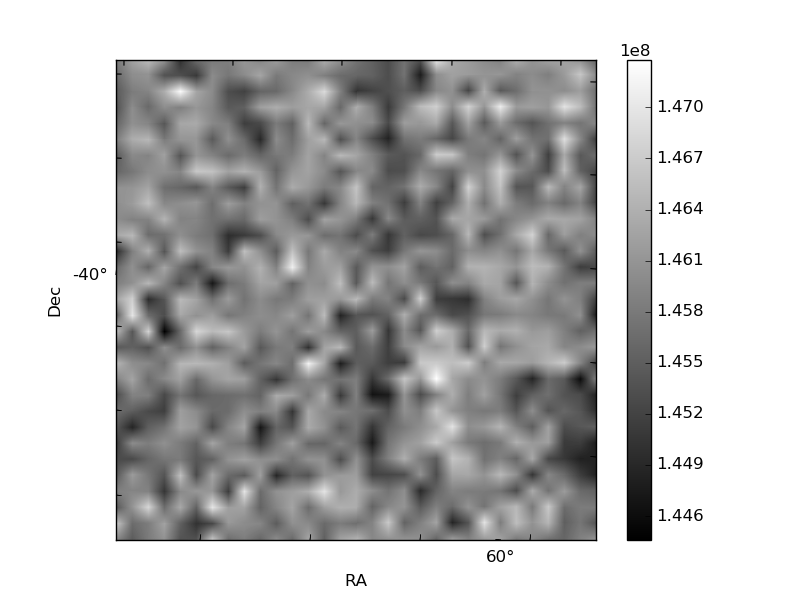
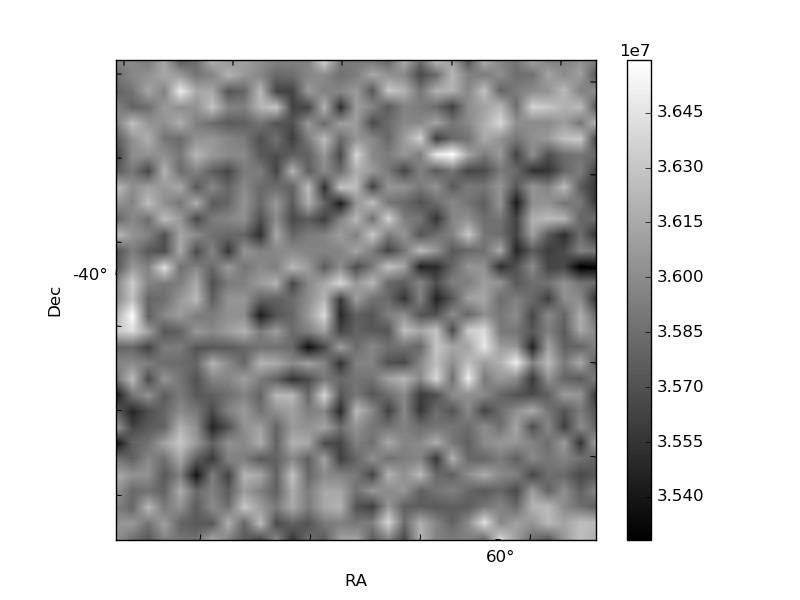
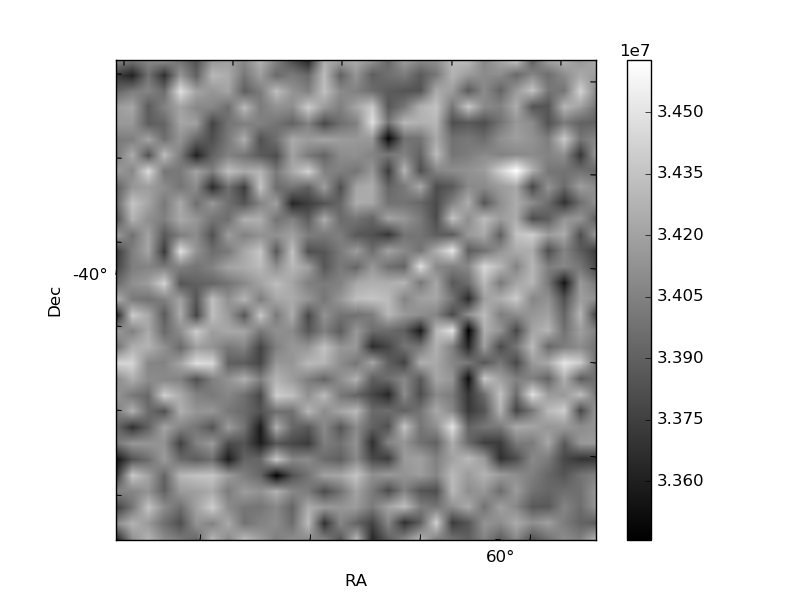
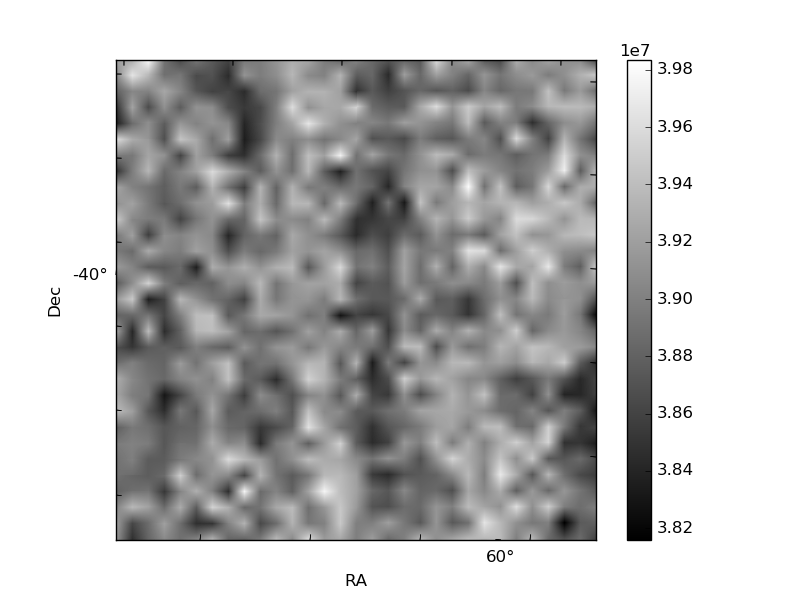
Histogram calculated using DETX and DETY for each event in the final _common_clean file
| Quadrant A | 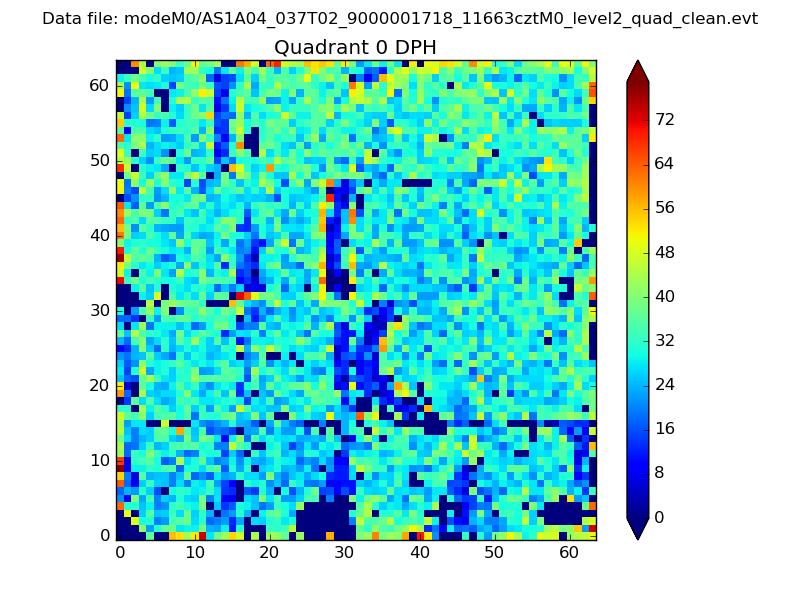 |
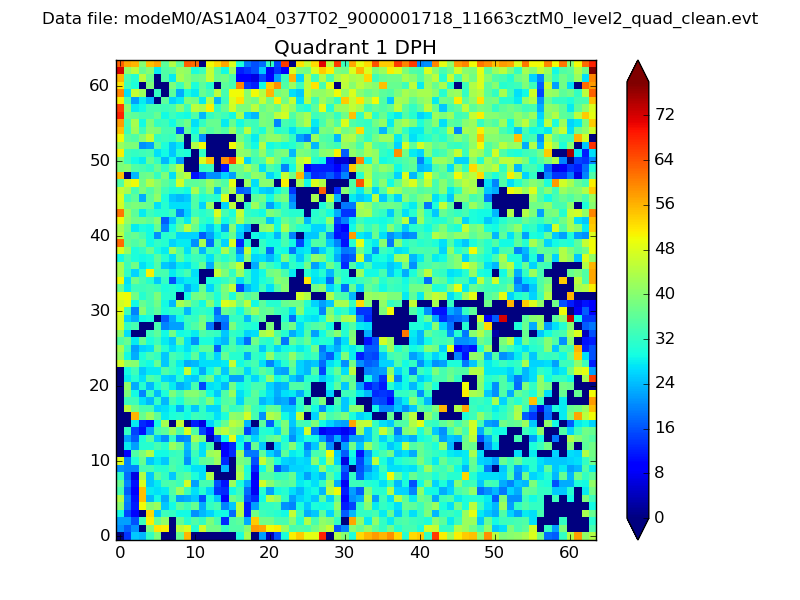 |
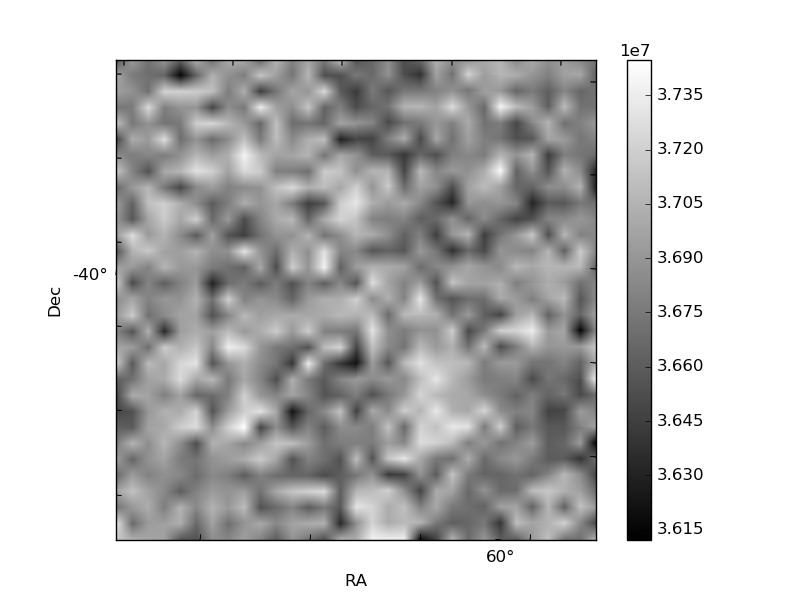
Quadrant B |
|---|---|---|---|
| Quadrant D | 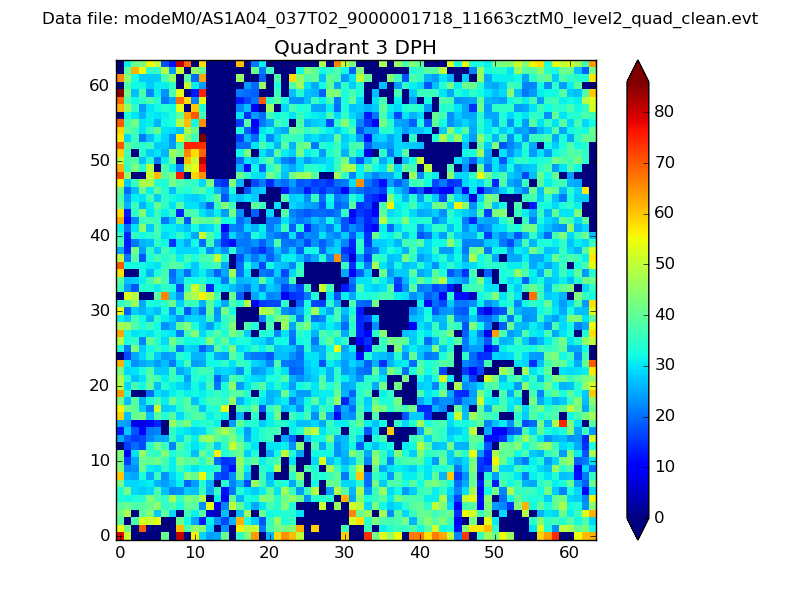 |
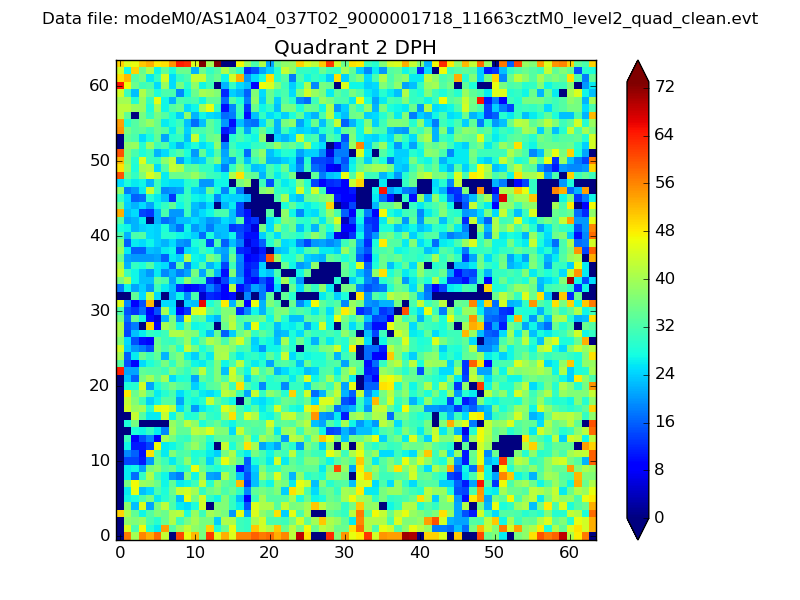 |
Quadrant C |
| Plot type | Count rate plots | Images |
|---|---|---|
| Comparison with Poisson distribution Blue bars denote a histogram of data divided into 1 sec bins. Red curve is a Poisson curve with rate = median count rate of data. |
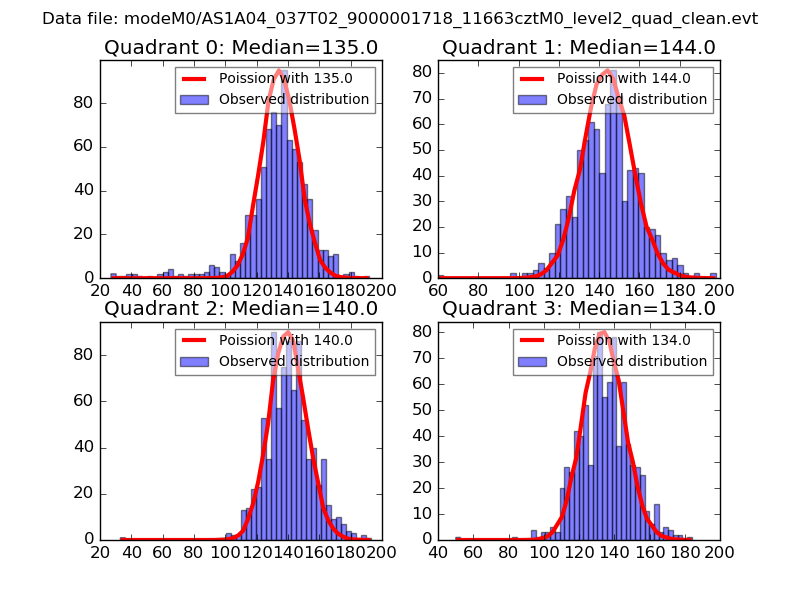 |
 |
| Quadrant-wise count rates Data is divided into 100 sec bins |
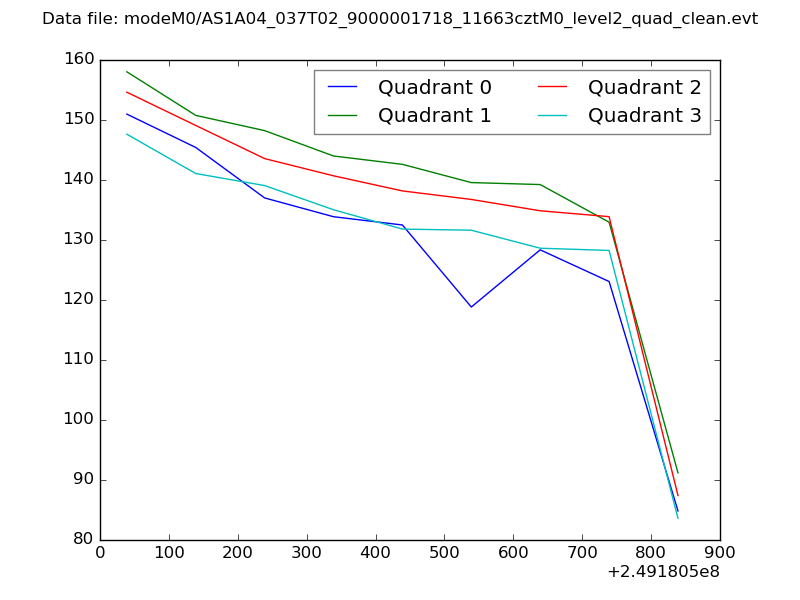 |
|
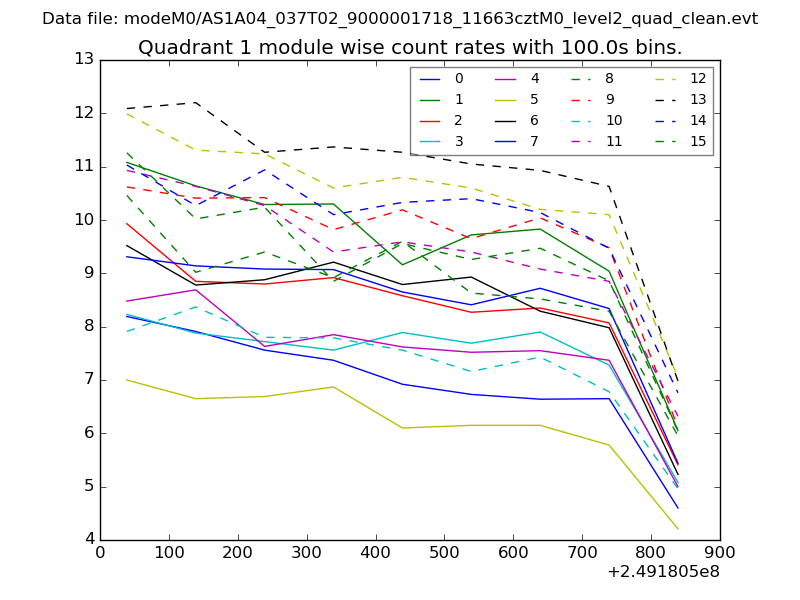
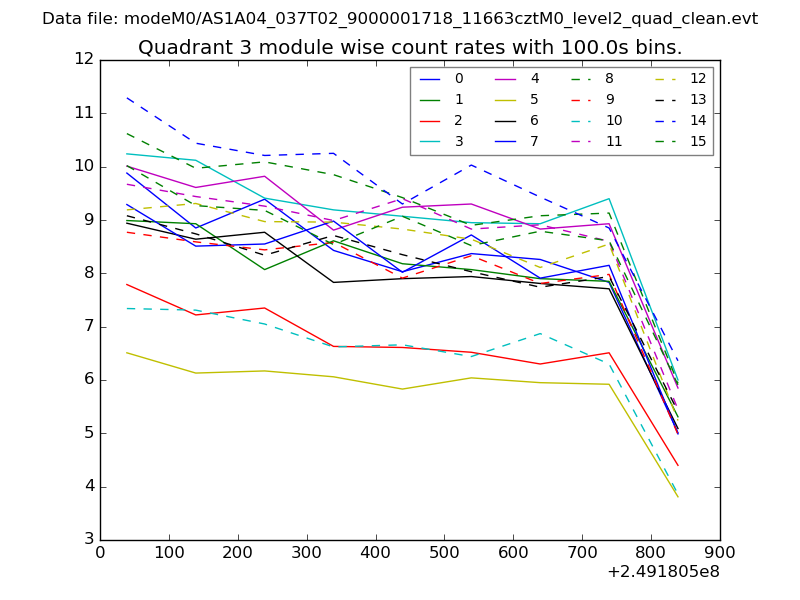
| Module-wise count rates for Quadrant A Data is divided into 100 sec bins |
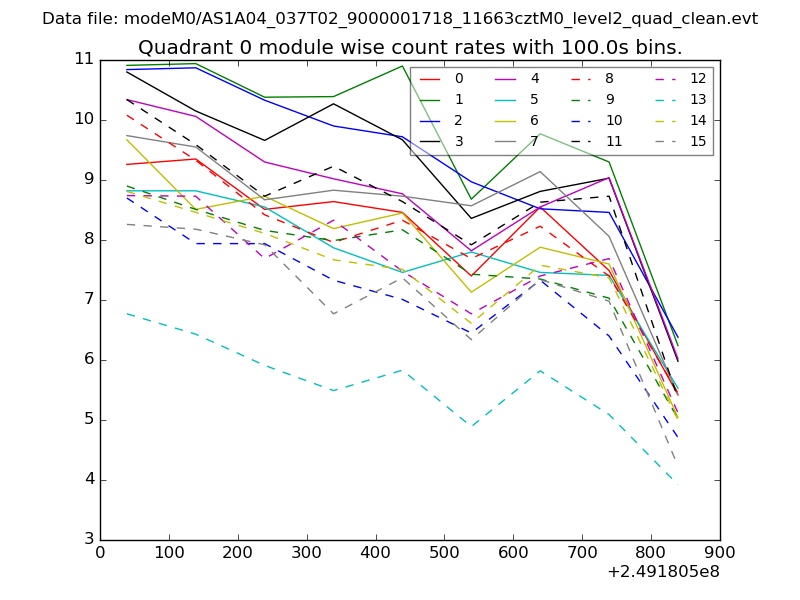 |
 |
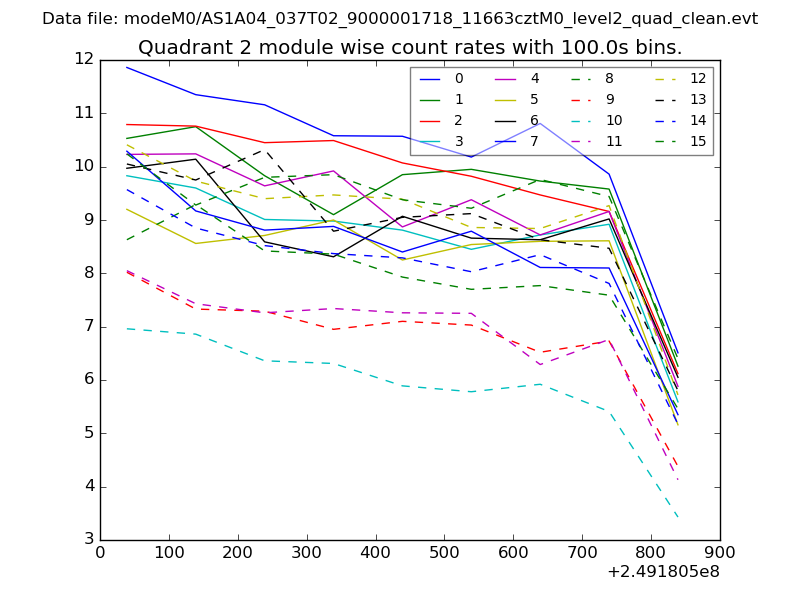
| Module-wise count rates for Quadrant B Data is divided into 100 sec bins |
 |
 |
| Module-wise count rates for Quadrant C Data is divided into 100 sec bins |
 |
 |
| Module-wise count rates for Quadrant D Data is divided into 100 sec bins |
 |
 |
| Parameter | Plot |
|---|---|
| CZT HV Monitor | 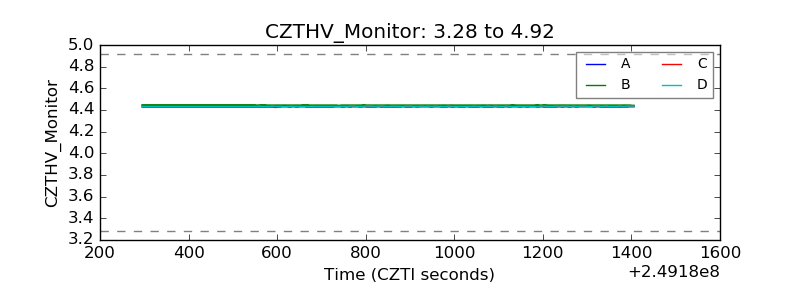 |
| D_VDD | 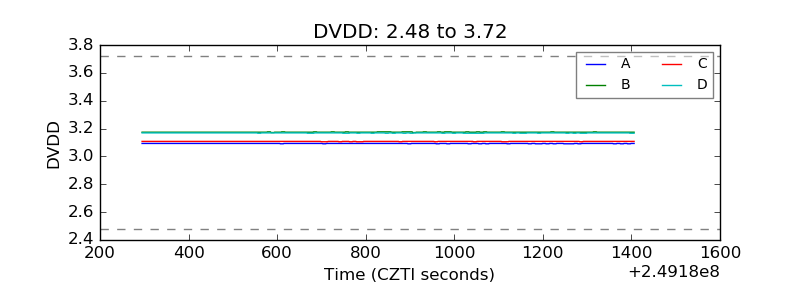 |
| Temperature 1 | 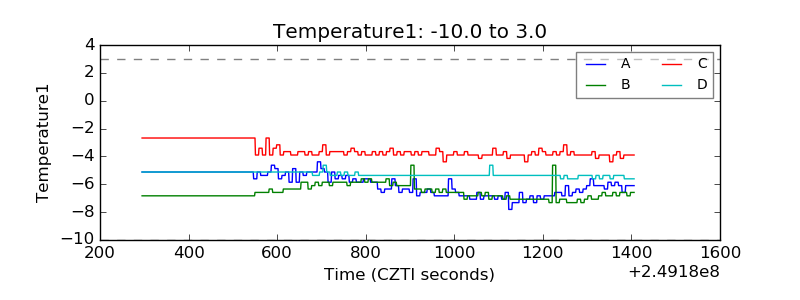 |
| Veto HV Monitor | 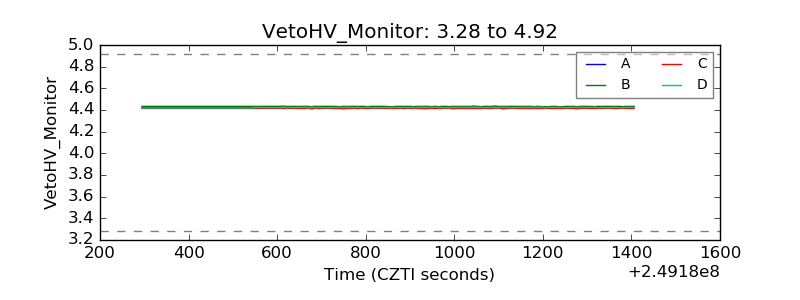 |
| Veto LLD | 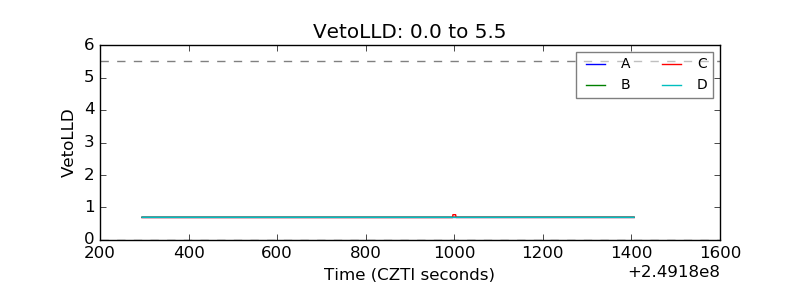 |
| Alpha Counter | 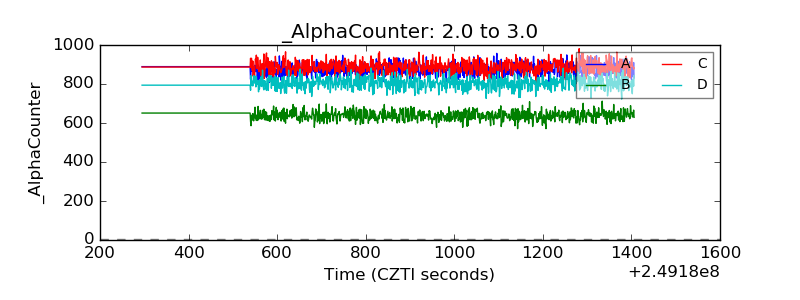 |
| _CPM_Rate | 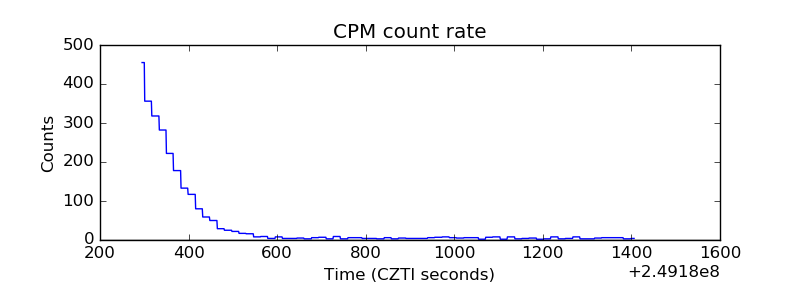 |
| CZT Counter | 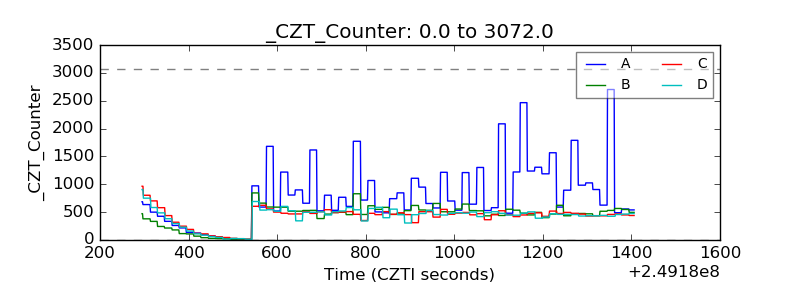 |
| +2.5 Volts monitor |  |
| +5 Volts monitor | 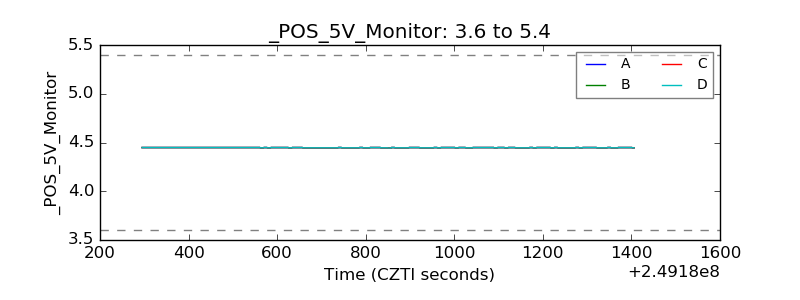 |
| _ROLL_ROT | 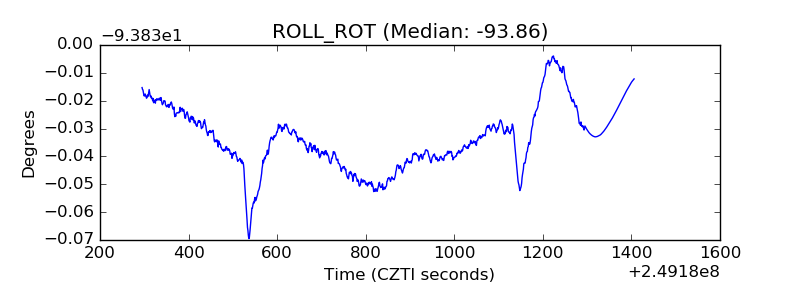 |
| _Roll_DEC | 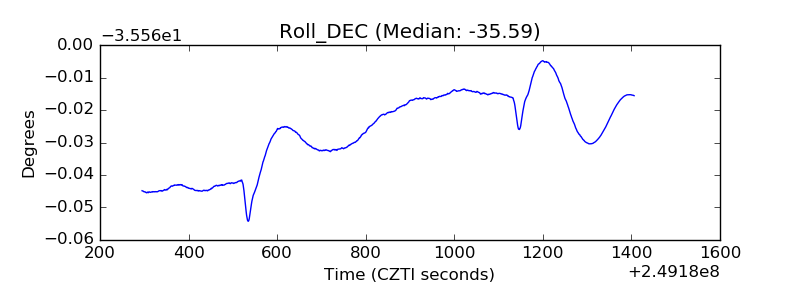 |
| _Roll_RA | 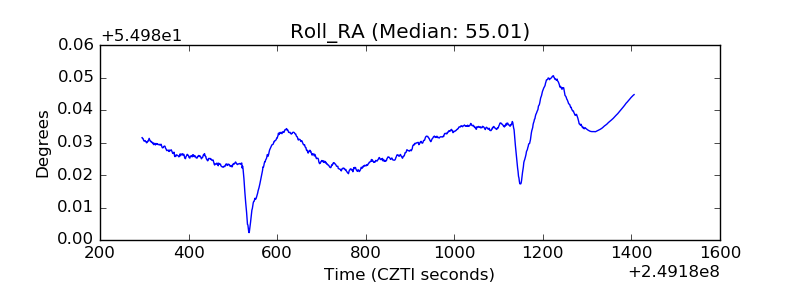 |
| Veto Counter | 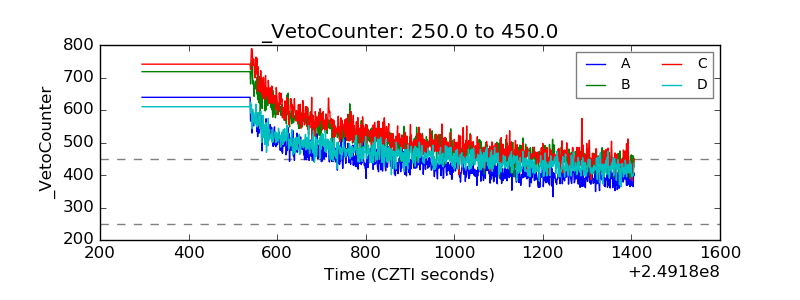 |