| Param | Original file | Final file |
|---|---|---|
| Filename | modeM0/AS1A04_037T03_9000001722cztM0_level2.fits | modeM0/AS1A04_037T03_9000001722cztM0_level2_quad_clean.evt |
| Size (bytes) | 515,136,960 | 450,754,560 |
| Size | 491.3 MB | 429.9 MB |
| Events in quadrant A | 3,039,018 | 2,540,577 |
| Events in quadrant B | 2,994,942 | 2,613,534 |
| Events in quadrant C | 3,194,212 | 2,537,588 |
| Events in quadrant D | 2,713,022 | 2,301,964 |
| Mode M0 | |||
|---|---|---|---|
| Quadrant | BADHDUFLAG | Total packets | Discarded packets |
| A | 0 | 155297 | 0 |
| B | 0 | 136206 | 0 |
| C | 0 | 109807 | 0 |
| D | 0 | 134825 | 0 |
| Mode SS | |||
|---|---|---|---|
| Quadrant | BADHDUFLAG | Total packets | Discarded packets |
| A | 0 | 1086 | 0 |
| B | 0 | 1086 | 0 |
| C | 0 | 1086 | 0 |
| D | 0 | 1086 | 0 |
| Mode M9 | |||
|---|---|---|---|
| Quadrant | BADHDUFLAG | Total packets | Discarded packets |
| A | 0 | 99 | 0 |
| B | 0 | 99 | 0 |
| C | 0 | 99 | 0 |
| D | 0 | 99 | 0 |
| Quadrant | Total seconds | Saturated seconds | Saturation percentage |
|---|---|---|---|
| A | 53294 | 3859 | 7.240965% |
| B | 53294 | 3488 | 6.544827% |
| C | 53294 | 558 | 1.047022% |
| D | 53294 | 1568 | 2.942170% |
Noise dominated data is calculated using 1-second bins in cleaned event files. If a bin has >2000 counts, and if more than 50% of those come from <1% of pixels, then it is considered to be noise-dominated and hence unusable.
| Quadrant | # 1 sec bins | Bins with >0 counts | Bins with >2000 counts | High rate bins dominated by noise | Noise dominated (total time) | Noise dominated (detector-on time) | Marked lightcurve |
|---|---|---|---|---|---|---|---|
| A | 63169 | 53279 | 0 | 0 | 0.00% | 0.00% |  |
| B | 63169 | 53118 | 0 | 0 | 0.00% | 0.00% | 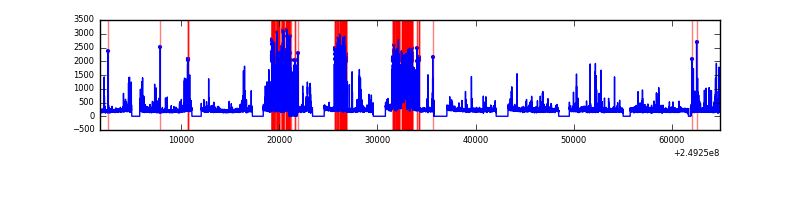 |
| C | 63169 | 53294 | 0 | 0 | 0.00% | 0.00% | 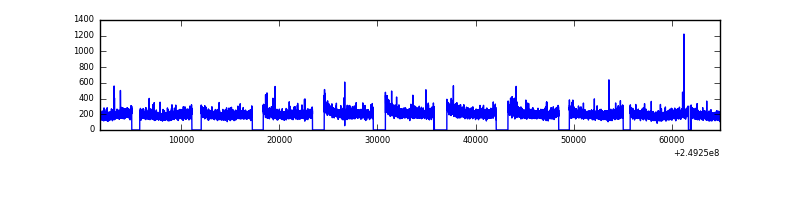 |
| D | 63169 | 53275 | 0 | 0 | 0.00% | 0.00% | 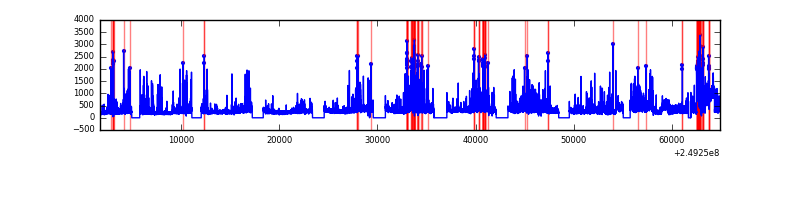 |
Top three noisy pixels from each quadrant. If the there are fewer than three noisy pixels in the level2.evt file, extra rows are filled as -1
| Pixel properties | Quadrant properties | ||||||
|---|---|---|---|---|---|---|---|
| Quadrant | DetID | PixID | Counts | Sigma | Mean | Median | Sigma |
| A | 0 | 29 | 2957 | 11.1 | 792 | 740 | 199.7 |
| A | 7 | 110 | 2426 | 8.44 | 792 | 740 | 199.7 |
| A | 0 | 30 | 2248 | 7.55 | 792 | 740 | 199.7 |
| B | 2 | 9 | 2521 | 11.21 | 789 | 752 | 157.7 |
| B | 3 | 17 | 2046 | 8.2 | 789 | 752 | 157.7 |
| B | 14 | 254 | 1921 | 7.41 | 789 | 752 | 157.7 |
| C | 1 | 81 | 2316 | 6.97 | 842 | 783 | 220.0 |
| C | 1 | 80 | 2309 | 6.93 | 842 | 783 | 220.0 |
| C | 2 | 191 | 2226 | 6.56 | 842 | 783 | 220.0 |
| D | 6 | 231 | 2001 | 6.27 | 775 | 706 | 206.5 |
| D | 7 | 3 | 1890 | 5.73 | 775 | 706 | 206.5 |
| D | 3 | 14 | 1881 | 5.69 | 775 | 706 | 206.5 |
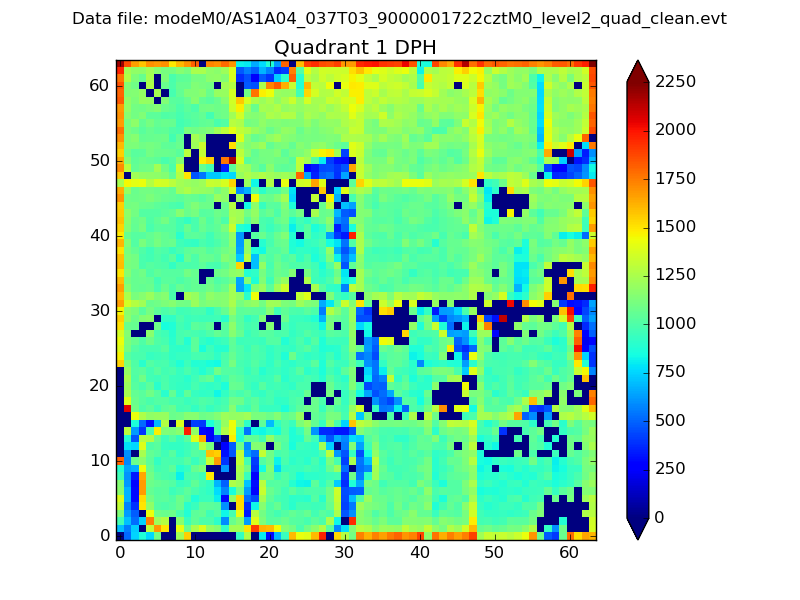
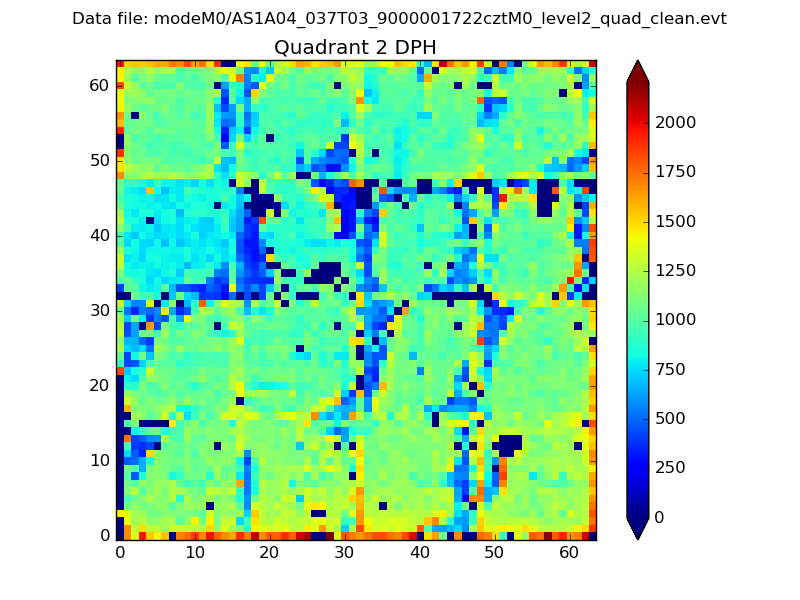
Histogram calculated using DETX and DETY for each event in the final _common_clean file
| Quadrant A | 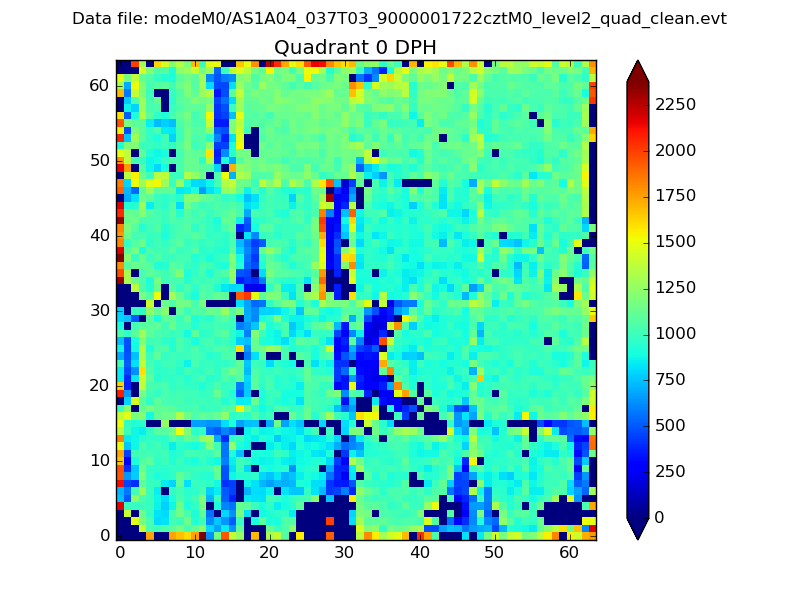 |
 |
Quadrant B |
|---|---|---|---|
| Quadrant D | 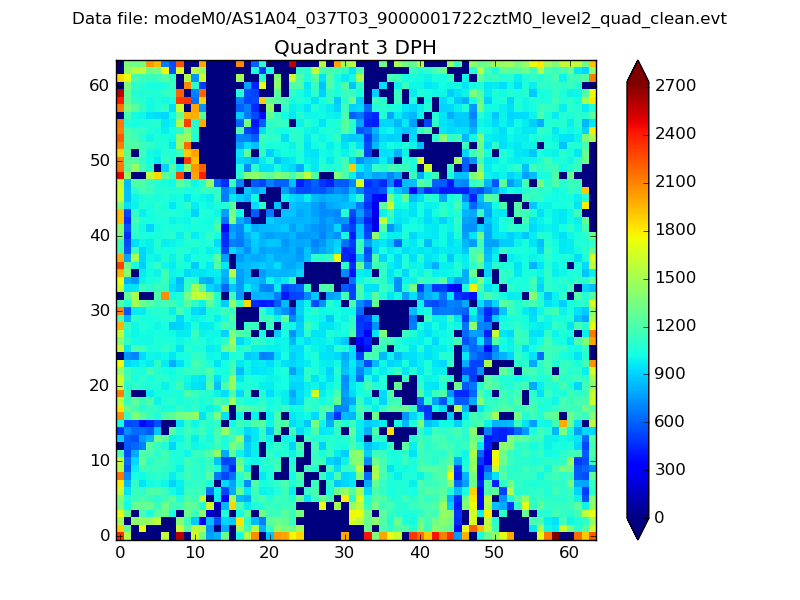 |
 |
Quadrant C |
| Plot type | Count rate plots | Images |
|---|---|---|
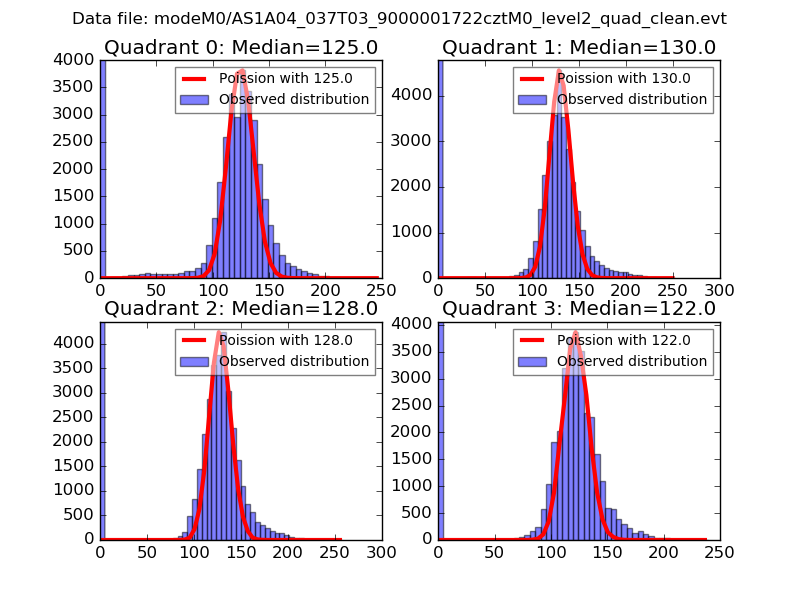
| Comparison with Poisson distribution Blue bars denote a histogram of data divided into 1 sec bins. Red curve is a Poisson curve with rate = median count rate of data. |
 |
 |
| Quadrant-wise count rates Data is divided into 100 sec bins |
 |
|
| Module-wise count rates for Quadrant A Data is divided into 100 sec bins |
 |
 |
| Module-wise count rates for Quadrant B Data is divided into 100 sec bins |
 |
 |
| Module-wise count rates for Quadrant C Data is divided into 100 sec bins |
 |
 |
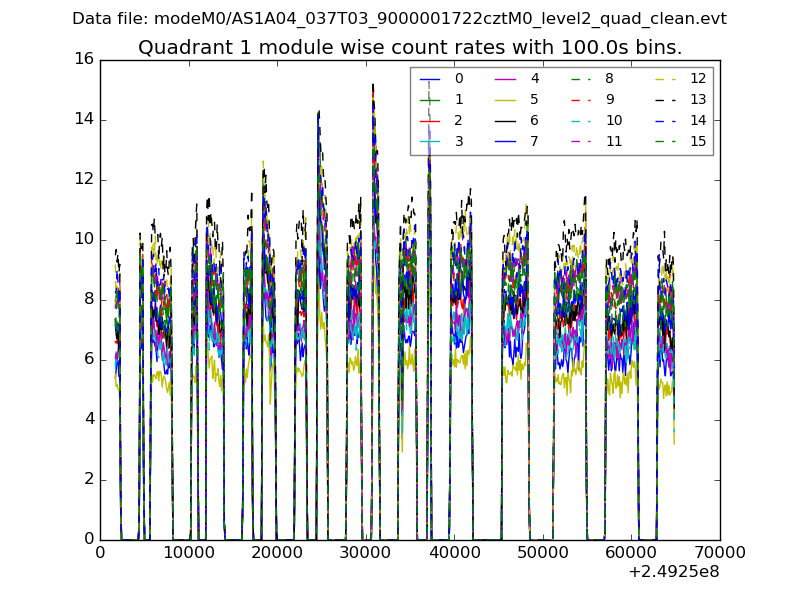
| Module-wise count rates for Quadrant D Data is divided into 100 sec bins |
 |
 |
| Parameter | Plot |
|---|---|
| CZT HV Monitor |  |
| D_VDD | 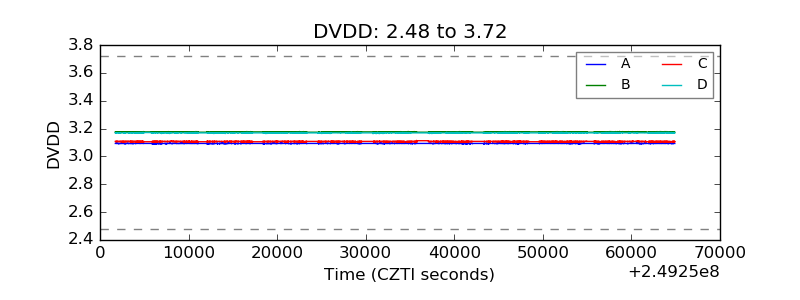 |
| Temperature 1 |  |
| Veto HV Monitor | 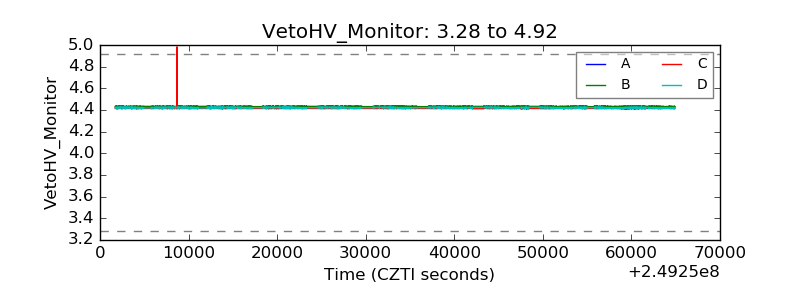 |
| Veto LLD |  |
| Alpha Counter | 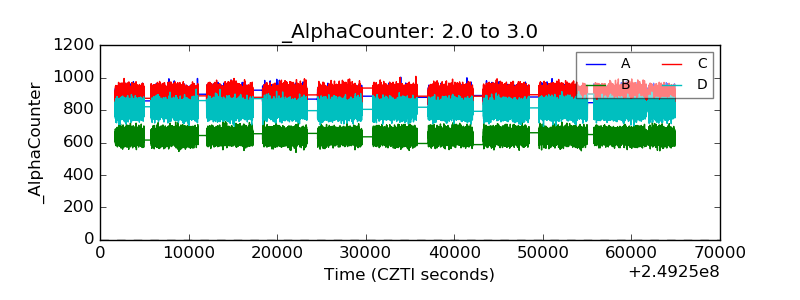 |
| _CPM_Rate | 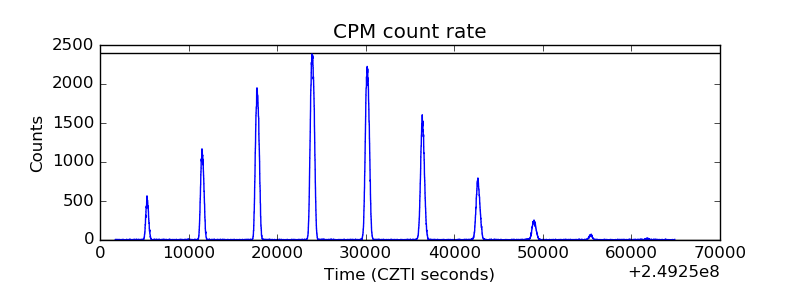 |
| CZT Counter |  |
| +2.5 Volts monitor |  |
| +5 Volts monitor |  |
| _ROLL_ROT |  |
| _Roll_DEC |  |
| _Roll_RA |  |
| Veto Counter | 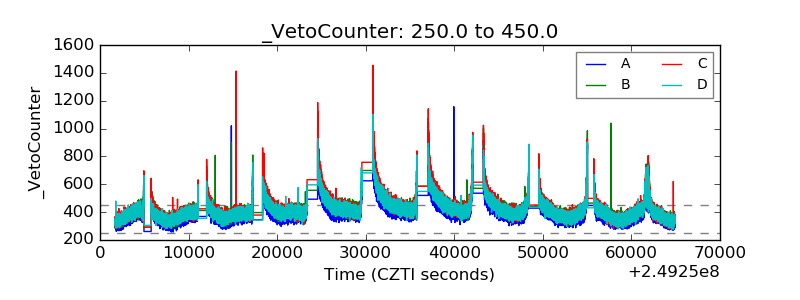 |