| Param | Original file | Final file |
|---|---|---|
| Filename | modeM0/AS1A04_037T03_9000001722_11675cztM0_level2.evt | modeM0/AS1A04_037T03_9000001722_11675cztM0_level2_quad_clean.evt |
| Size (bytes) | 723,064,320 | 112,357,440 |
| Size | 689.6 MB | 107.2 MB |
| Events in quadrant A | 6,279,170 | 681,760 |
| Events in quadrant B | 5,032,905 | 698,336 |
| Events in quadrant C | 4,487,053 | 683,211 |
| Events in quadrant D | 5,427,654 | 652,226 |
| Mode M0 | |||
|---|---|---|---|
| Quadrant | BADHDUFLAG | Total packets | Discarded packets |
| A | 0 | 25348 | 3 |
| B | 0 | 21394 | 2 |
| C | 0 | 20041 | 2 |
| D | 0 | 22885 | 2 |
| Mode SS | |||
|---|---|---|---|
| Quadrant | BADHDUFLAG | Total packets | Discarded packets |
| A | 0 | 202 | 0 |
| B | 0 | 202 | 0 |
| C | 0 | 202 | 0 |
| D | 0 | 202 | 0 |
| Mode M9 | |||
|---|---|---|---|
| Quadrant | BADHDUFLAG | Total packets | Discarded packets |
| A | 0 | 18 | 0 |
| B | 0 | 18 | 0 |
| C | 0 | 18 | 0 |
| D | 0 | 18 | 0 |
| Quadrant | Total seconds | Saturated seconds | Saturation percentage |
|---|---|---|---|
| A | 9915 | 201 | 2.027231% |
| B | 9915 | 90 | 0.907716% |
| C | 9915 | 11 | 0.110943% |
| D | 9915 | 151 | 1.522945% |
Noise dominated data is calculated using 1-second bins in cleaned event files. If a bin has >2000 counts, and if more than 50% of those come from <1% of pixels, then it is considered to be noise-dominated and hence unusable.
| Quadrant | # 1 sec bins | Bins with >0 counts | Bins with >2000 counts | High rate bins dominated by noise | Noise dominated (total time) | Noise dominated (detector-on time) | Marked lightcurve |
|---|---|---|---|---|---|---|---|
| A | 11696 | 9918 | 70 | 70 | 0.60% | 0.71% | 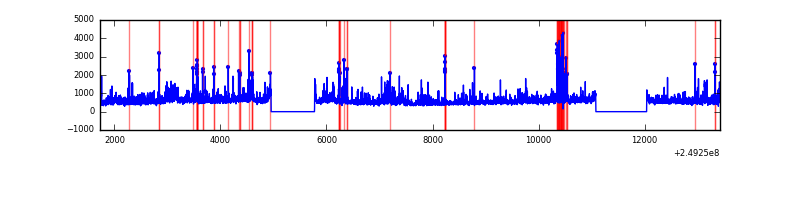 |
| B | 11696 | 9918 | 23 | 23 | 0.20% | 0.23% | 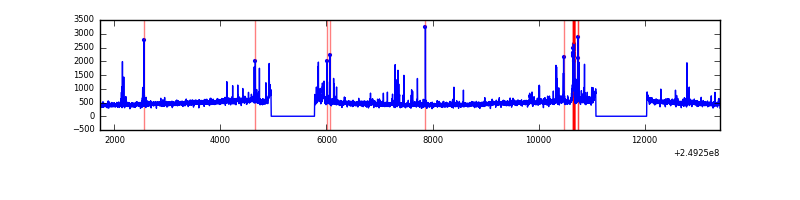 |
| C | 11696 | 9918 | 0 | 0 | 0.00% | 0.00% | 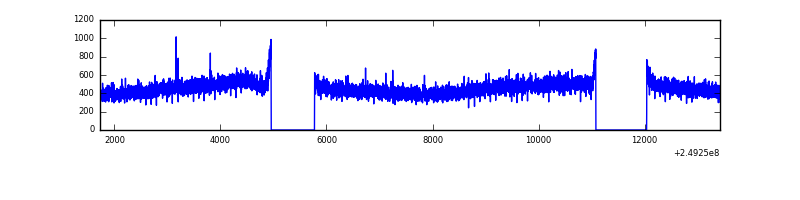 |
| D | 11696 | 9918 | 95 | 95 | 0.81% | 0.96% | 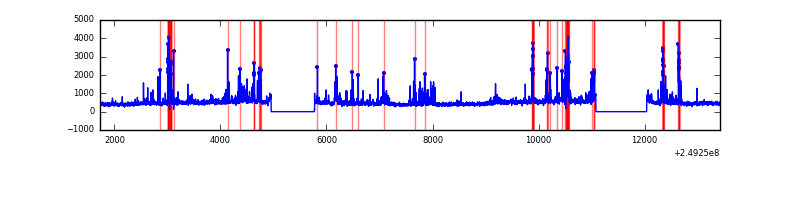 |
Top three noisy pixels from each quadrant. If the there are fewer than three noisy pixels in the level2.evt file, extra rows are filled as -1
| Pixel properties | Quadrant properties | ||||||
|---|---|---|---|---|---|---|---|
| Quadrant | DetID | PixID | Counts | Sigma | Mean | Median | Sigma |
| A | 8 | 5 | 834972 | 3511.65 | 1167 | 1143 | 237.4 |
| A | 1 | 162 | 299214 | 1255.32 | 1167 | 1143 | 237.4 |
| A | 1 | 178 | 171303 | 716.63 | 1167 | 1143 | 237.4 |
| B | 4 | 239 | 187430 | 825.99 | 1179 | 1151 | 225.5 |
| B | 15 | 204 | 81732 | 357.31 | 1179 | 1151 | 225.5 |
| B | 3 | 64 | 76966 | 336.17 | 1179 | 1151 | 225.5 |
| C | 13 | 61 | 8399 | 27.04 | 1151 | 1158 | 267.8 |
| C | 3 | 202 | 2813 | 6.18 | 1151 | 1158 | 267.8 |
| C | -1 | -1 | -1 | -1.0 | 1151 | 1158 | 267.8 |
| D | 1 | 52 | 428410 | 1571.88 | 1133 | 1101 | 271.8 |
| D | 13 | 104 | 365686 | 1341.15 | 1133 | 1101 | 271.8 |
| D | 8 | 195 | 219539 | 803.54 | 1133 | 1101 | 271.8 |
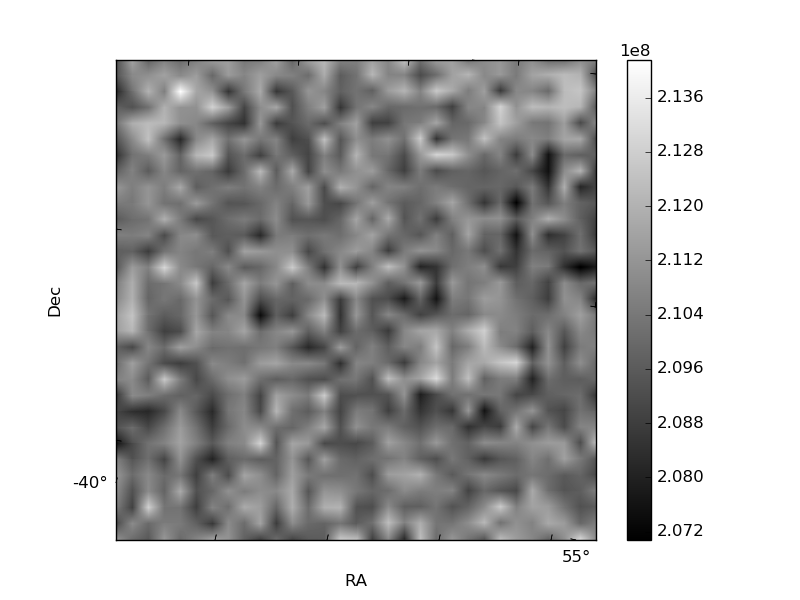
Histogram calculated using DETX and DETY for each event in the final _common_clean file
| Quadrant A |  |
 |
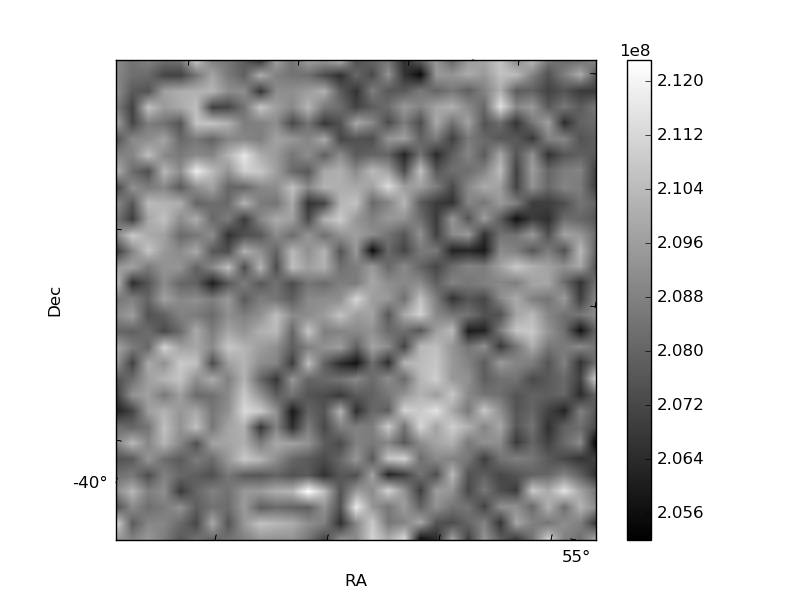
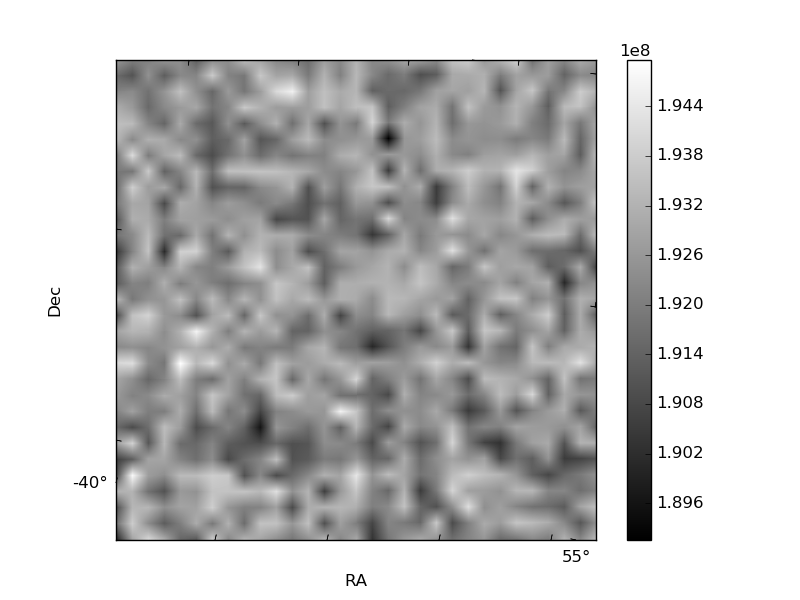
Quadrant B |
|---|---|---|---|
| Quadrant D |  |
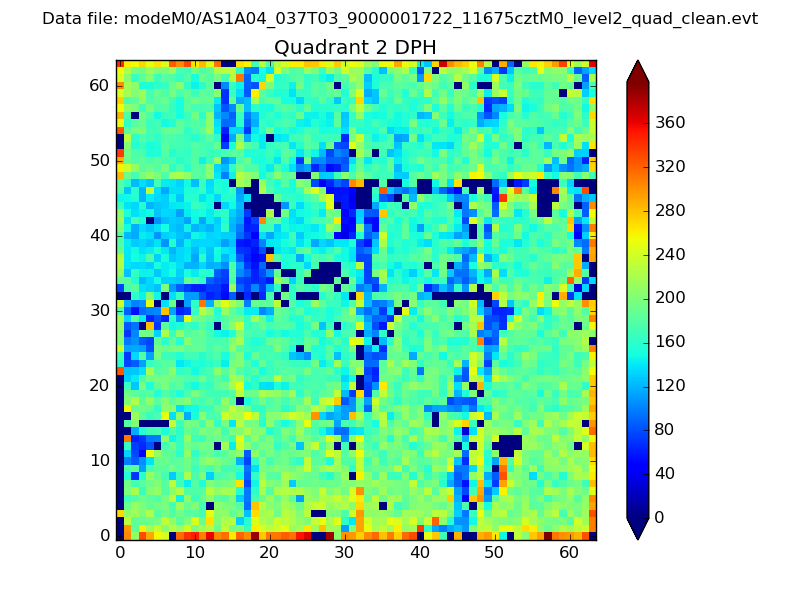 |
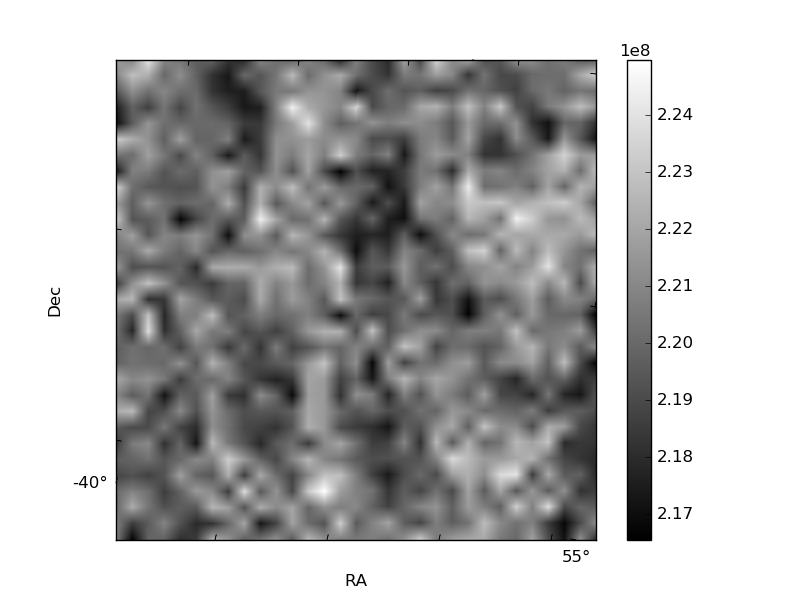
Quadrant C |
| Plot type | Count rate plots | Images |
|---|---|---|
| Comparison with Poisson distribution Blue bars denote a histogram of data divided into 1 sec bins. Red curve is a Poisson curve with rate = median count rate of data. |
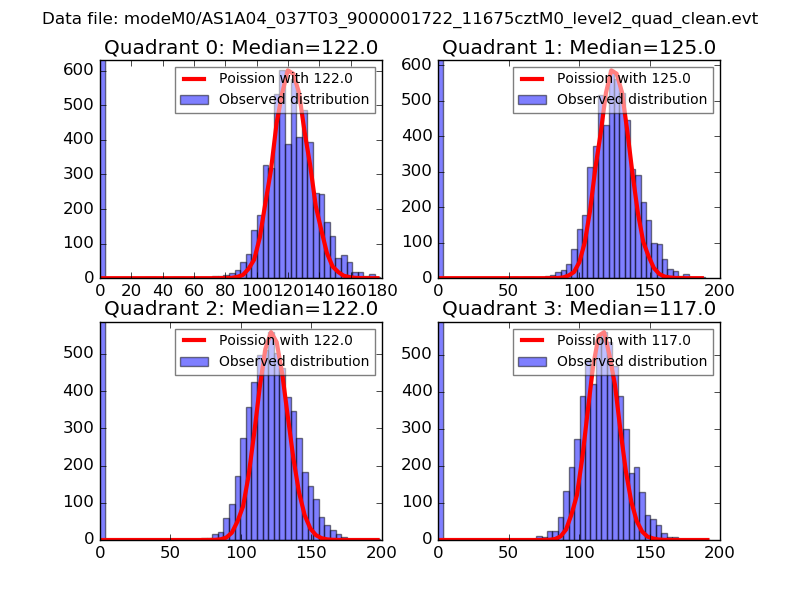 |
 |
| Quadrant-wise count rates Data is divided into 100 sec bins |
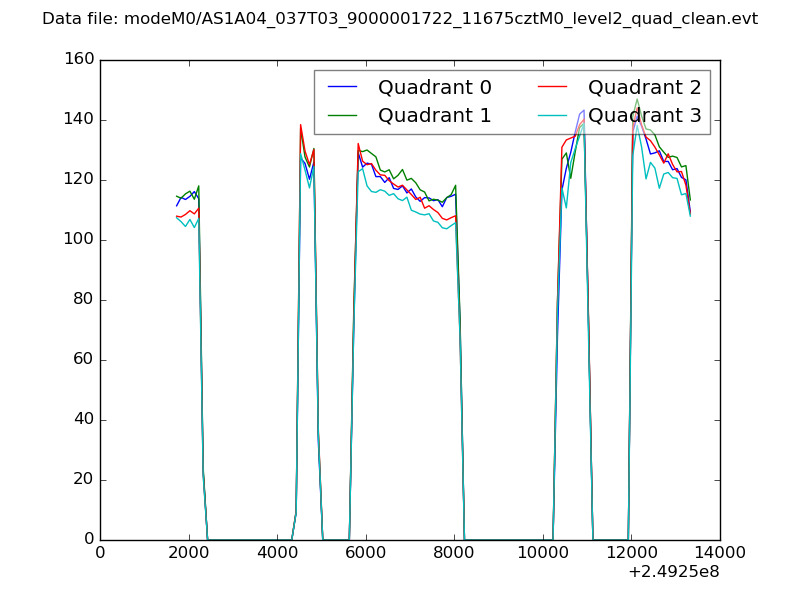 |
|
| Module-wise count rates for Quadrant A Data is divided into 100 sec bins |
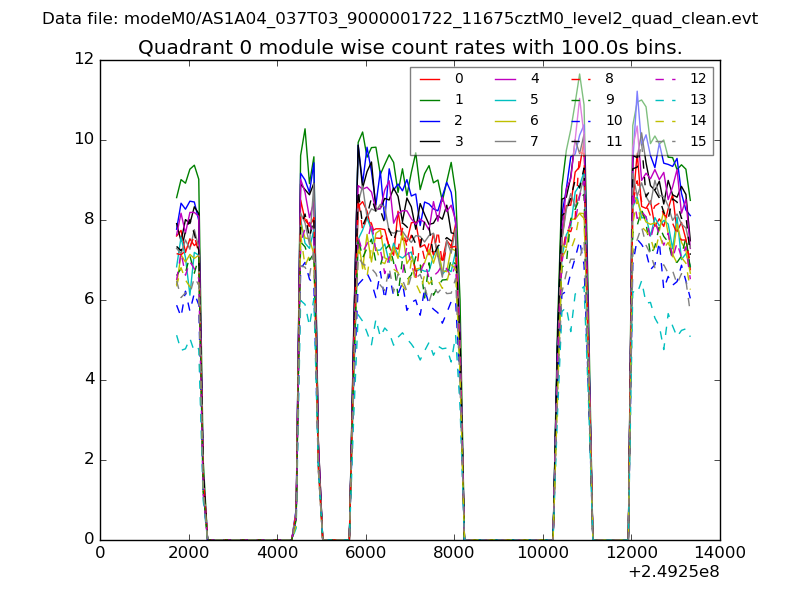 |
 |
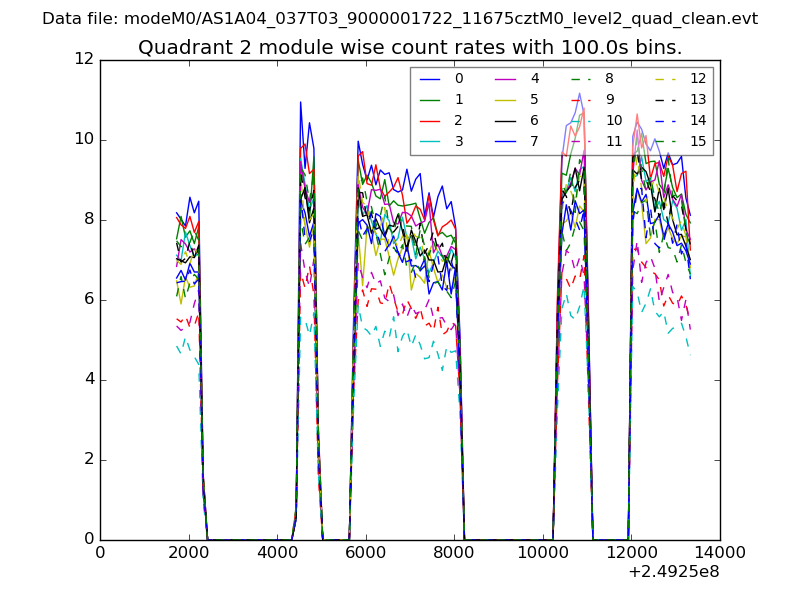
| Module-wise count rates for Quadrant B Data is divided into 100 sec bins |
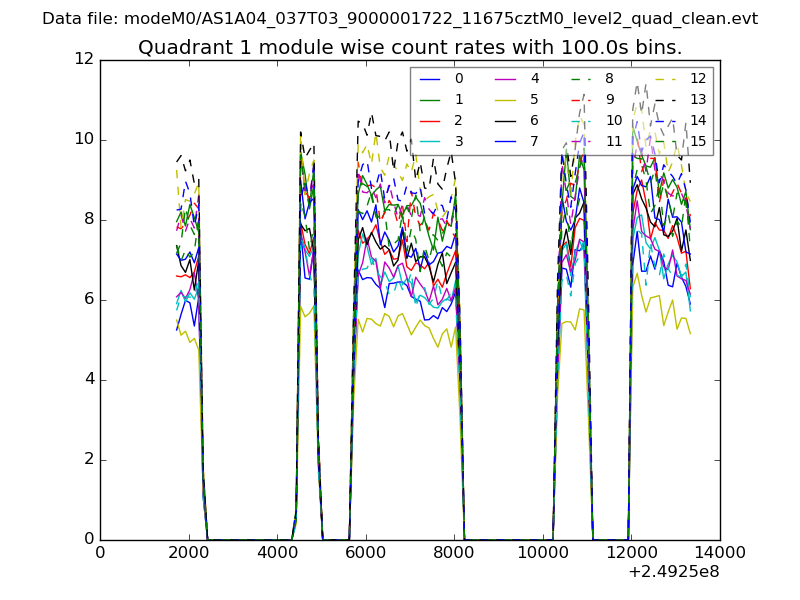 |
 |
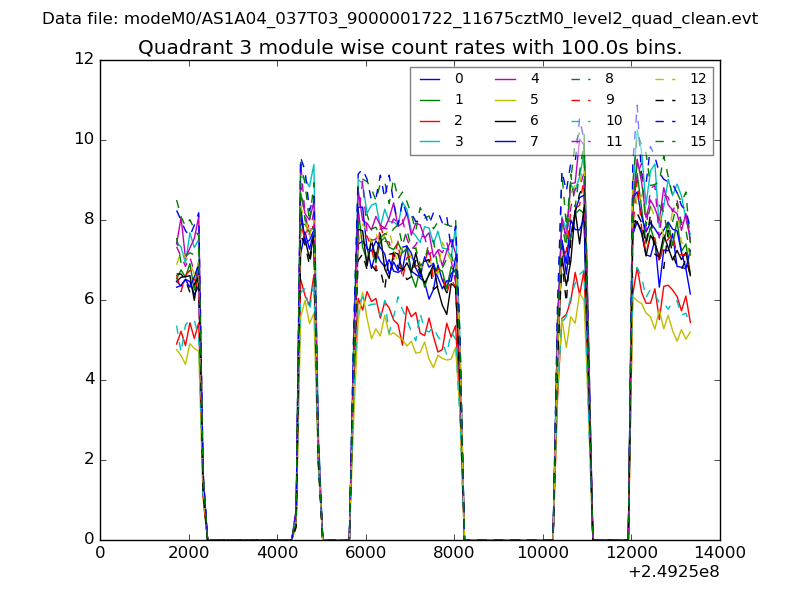
| Module-wise count rates for Quadrant C Data is divided into 100 sec bins |
 |
 |
| Module-wise count rates for Quadrant D Data is divided into 100 sec bins |
 |
 |
| Parameter | Plot |
|---|---|
| CZT HV Monitor | 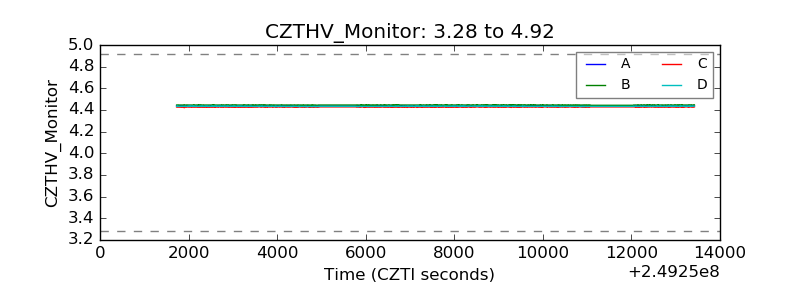 |
| D_VDD |  |
| Temperature 1 | 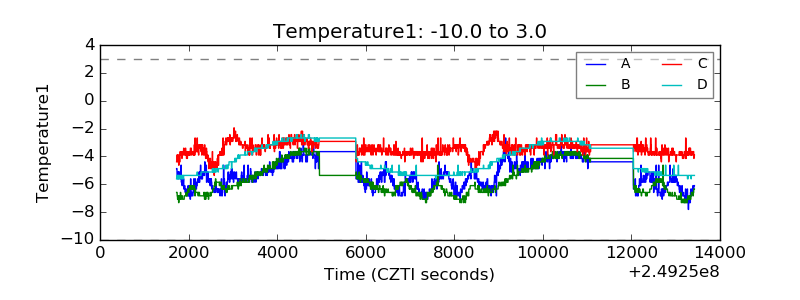 |
| Veto HV Monitor | 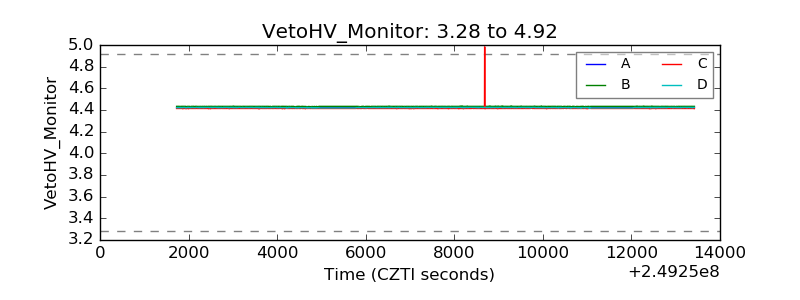 |
| Veto LLD | 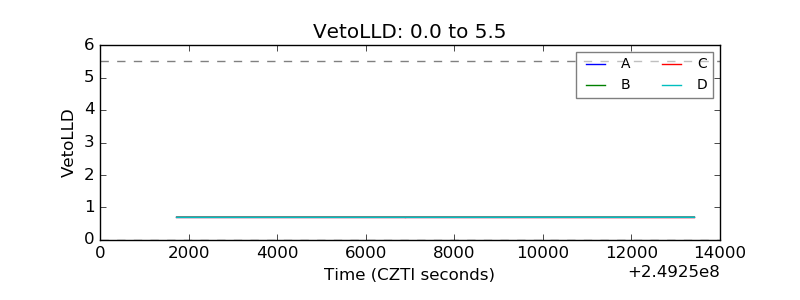 |
| Alpha Counter | 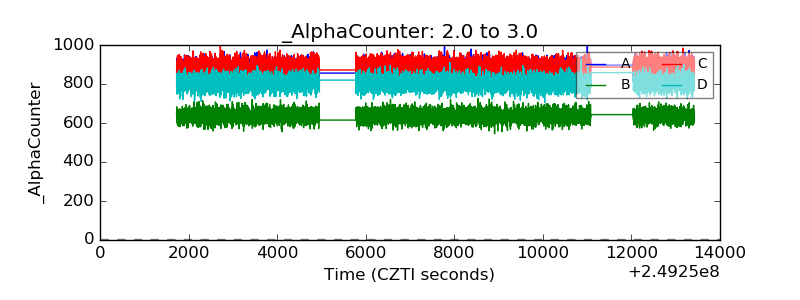 |
| _CPM_Rate | 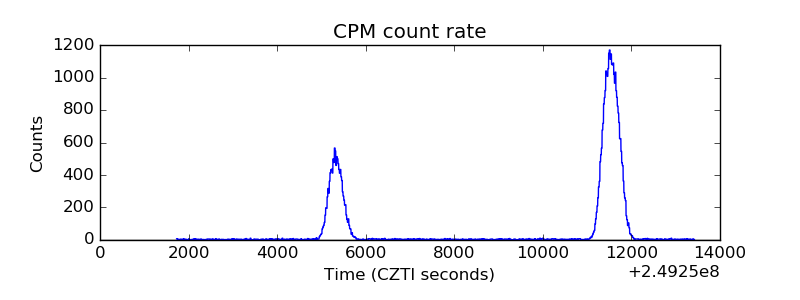 |
| CZT Counter | 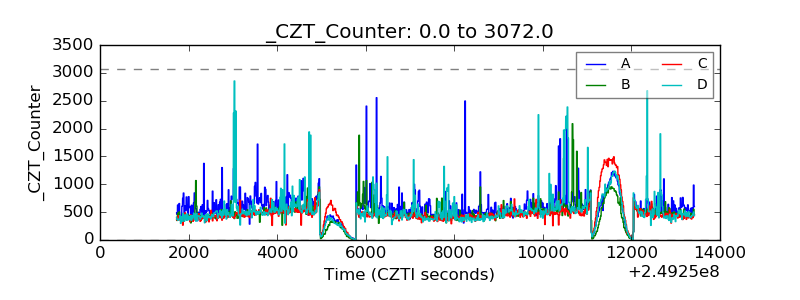 |
| +2.5 Volts monitor |  |
| +5 Volts monitor | 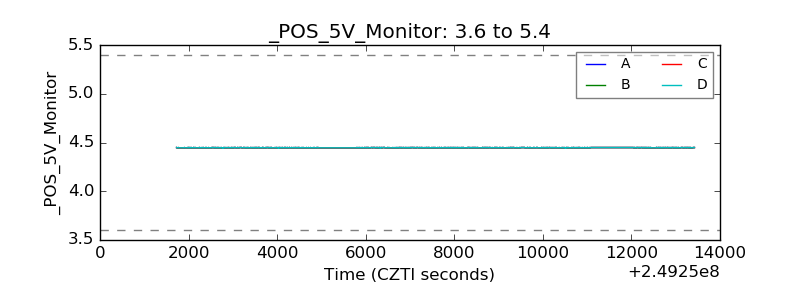 |
| _ROLL_ROT | 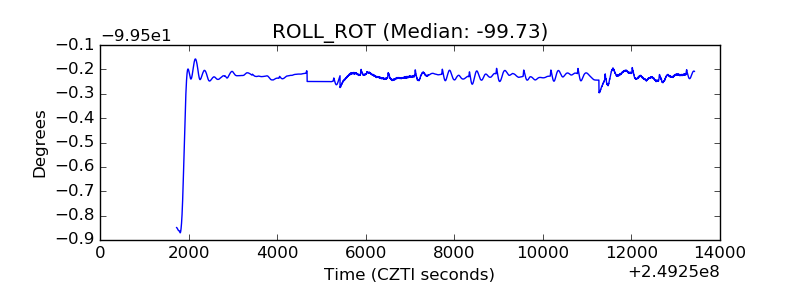 |
| _Roll_DEC | 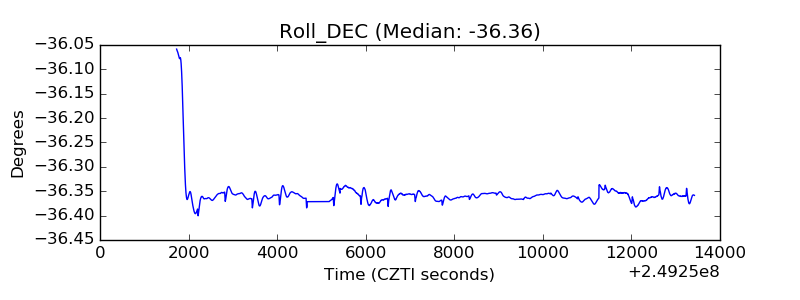 |
| _Roll_RA | 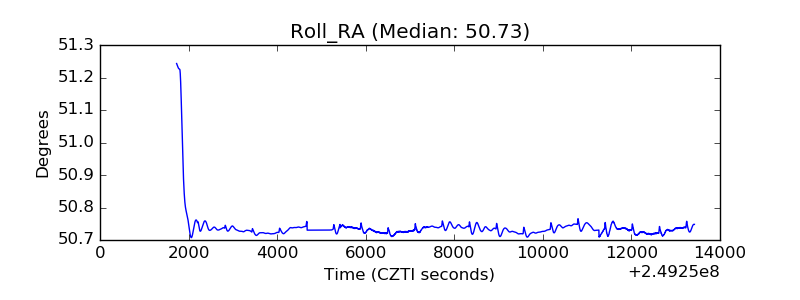 |
| Veto Counter | 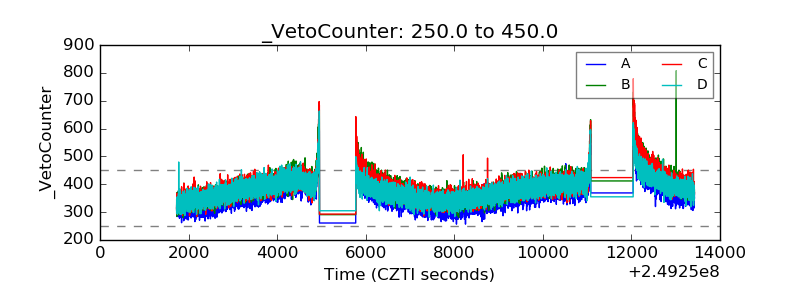 |