| Param | Original file | Final file |
|---|---|---|
| Filename | modeM0/AS1A04_037T03_9000001722_11680cztM0_level2.evt | modeM0/AS1A04_037T03_9000001722_11680cztM0_level2_quad_clean.evt |
| Size (bytes) | 631,745,280 | 74,027,520 |
| Size | 602.5 MB | 70.6 MB |
| Events in quadrant A | 5,271,399 | 414,267 |
| Events in quadrant B | 6,074,647 | 471,975 |
| Events in quadrant C | 3,184,823 | 475,676 |
| Events in quadrant D | 4,182,436 | 446,731 |
| Mode M0 | |||
|---|---|---|---|
| Quadrant | BADHDUFLAG | Total packets | Discarded packets |
| A | 0 | 19807 | 3 |
| B | 0 | 22041 | 2 |
| C | 0 | 13177 | 2 |
| D | 0 | 16444 | 2 |
| Mode SS | |||
|---|---|---|---|
| Quadrant | BADHDUFLAG | Total packets | Discarded packets |
| A | 0 | 126 | 0 |
| B | 0 | 126 | 0 |
| C | 0 | 126 | 0 |
| D | 0 | 126 | 0 |
| Mode M9 | |||
|---|---|---|---|
| Quadrant | BADHDUFLAG | Total packets | Discarded packets |
| A | 0 | 20 | 0 |
| B | 0 | 20 | 0 |
| C | 0 | 20 | 0 |
| D | 0 | 21 | 0 |
| Quadrant | Total seconds | Saturated seconds | Saturation percentage |
|---|---|---|---|
| A | 6196 | 693 | 11.184635% |
| B | 6196 | 1005 | 16.220142% |
| C | 6196 | 78 | 1.258877% |
| D | 6196 | 192 | 3.098773% |
Noise dominated data is calculated using 1-second bins in cleaned event files. If a bin has >2000 counts, and if more than 50% of those come from <1% of pixels, then it is considered to be noise-dominated and hence unusable.
| Quadrant | # 1 sec bins | Bins with >0 counts | Bins with >2000 counts | High rate bins dominated by noise | Noise dominated (total time) | Noise dominated (detector-on time) | Marked lightcurve |
|---|---|---|---|---|---|---|---|
| A | 7492 | 6199 | 419 | 419 | 5.59% | 6.76% | 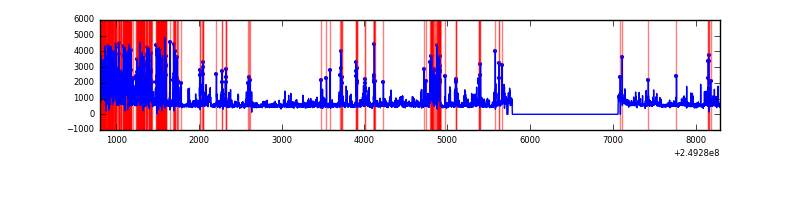 |
| B | 7492 | 6199 | 725 | 725 | 9.68% | 11.70% | 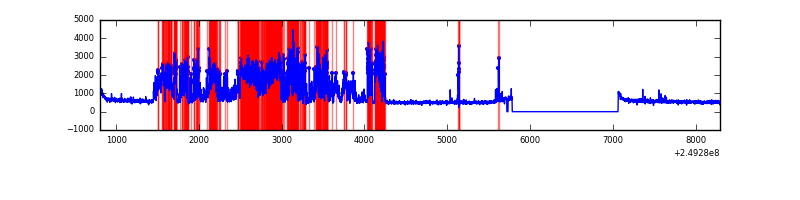 |
| C | 7492 | 6199 | 0 | 0 | 0.00% | 0.00% | 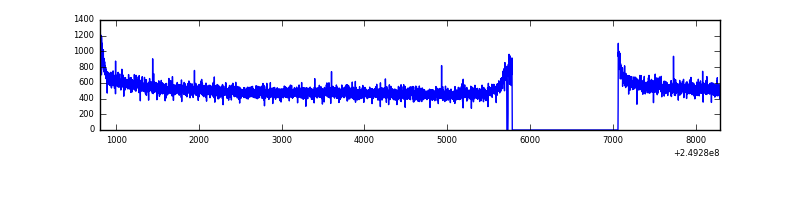 |
| D | 7492 | 6199 | 108 | 108 | 1.44% | 1.74% | 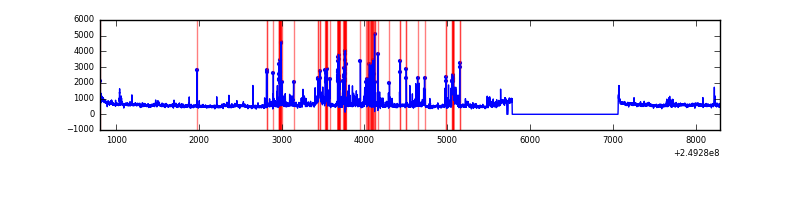 |
Top three noisy pixels from each quadrant. If the there are fewer than three noisy pixels in the level2.evt file, extra rows are filled as -1
| Pixel properties | Quadrant properties | ||||||
|---|---|---|---|---|---|---|---|
| Quadrant | DetID | PixID | Counts | Sigma | Mean | Median | Sigma |
| A | 8 | 5 | 1889868 | 12145.1 | 774 | 760 | 155.5 |
| A | 1 | 162 | 154625 | 989.2 | 774 | 760 | 155.5 |
| A | 1 | 178 | 87949 | 560.54 | 774 | 760 | 155.5 |
| B | 3 | 64 | 2850584 | 19261.23 | 792 | 774 | 148.0 |
| B | 4 | 239 | 73783 | 493.45 | 792 | 774 | 148.0 |
| B | 15 | 204 | 45887 | 304.91 | 792 | 774 | 148.0 |
| C | 13 | 61 | 5919 | 27.43 | 816 | 824 | 185.7 |
| C | 3 | 202 | 2052 | 6.61 | 816 | 824 | 185.7 |
| C | 3 | 203 | 1811 | 5.31 | 816 | 824 | 185.7 |
| D | 1 | 52 | 644810 | 3423.29 | 798 | 778 | 188.1 |
| D | 8 | 195 | 279348 | 1480.71 | 798 | 778 | 188.1 |
| D | 13 | 104 | 180417 | 954.85 | 798 | 778 | 188.1 |
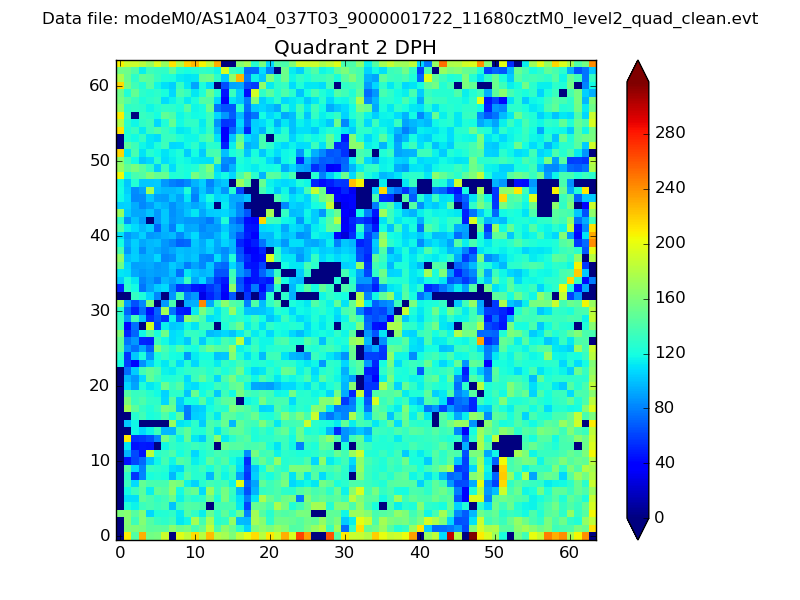
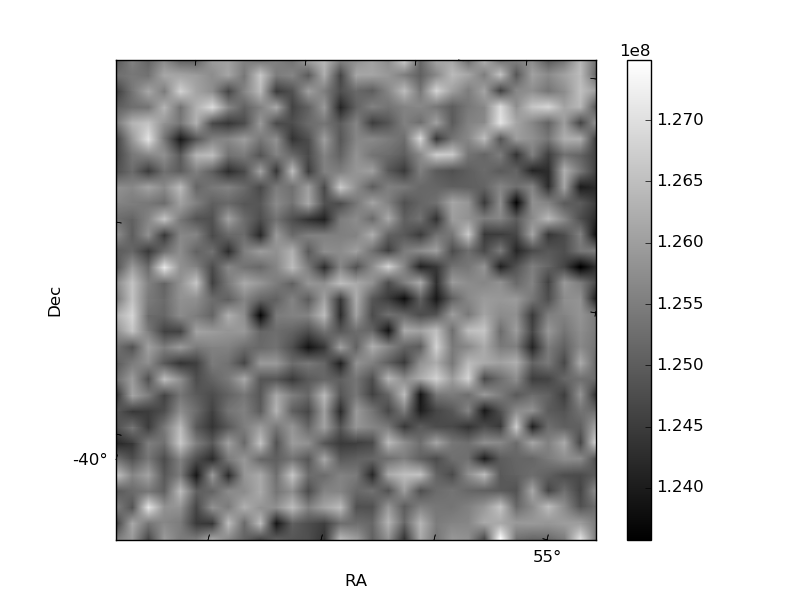
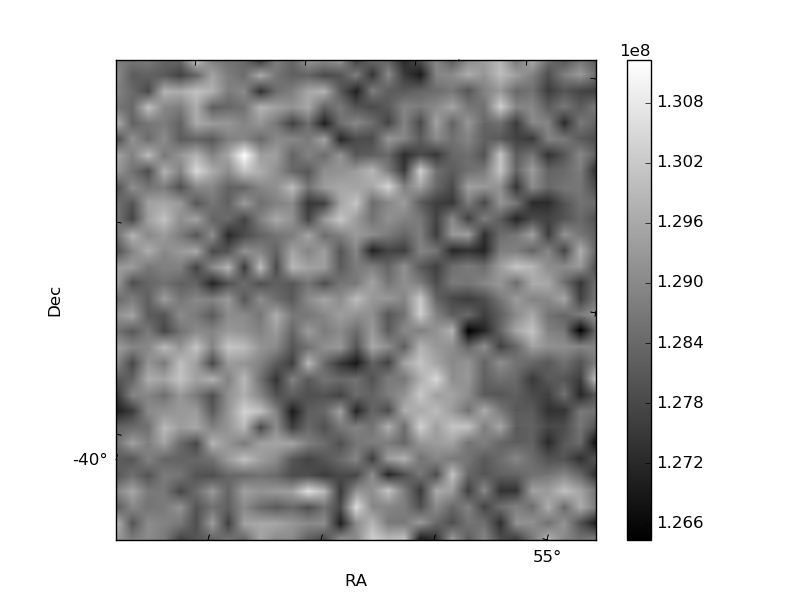
Histogram calculated using DETX and DETY for each event in the final _common_clean file
| Quadrant A |  |
 |
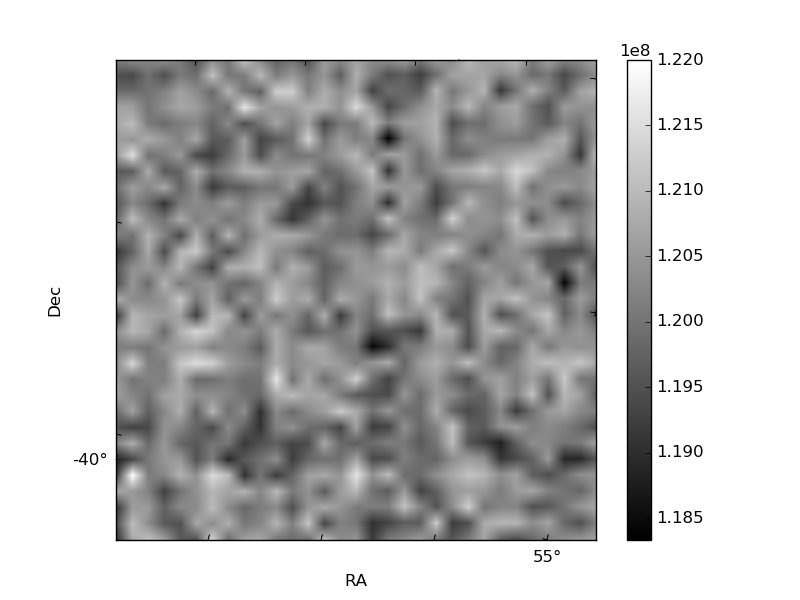
Quadrant B |
|---|---|---|---|
| Quadrant D |  |
 |
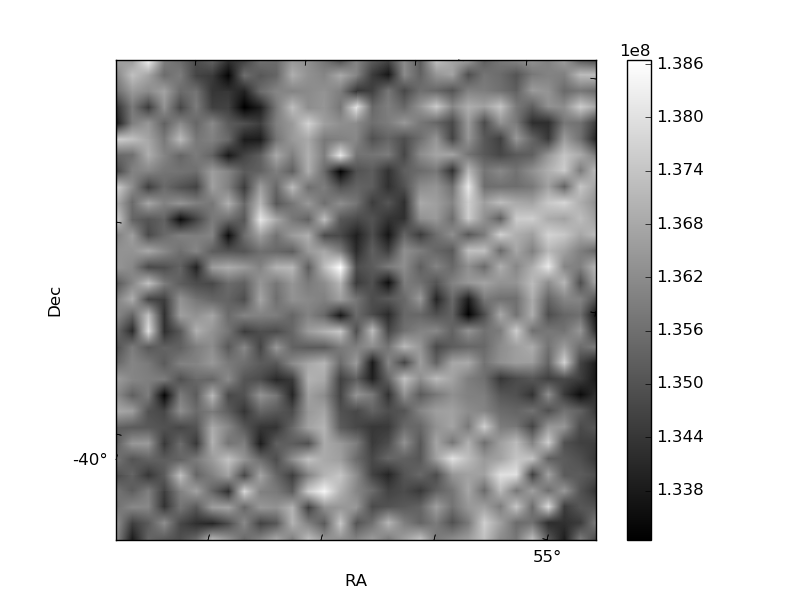
Quadrant C |
| Plot type | Count rate plots | Images |
|---|---|---|
| Comparison with Poisson distribution Blue bars denote a histogram of data divided into 1 sec bins. Red curve is a Poisson curve with rate = median count rate of data. |
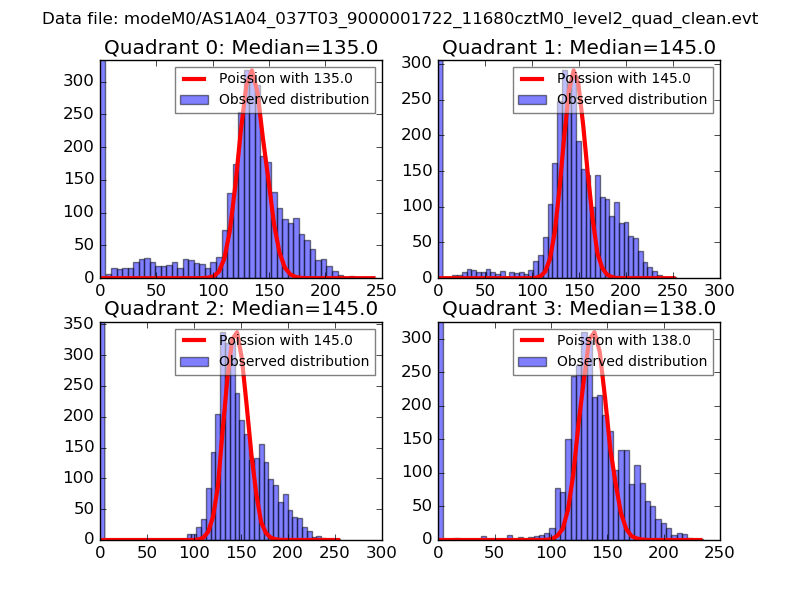 |
 |
| Quadrant-wise count rates Data is divided into 100 sec bins |
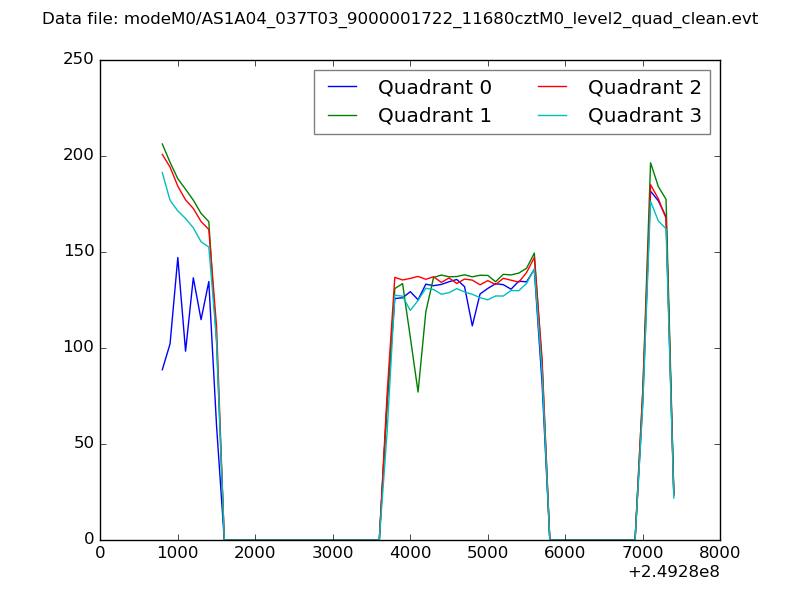 |
|
| Module-wise count rates for Quadrant A Data is divided into 100 sec bins |
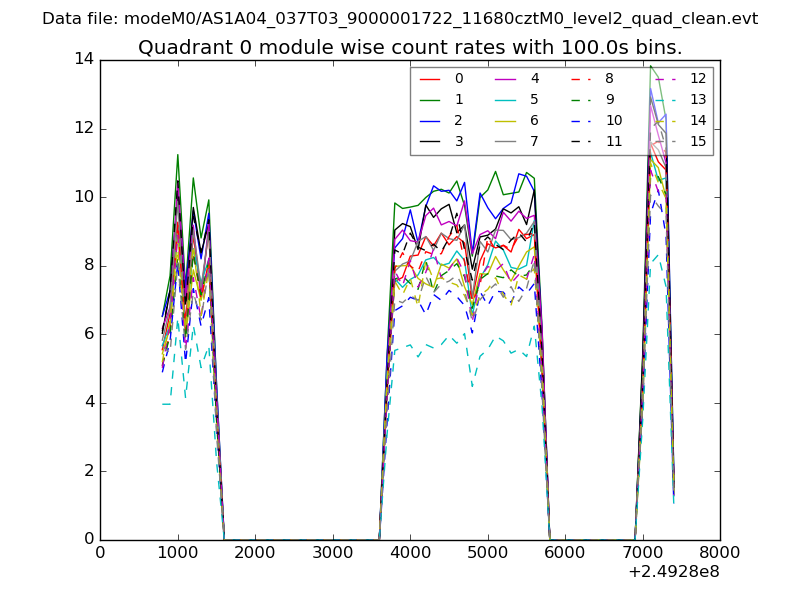 |
 |
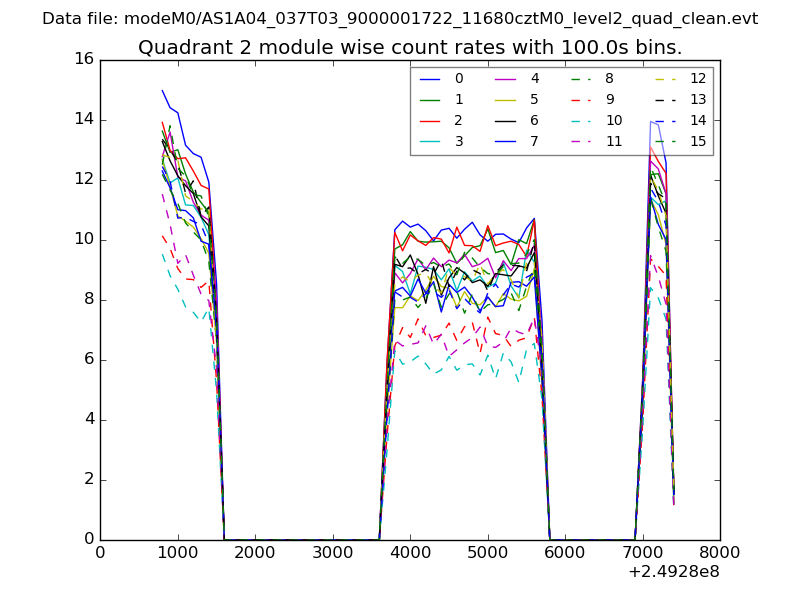
| Module-wise count rates for Quadrant B Data is divided into 100 sec bins |
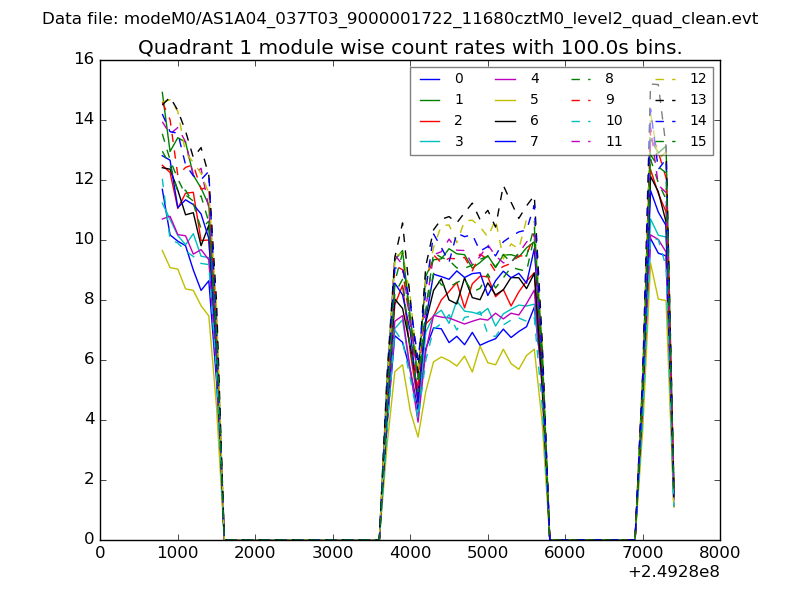 |
 |
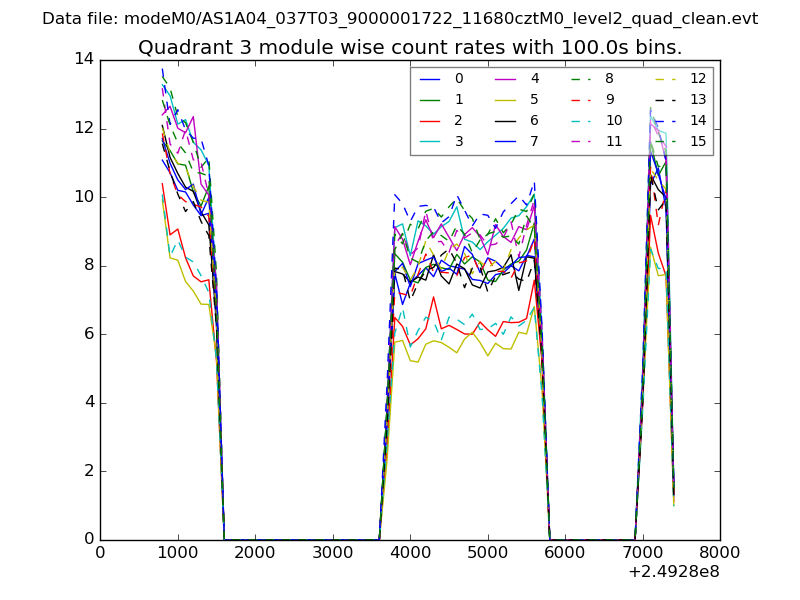
| Module-wise count rates for Quadrant C Data is divided into 100 sec bins |
 |
 |
| Module-wise count rates for Quadrant D Data is divided into 100 sec bins |
 |
 |
| Parameter | Plot |
|---|---|
| CZT HV Monitor | 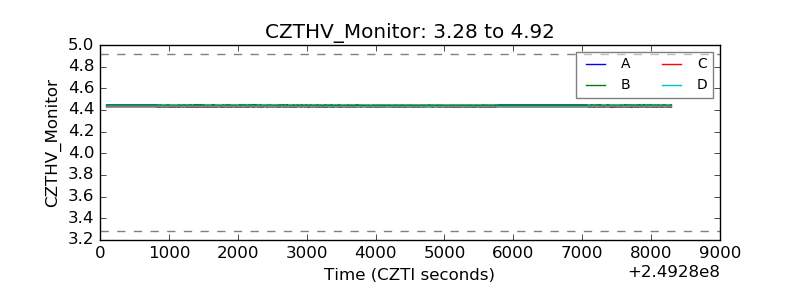 |
| D_VDD | 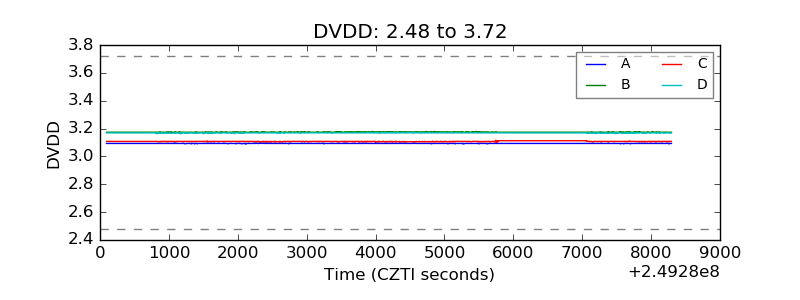 |
| Temperature 1 | 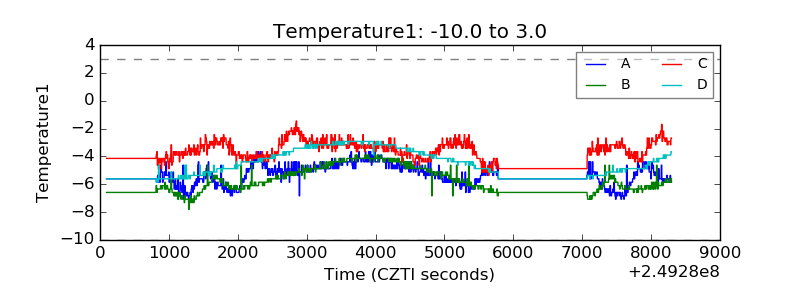 |
| Veto HV Monitor | 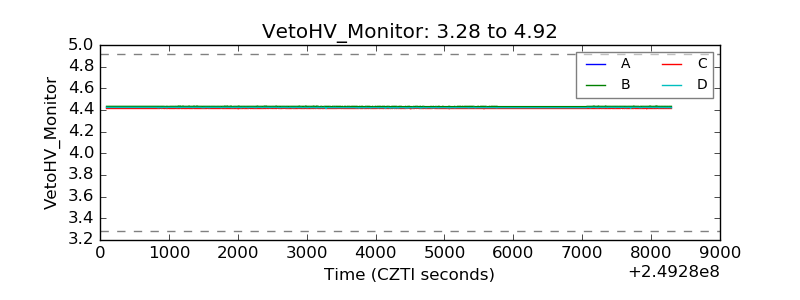 |
| Veto LLD | 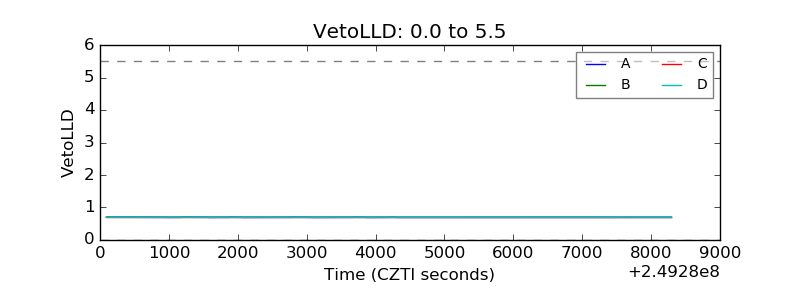 |
| Alpha Counter | 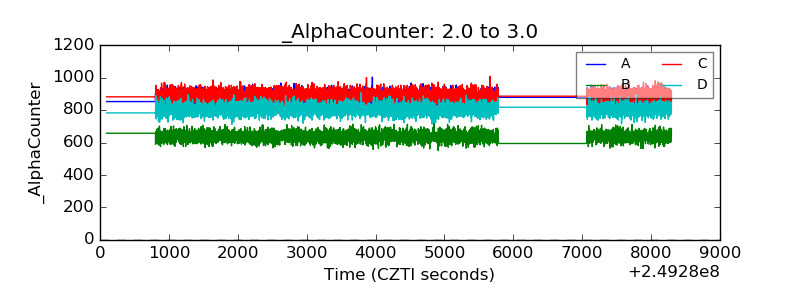 |
| _CPM_Rate | 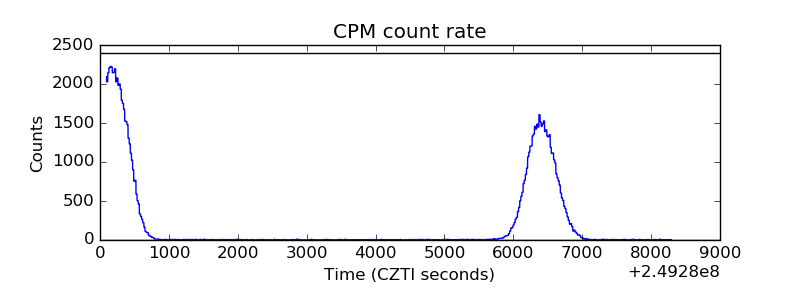 |
| CZT Counter | 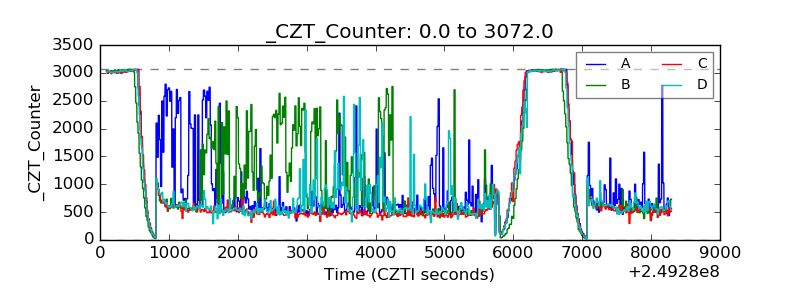 |
| +2.5 Volts monitor |  |
| +5 Volts monitor |  |
| _ROLL_ROT | 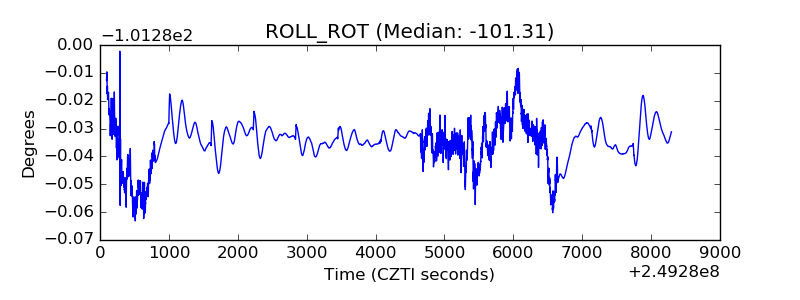 |
| _Roll_DEC | 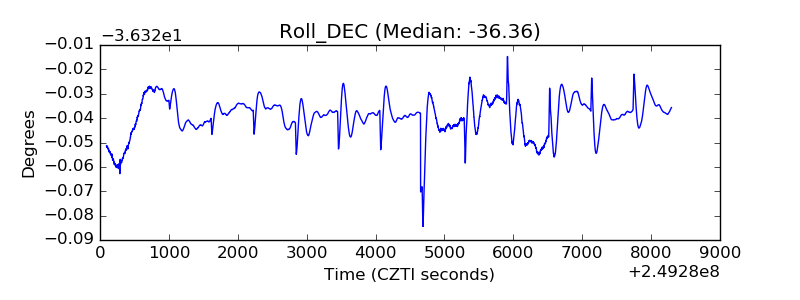 |
| _Roll_RA | 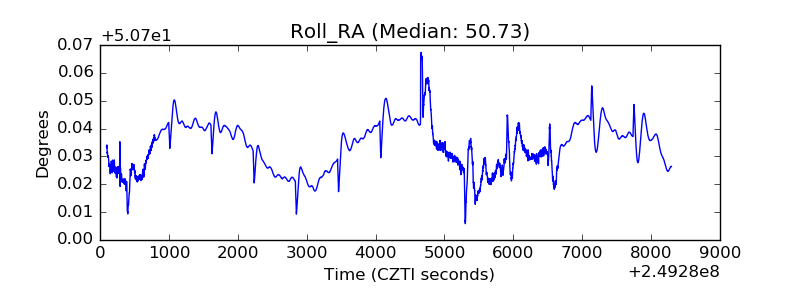 |
| Veto Counter | 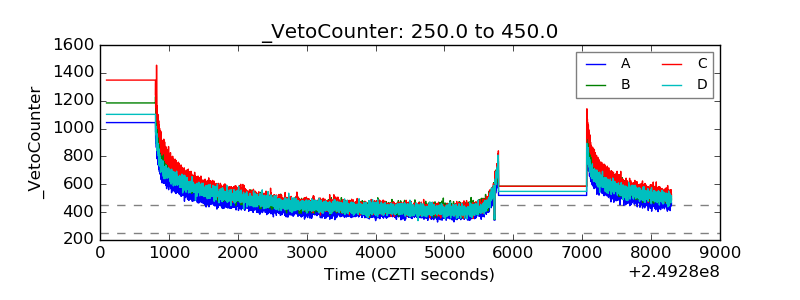 |