| Param | Original file | Final file |
|---|---|---|
| Filename | modeM0/AS1A04_037T03_9000001722_11684cztM0_level2.evt | modeM0/AS1A04_037T03_9000001722_11684cztM0_level2_quad_clean.evt |
| Size (bytes) | 684,656,640 | 92,557,440 |
| Size | 652.9 MB | 88.3 MB |
| Events in quadrant A | 5,866,316 | 556,307 |
| Events in quadrant B | 4,152,726 | 576,970 |
| Events in quadrant C | 3,865,083 | 568,610 |
| Events in quadrant D | 6,304,208 | 539,919 |
| Mode M0 | |||
|---|---|---|---|
| Quadrant | BADHDUFLAG | Total packets | Discarded packets |
| A | 0 | 22966 | 4 |
| B | 0 | 17377 | 3 |
| C | 0 | 17001 | 3 |
| D | 0 | 24577 | 3 |
| Mode SS | |||
|---|---|---|---|
| Quadrant | BADHDUFLAG | Total packets | Discarded packets |
| A | 0 | 166 | 0 |
| B | 0 | 166 | 0 |
| C | 0 | 166 | 0 |
| D | 0 | 166 | 0 |
| Mode M9 | |||
|---|---|---|---|
| Quadrant | BADHDUFLAG | Total packets | Discarded packets |
| A | 0 | 9 | 0 |
| B | 0 | 9 | 0 |
| C | 0 | 9 | 0 |
| D | 0 | 9 | 0 |
| Quadrant | Total seconds | Saturated seconds | Saturation percentage |
|---|---|---|---|
| A | 8067 | 599 | 7.425313% |
| B | 8067 | 361 | 4.475022% |
| C | 8067 | 225 | 2.789141% |
| D | 8067 | 683 | 8.466592% |
Noise dominated data is calculated using 1-second bins in cleaned event files. If a bin has >2000 counts, and if more than 50% of those come from <1% of pixels, then it is considered to be noise-dominated and hence unusable.
| Quadrant | # 1 sec bins | Bins with >0 counts | Bins with >2000 counts | High rate bins dominated by noise | Noise dominated (total time) | Noise dominated (detector-on time) | Marked lightcurve |
|---|---|---|---|---|---|---|---|
| A | 9018 | 8071 | 134 | 134 | 1.49% | 1.66% |  |
| B | 9018 | 8071 | 4 | 4 | 0.04% | 0.05% | 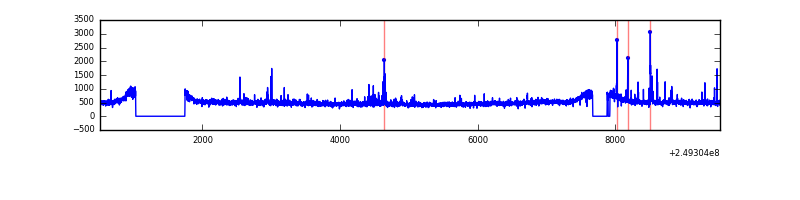 |
| C | 9018 | 8071 | 1 | 1 | 0.01% | 0.01% | 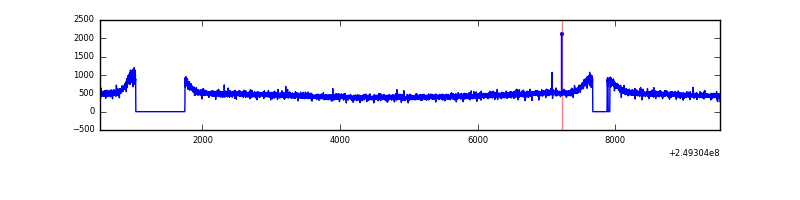 |
| D | 9018 | 8071 | 346 | 346 | 3.84% | 4.29% | 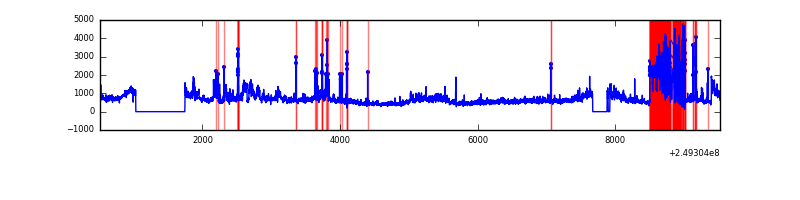 |
Top three noisy pixels from each quadrant. If the there are fewer than three noisy pixels in the level2.evt file, extra rows are filled as -1
| Pixel properties | Quadrant properties | ||||||
|---|---|---|---|---|---|---|---|
| Quadrant | DetID | PixID | Counts | Sigma | Mean | Median | Sigma |
| A | 8 | 5 | 1607434 | 7864.67 | 997 | 972 | 204.3 |
| A | 1 | 162 | 163715 | 796.73 | 997 | 972 | 204.3 |
| A | 1 | 178 | 88564 | 428.82 | 997 | 972 | 204.3 |
| B | 15 | 204 | 68388 | 344.5 | 1008 | 979 | 195.7 |
| B | 3 | 189 | 59855 | 300.89 | 1008 | 979 | 195.7 |
| B | 4 | 239 | 57241 | 287.53 | 1008 | 979 | 195.7 |
| C | 13 | 61 | 7260 | 27.12 | 990 | 993 | 231.1 |
| C | 14 | 234 | 3558 | 11.1 | 990 | 993 | 231.1 |
| C | 3 | 202 | 2397 | 6.08 | 990 | 993 | 231.1 |
| D | 13 | 152 | 1711029 | 7340.69 | 963 | 934 | 233.0 |
| D | 8 | 195 | 398181 | 1705.21 | 963 | 934 | 233.0 |
| D | 1 | 52 | 393971 | 1687.14 | 963 | 934 | 233.0 |
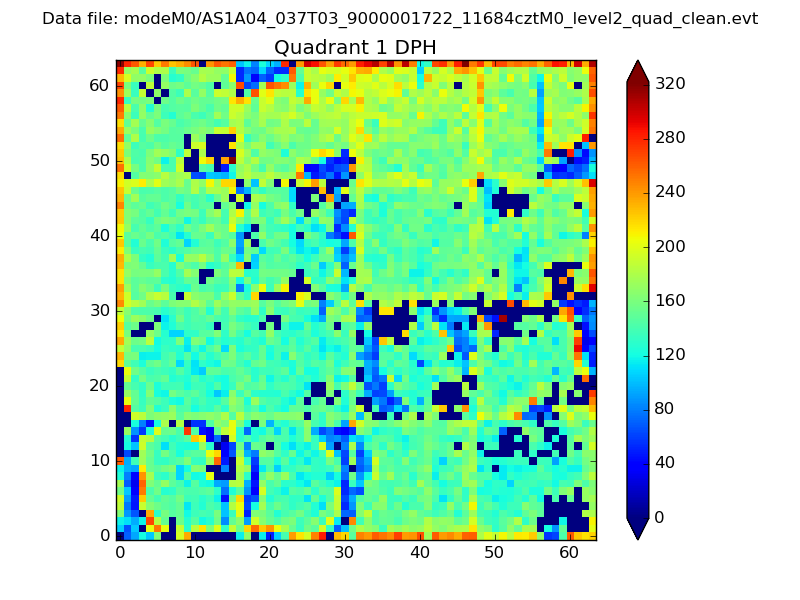
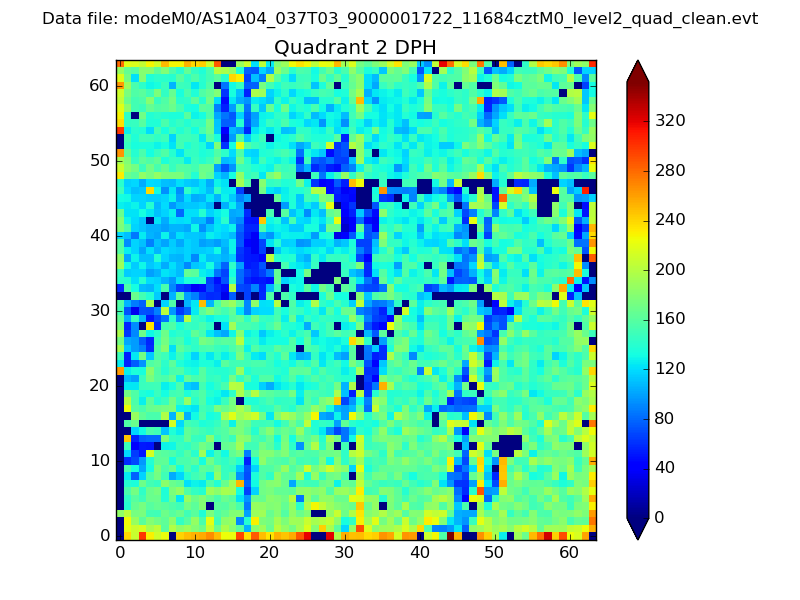
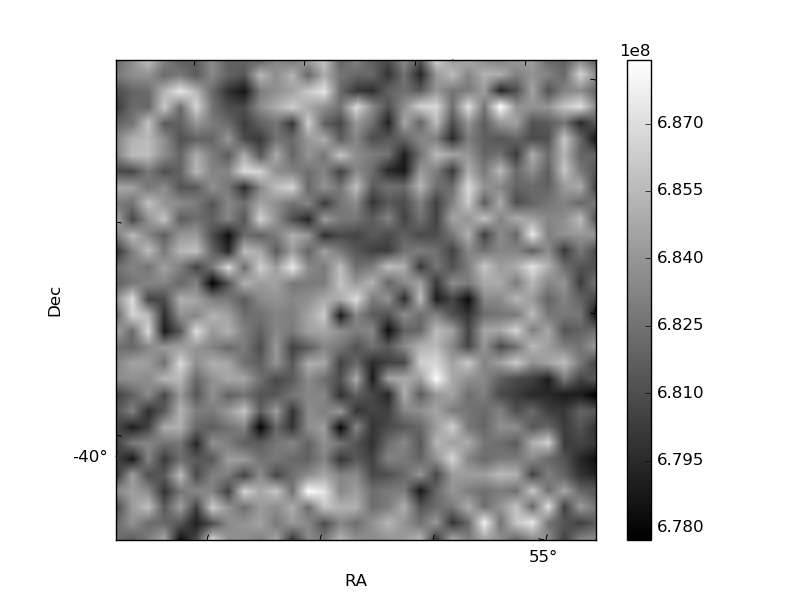
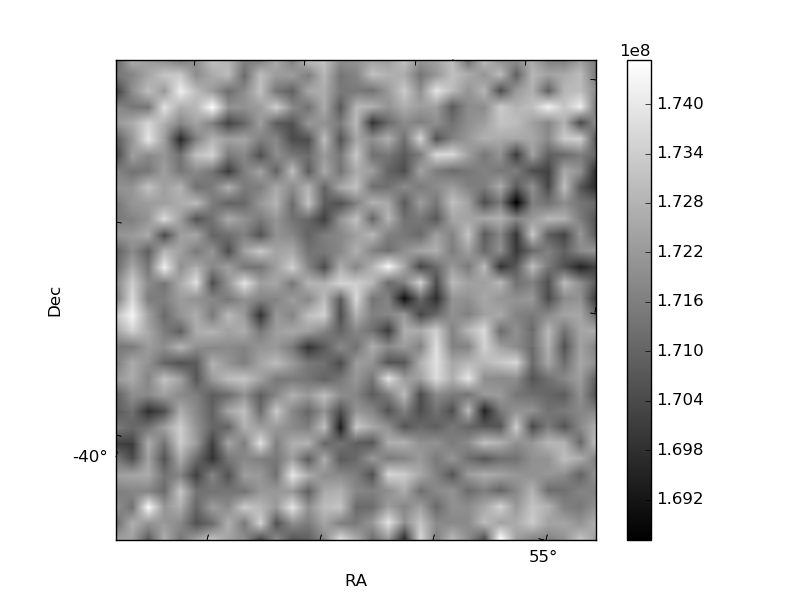
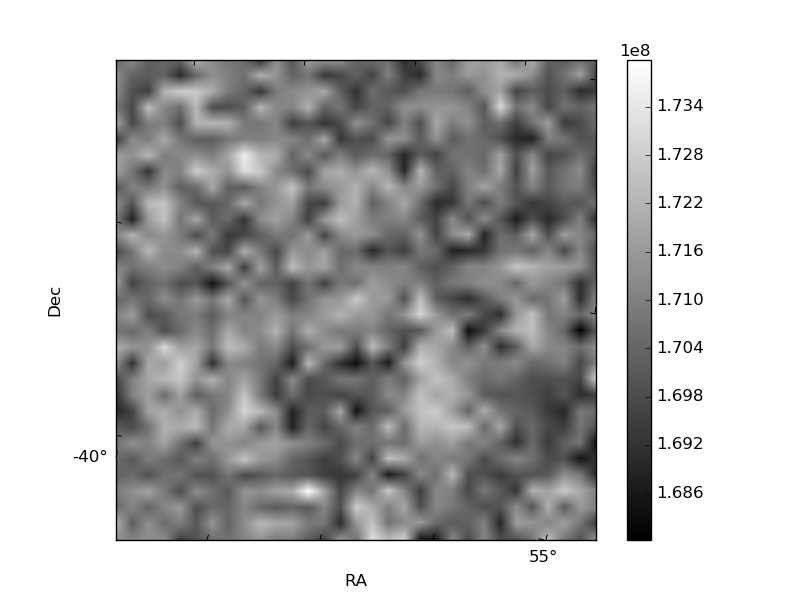
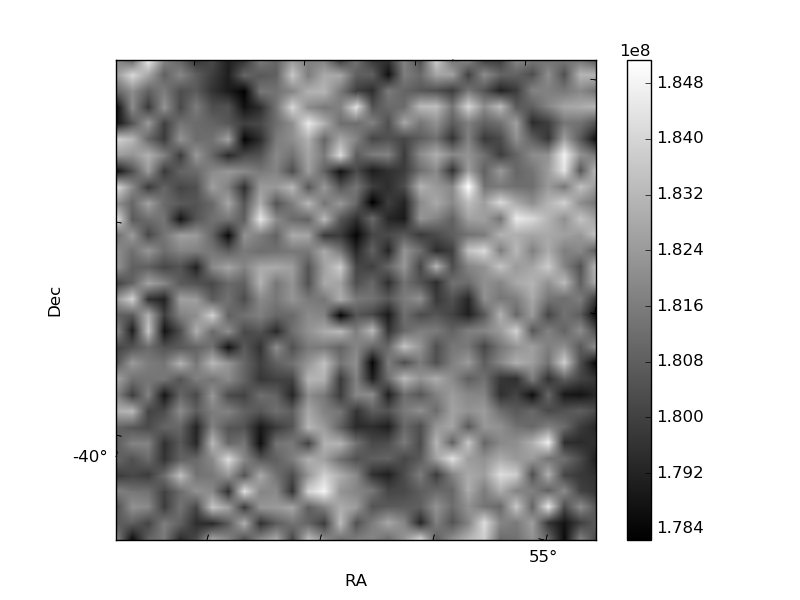
Histogram calculated using DETX and DETY for each event in the final _common_clean file
| Quadrant A | 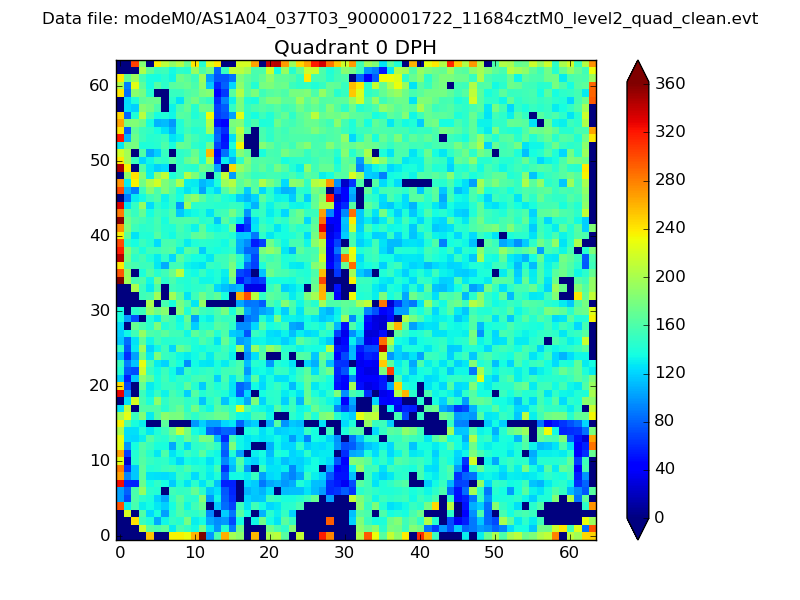 |
 |
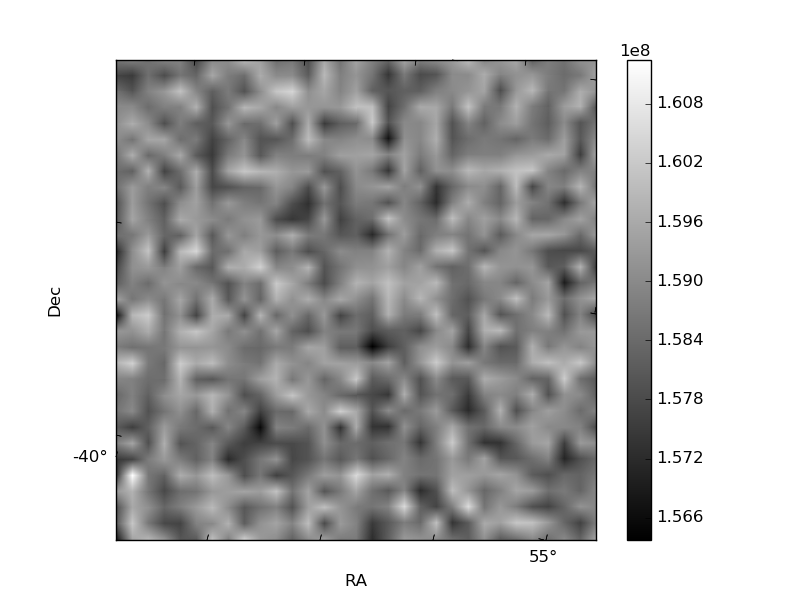
Quadrant B |
|---|---|---|---|
| Quadrant D | 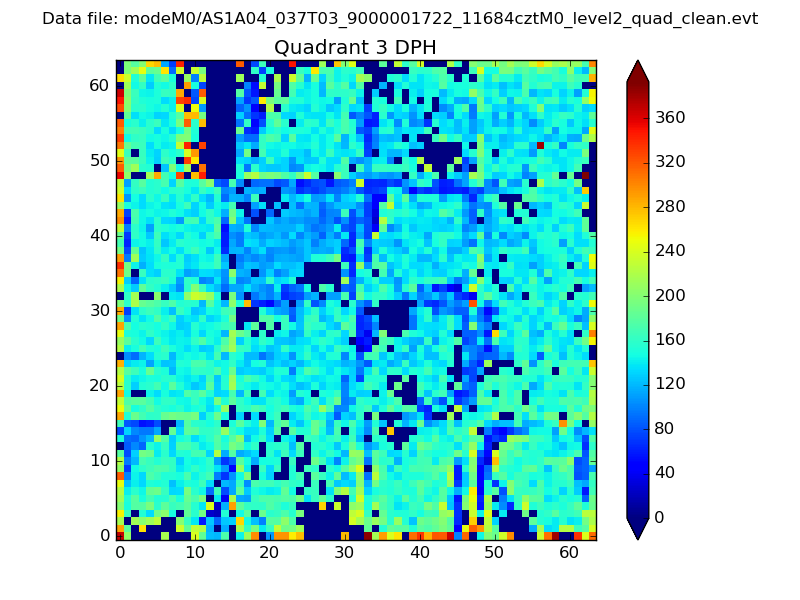 |
 |
Quadrant C |
| Plot type | Count rate plots | Images |
|---|---|---|
| Comparison with Poisson distribution Blue bars denote a histogram of data divided into 1 sec bins. Red curve is a Poisson curve with rate = median count rate of data. |
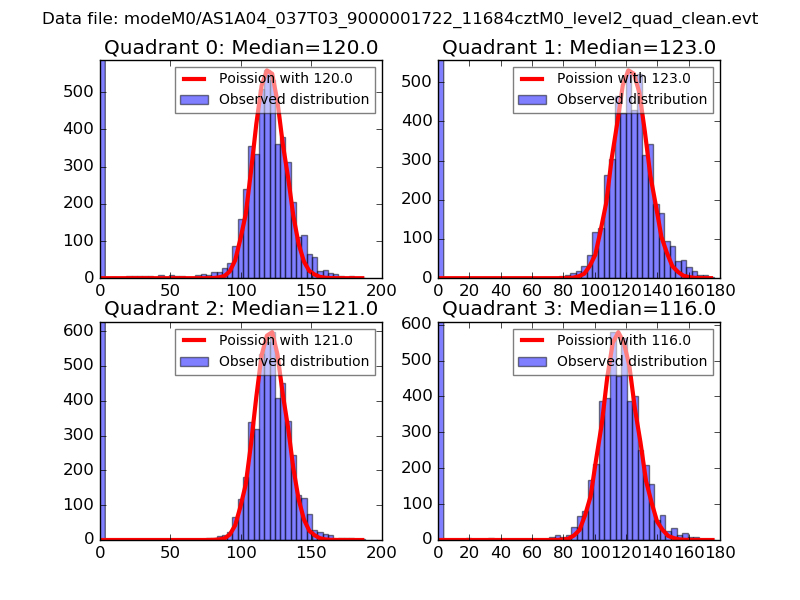 |
 |
| Quadrant-wise count rates Data is divided into 100 sec bins |
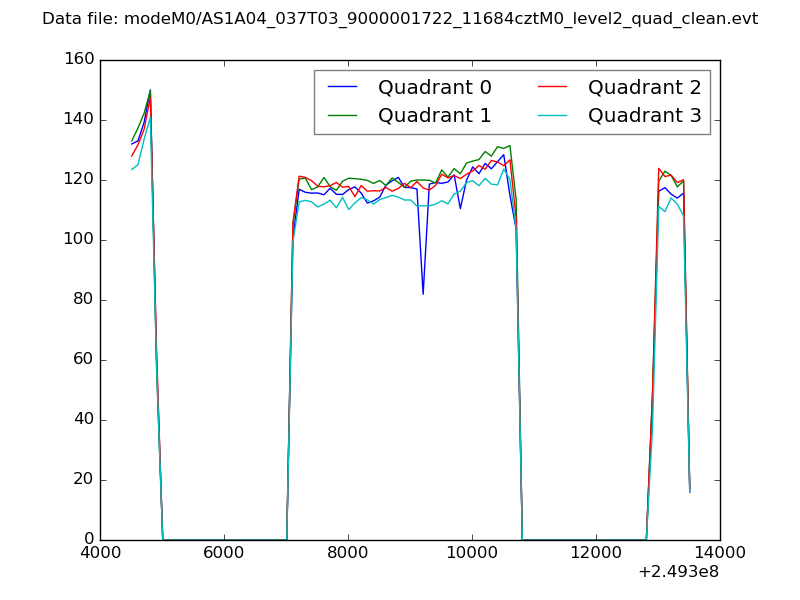 |
|
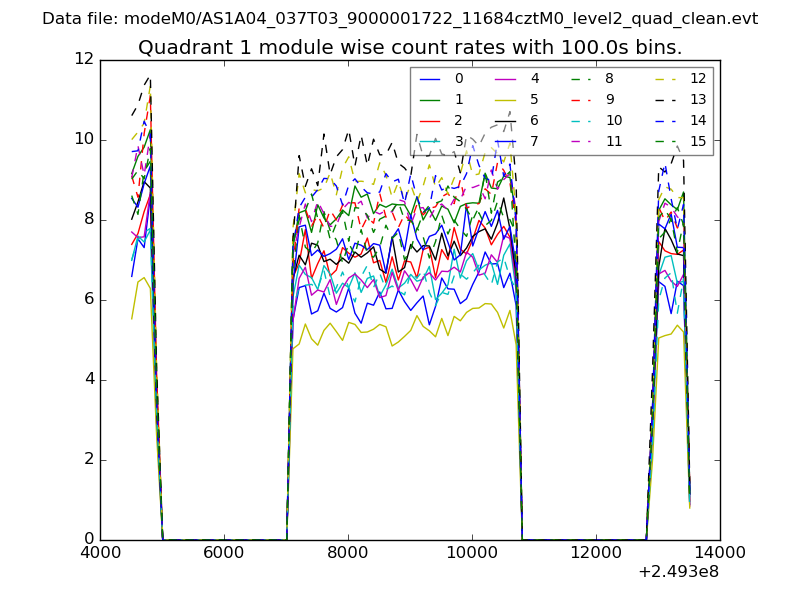
| Module-wise count rates for Quadrant A Data is divided into 100 sec bins |
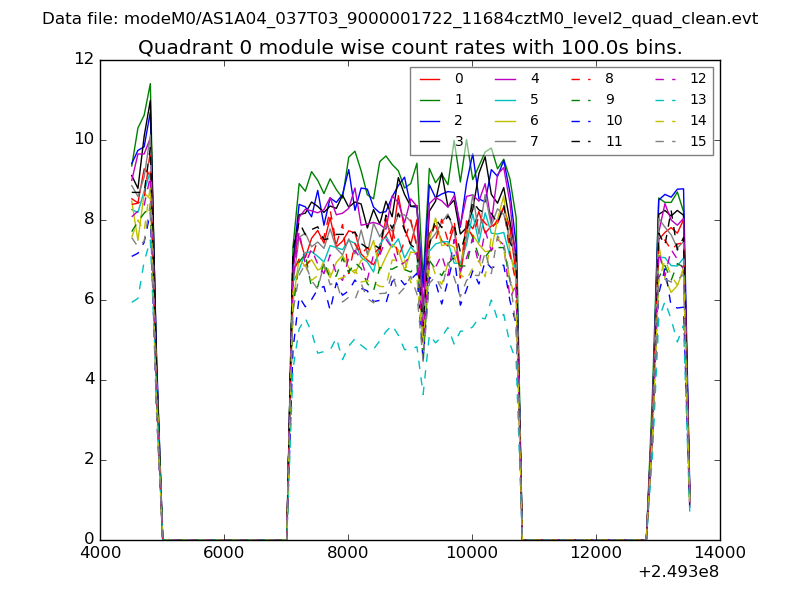 |
 |
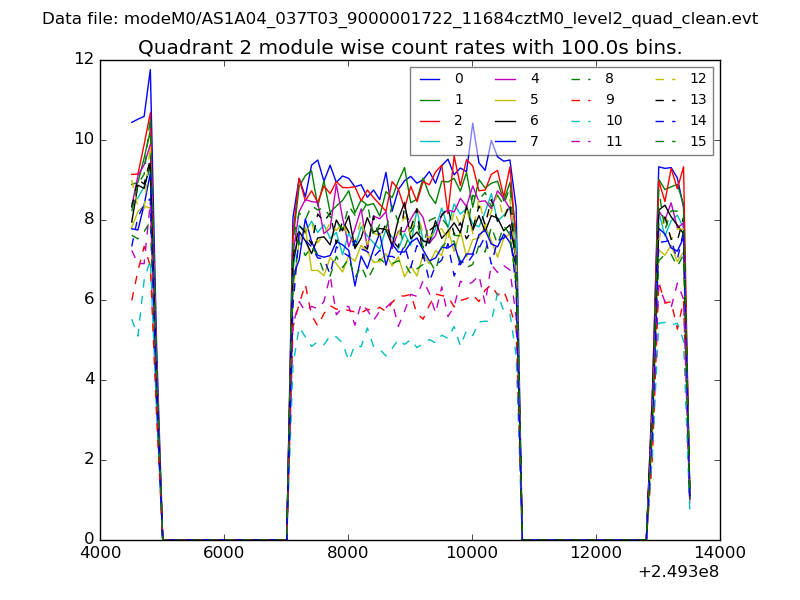
| Module-wise count rates for Quadrant B Data is divided into 100 sec bins |
 |
 |
| Module-wise count rates for Quadrant C Data is divided into 100 sec bins |
 |
 |
| Module-wise count rates for Quadrant D Data is divided into 100 sec bins |
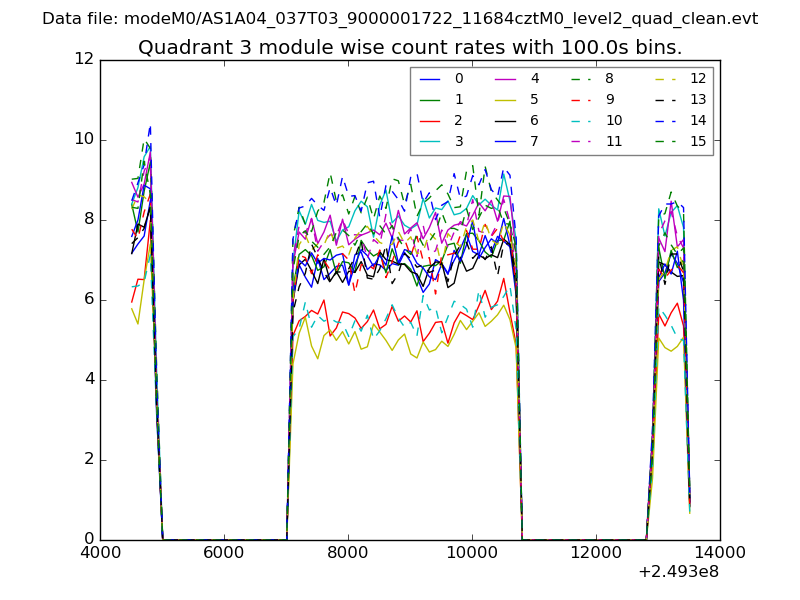 |
 |
| Parameter | Plot |
|---|---|
| CZT HV Monitor | 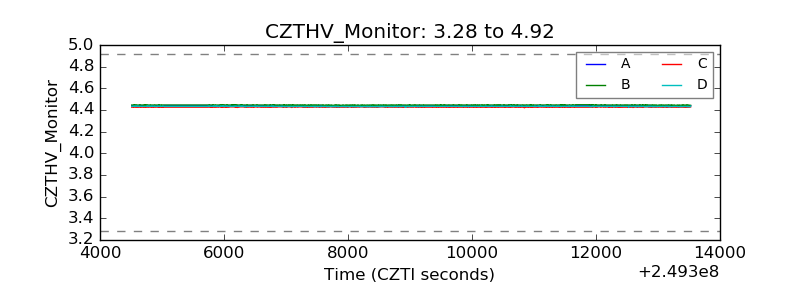 |
| D_VDD | 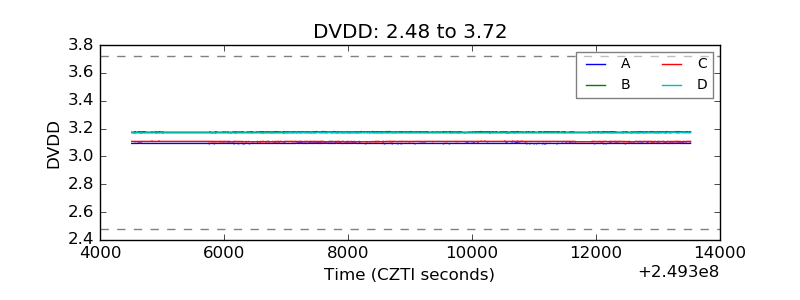 |
| Temperature 1 | 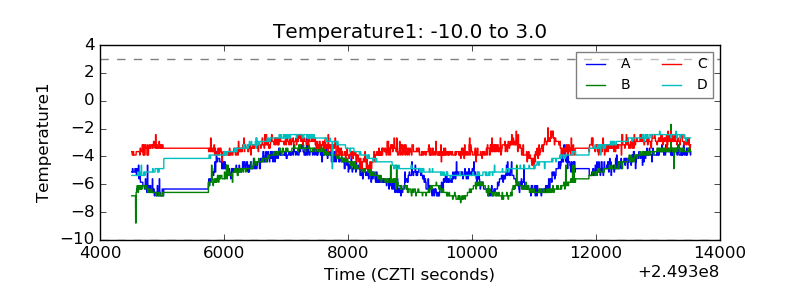 |
| Veto HV Monitor | 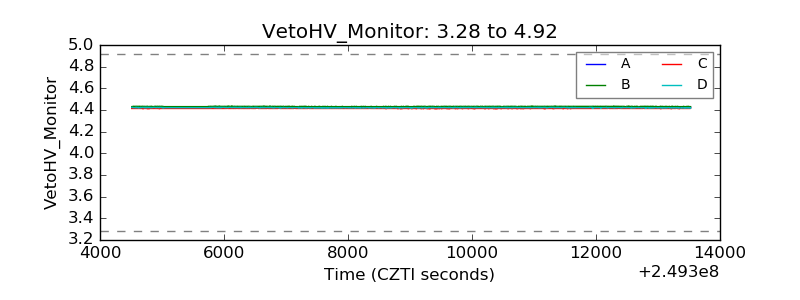 |
| Veto LLD | 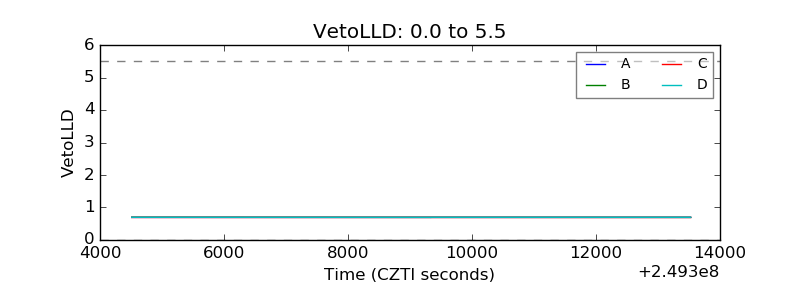 |
| Alpha Counter | 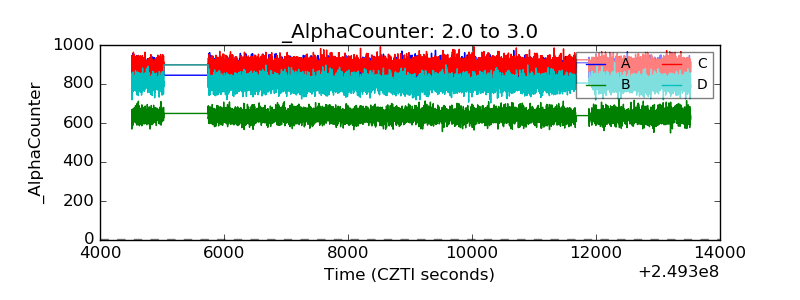 |
| _CPM_Rate | 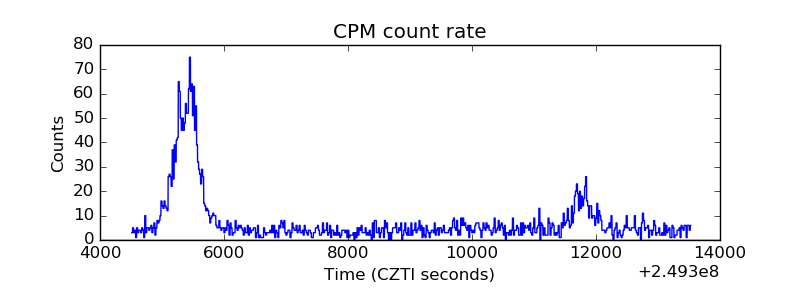 |
| CZT Counter | 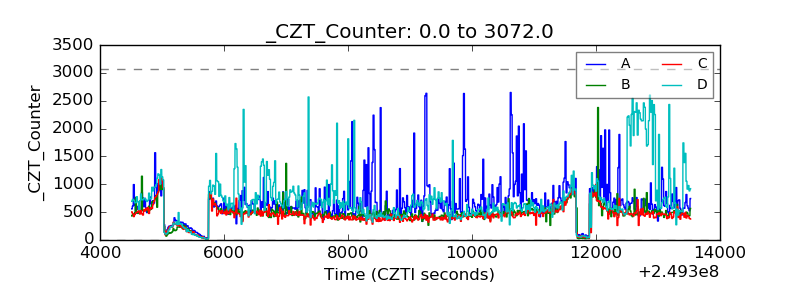 |
| +2.5 Volts monitor |  |
| +5 Volts monitor |  |
| _ROLL_ROT | 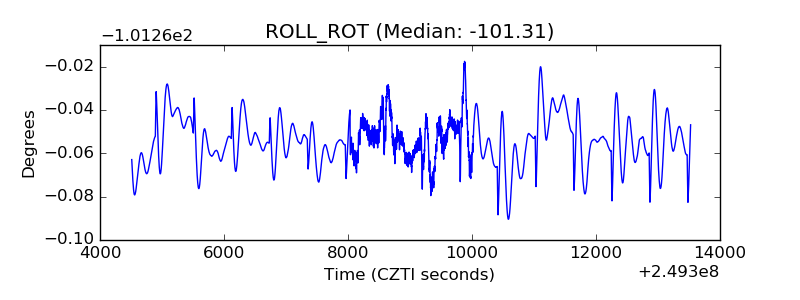 |
| _Roll_DEC | 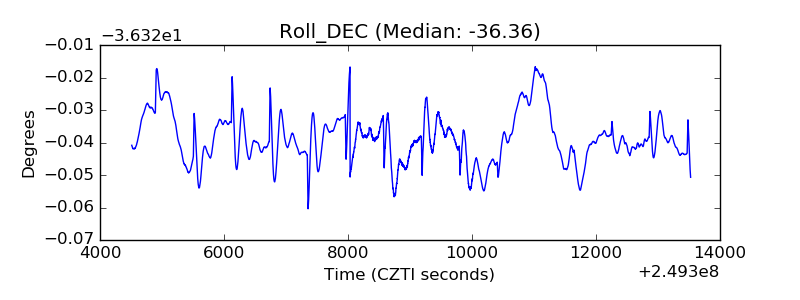 |
| _Roll_RA | 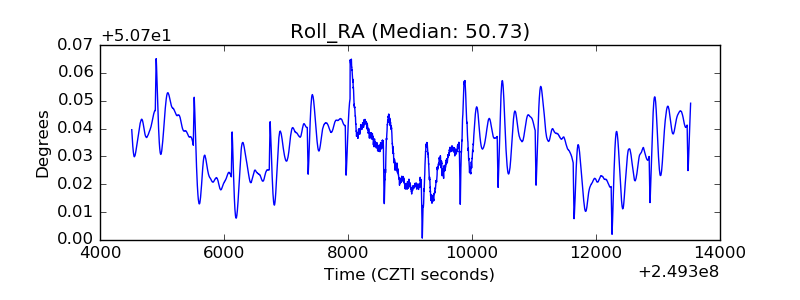 |
| Veto Counter | 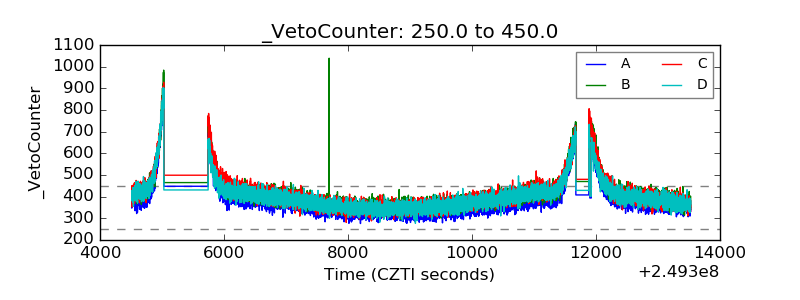 |