| Param | Original file | Final file |
|---|---|---|
| Filename | modeM0/AS1A04_037T03_9000001722_11685cztM0_level2.evt | modeM0/AS1A04_037T03_9000001722_11685cztM0_level2_quad_clean.evt |
| Size (bytes) | 318,058,560 | 36,982,080 |
| Size | 303.3 MB | 35.3 MB |
| Events in quadrant A | 2,380,986 | 221,383 |
| Events in quadrant B | 1,841,178 | 226,460 |
| Events in quadrant C | 1,580,013 | 225,242 |
| Events in quadrant D | 3,602,429 | 209,486 |
| Mode M0 | |||
|---|---|---|---|
| Quadrant | BADHDUFLAG | Total packets | Discarded packets |
| A | 0 | 9359 | 2 |
| B | 0 | 7591 | 2 |
| C | 0 | 7095 | 2 |
| D | 0 | 13069 | 2 |
| Mode SS | |||
|---|---|---|---|
| Quadrant | BADHDUFLAG | Total packets | Discarded packets |
| A | 0 | 70 | 0 |
| B | 0 | 70 | 0 |
| C | 0 | 70 | 0 |
| D | 0 | 70 | 0 |
| Mode M9 | |||
|---|---|---|---|
| Quadrant | BADHDUFLAG | Total packets | Discarded packets |
| A | 0 | 2 | 0 |
| B | 0 | 2 | 0 |
| C | 0 | 2 | 0 |
| D | 0 | 2 | 0 |
| Quadrant | Total seconds | Saturated seconds | Saturation percentage |
|---|---|---|---|
| A | 3333 | 302 | 9.060906% |
| B | 3333 | 212 | 6.360636% |
| C | 3333 | 112 | 3.360336% |
| D | 3333 | 529 | 15.871587% |
Noise dominated data is calculated using 1-second bins in cleaned event files. If a bin has >2000 counts, and if more than 50% of those come from <1% of pixels, then it is considered to be noise-dominated and hence unusable.
| Quadrant | # 1 sec bins | Bins with >0 counts | Bins with >2000 counts | High rate bins dominated by noise | Noise dominated (total time) | Noise dominated (detector-on time) | Marked lightcurve |
|---|---|---|---|---|---|---|---|
| A | 3569 | 3336 | 25 | 25 | 0.70% | 0.75% | 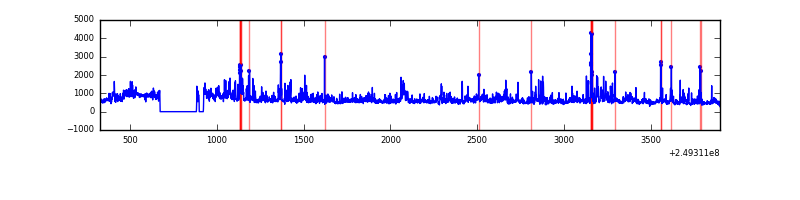 |
| B | 3569 | 3336 | 9 | 9 | 0.25% | 0.27% | 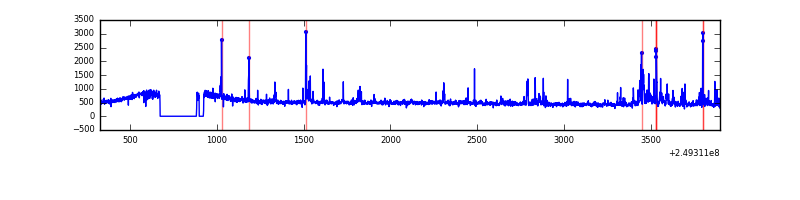 |
| C | 3569 | 3336 | 0 | 0 | 0.00% | 0.00% | 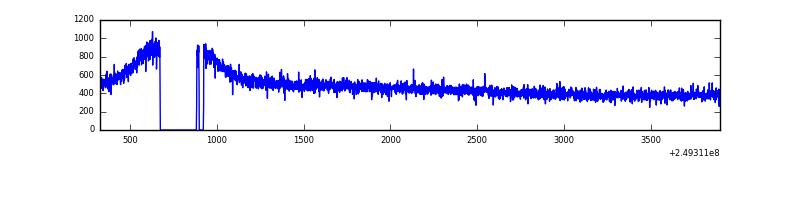 |
| D | 3569 | 3336 | 336 | 336 | 9.41% | 10.07% | 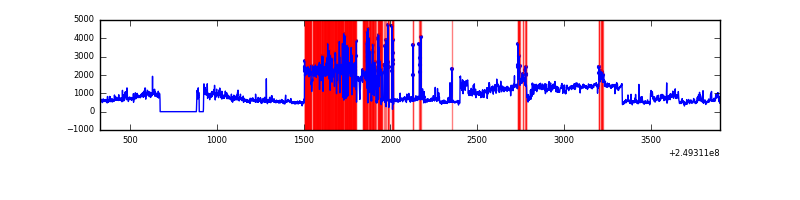 |
Top three noisy pixels from each quadrant. If the there are fewer than three noisy pixels in the level2.evt file, extra rows are filled as -1
| Pixel properties | Quadrant properties | ||||||
|---|---|---|---|---|---|---|---|
| Quadrant | DetID | PixID | Counts | Sigma | Mean | Median | Sigma |
| A | 8 | 5 | 568157 | 6563.7 | 415 | 404 | 86.5 |
| A | 1 | 162 | 85744 | 986.6 | 415 | 404 | 86.5 |
| A | 1 | 178 | 46326 | 530.9 | 415 | 404 | 86.5 |
| B | 4 | 239 | 71713 | 865.04 | 416 | 403 | 82.4 |
| B | 10 | 252 | 55880 | 672.98 | 416 | 403 | 82.4 |
| B | 3 | 189 | 44446 | 534.27 | 416 | 403 | 82.4 |
| C | 13 | 61 | 2942 | 26.65 | 405 | 405 | 95.2 |
| C | 3 | 202 | 969 | 5.92 | 405 | 405 | 95.2 |
| C | -1 | -1 | -1 | -1.0 | 405 | 405 | 95.2 |
| D | 13 | 152 | 1557709 | 16504.24 | 386 | 373 | 94.4 |
| D | 1 | 52 | 320414 | 3391.71 | 386 | 373 | 94.4 |
| D | 8 | 195 | 173678 | 1836.64 | 386 | 373 | 94.4 |
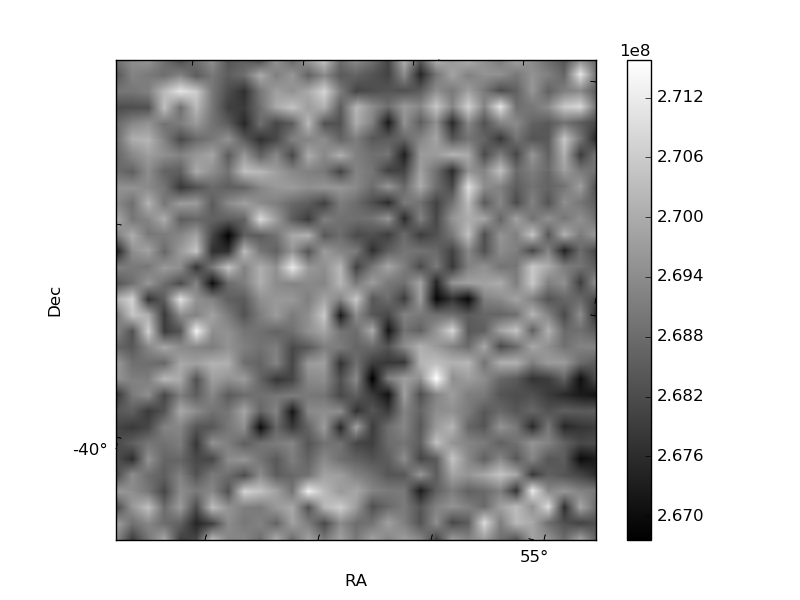
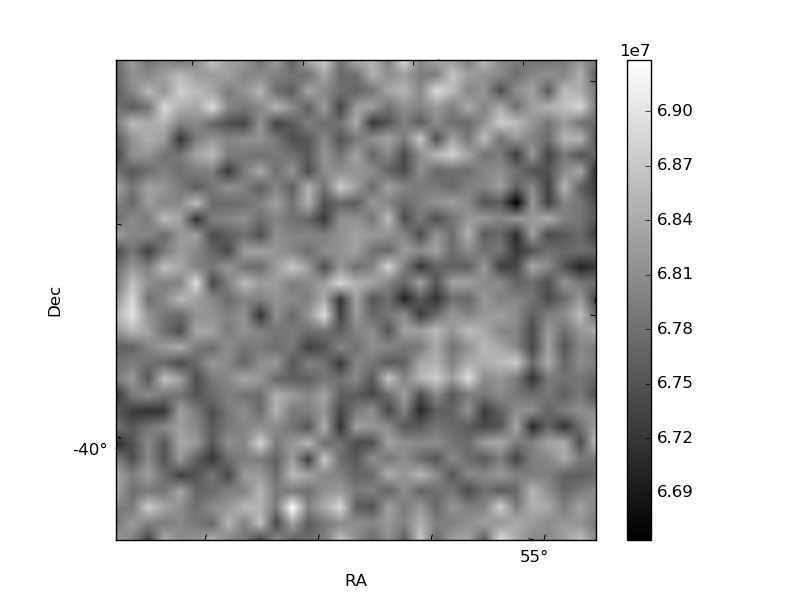
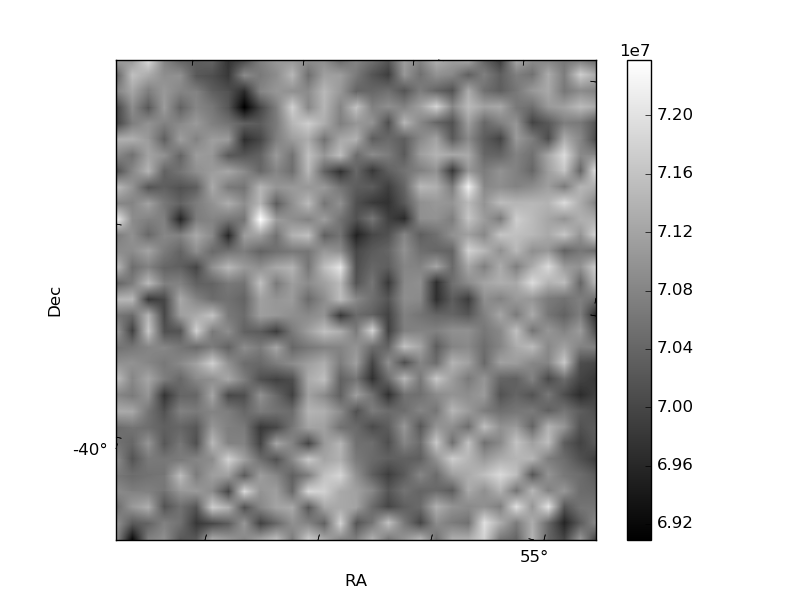
Histogram calculated using DETX and DETY for each event in the final _common_clean file
| Quadrant A | 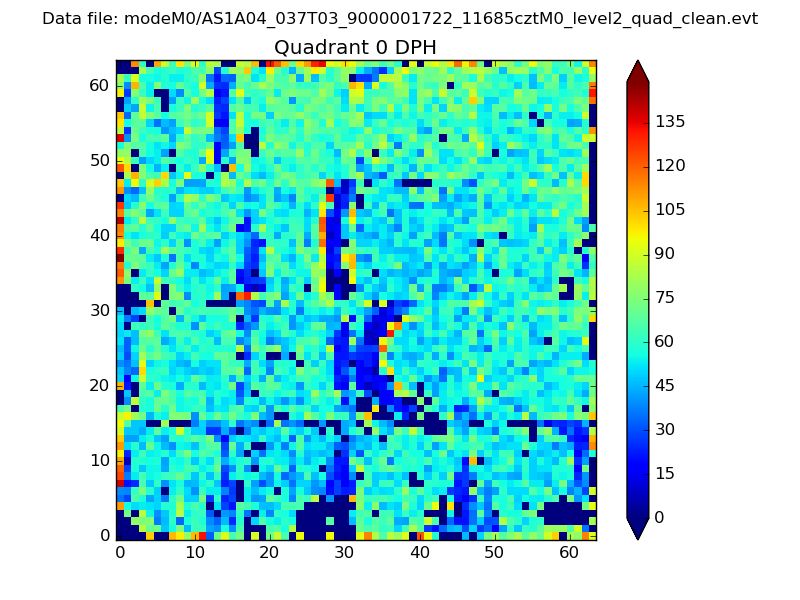 |
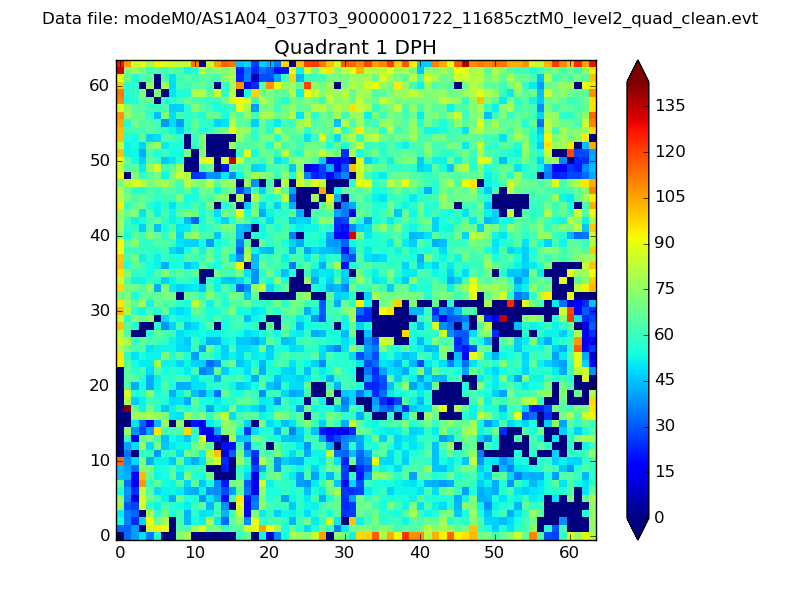 |
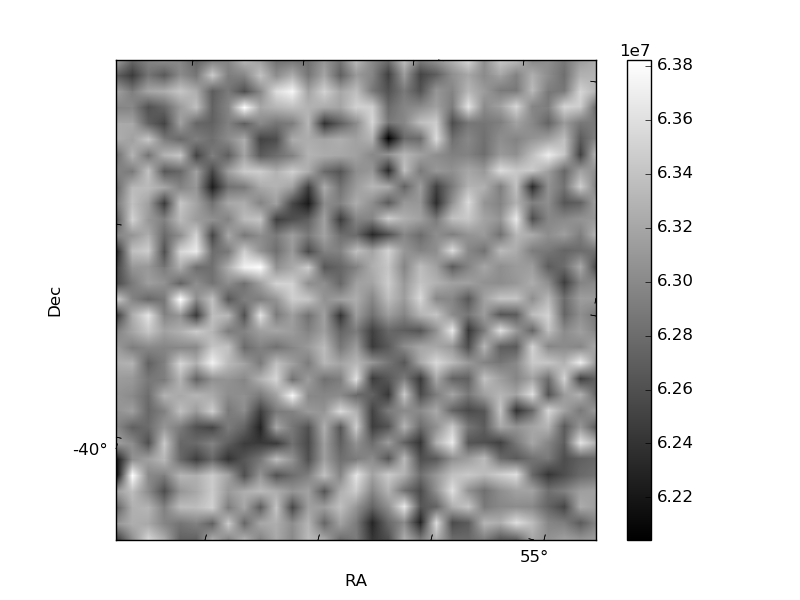
Quadrant B |
|---|---|---|---|
| Quadrant D | 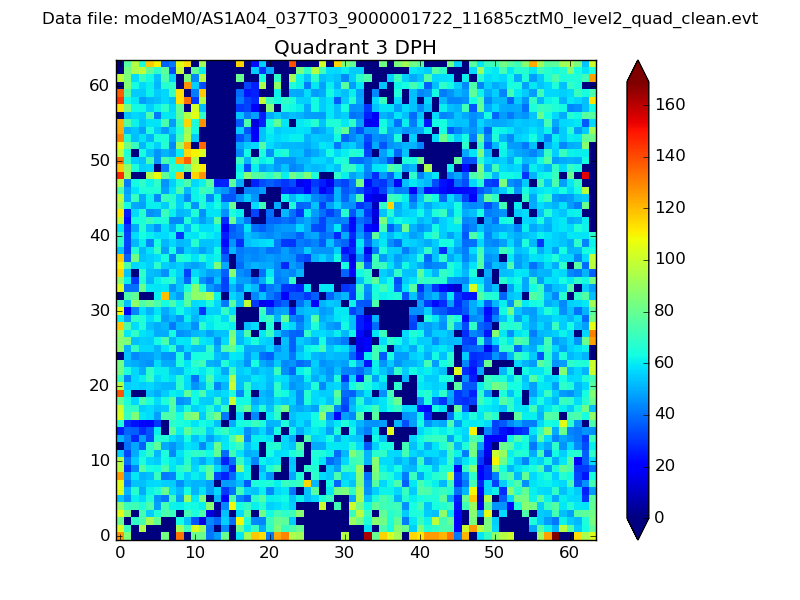 |
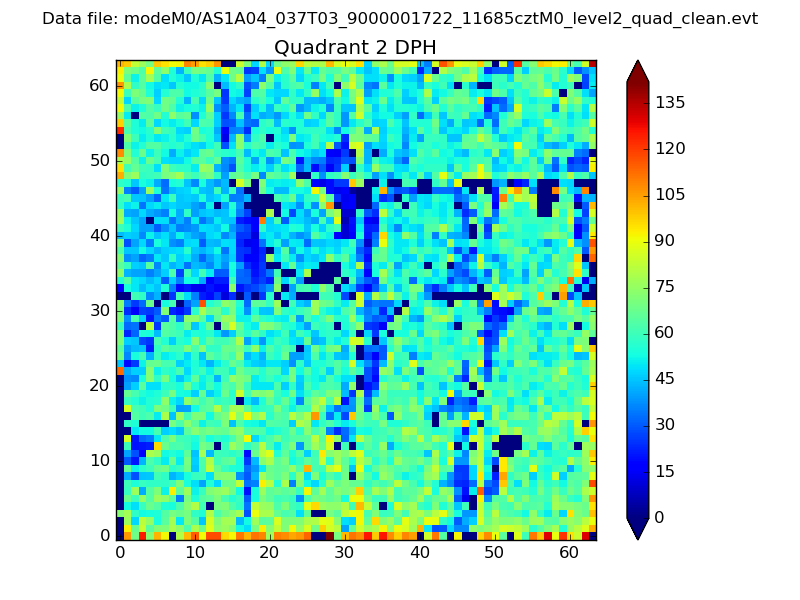 |
Quadrant C |
| Plot type | Count rate plots | Images |
|---|---|---|
| Comparison with Poisson distribution Blue bars denote a histogram of data divided into 1 sec bins. Red curve is a Poisson curve with rate = median count rate of data. |
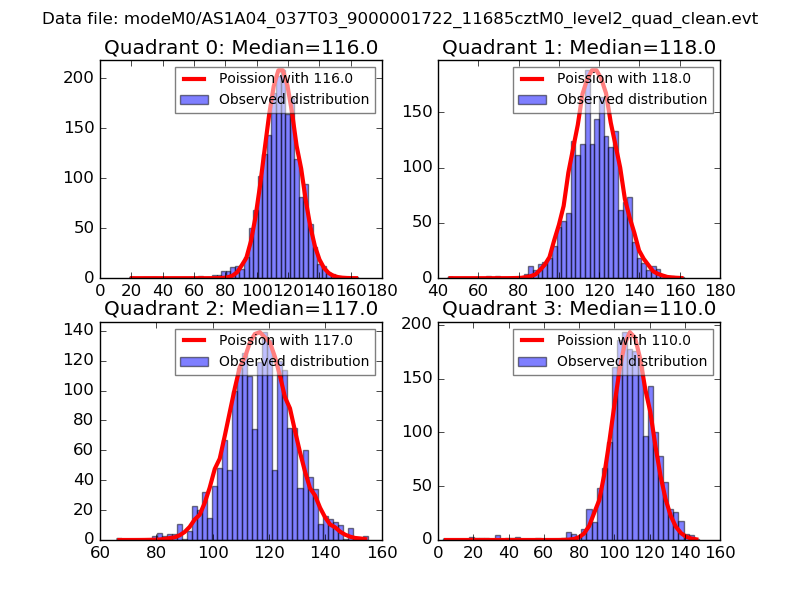 |
 |
| Quadrant-wise count rates Data is divided into 100 sec bins |
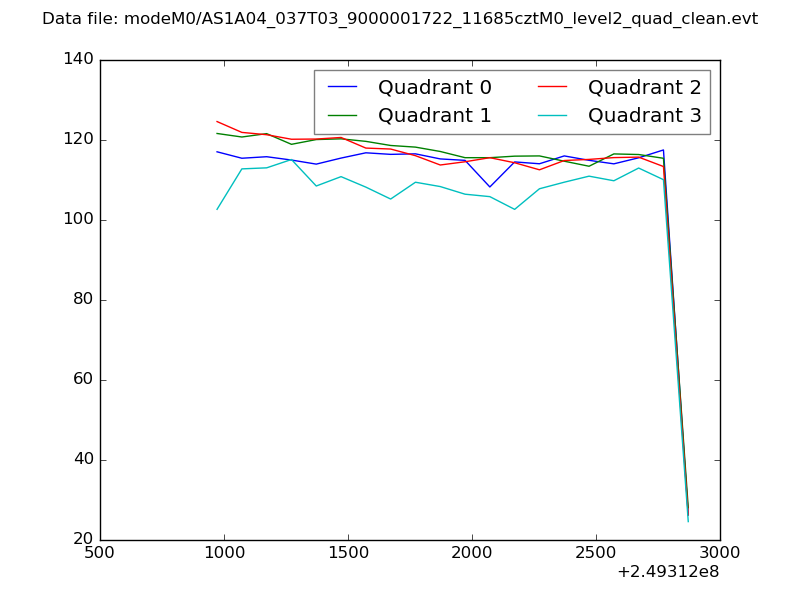 |
|
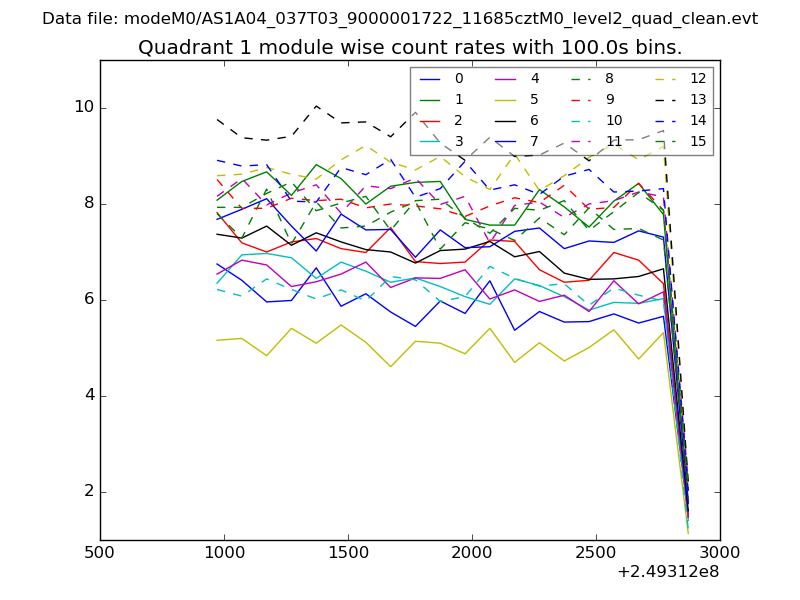
| Module-wise count rates for Quadrant A Data is divided into 100 sec bins |
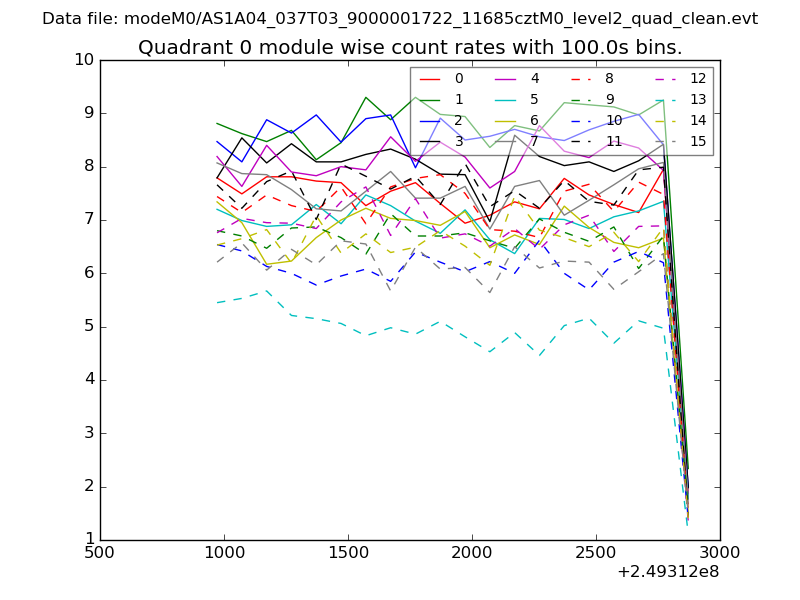 |
 |
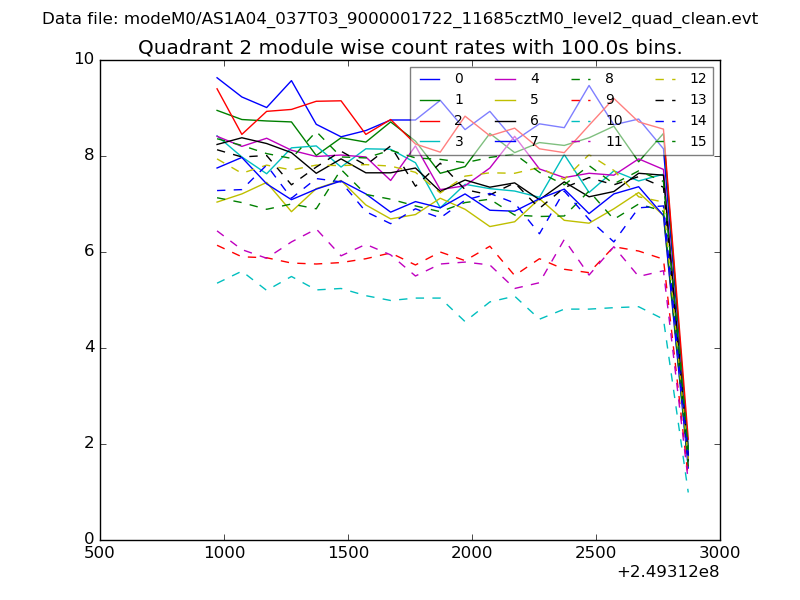
| Module-wise count rates for Quadrant B Data is divided into 100 sec bins |
 |
 |
| Module-wise count rates for Quadrant C Data is divided into 100 sec bins |
 |
 |
| Module-wise count rates for Quadrant D Data is divided into 100 sec bins |
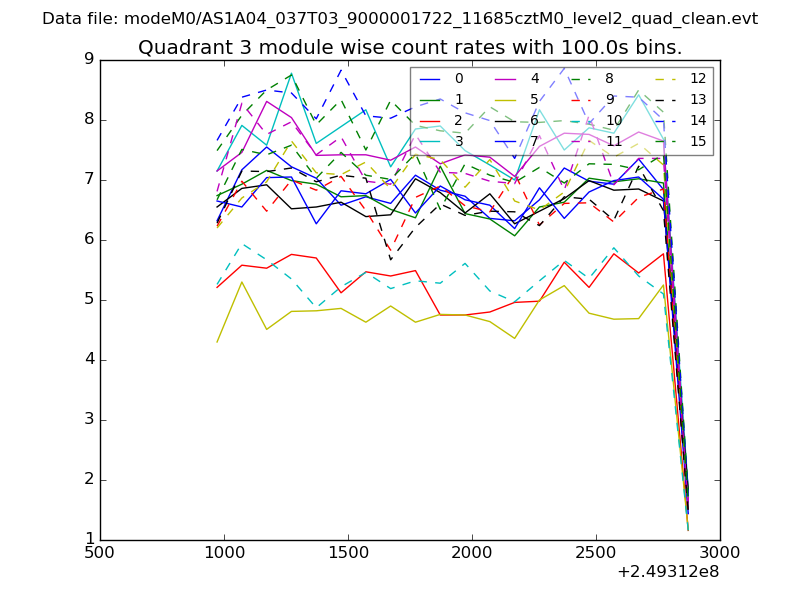 |
 |
| Parameter | Plot |
|---|---|
| CZT HV Monitor | 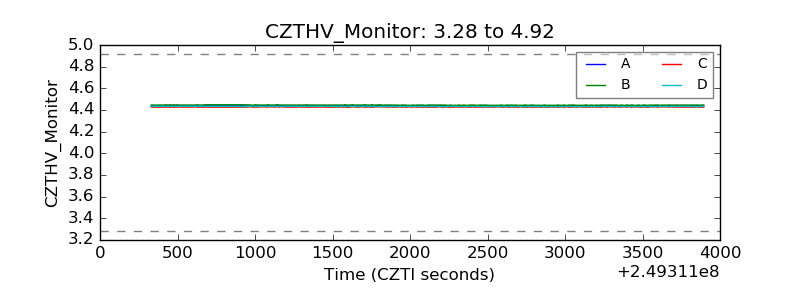 |
| D_VDD |  |
| Temperature 1 | 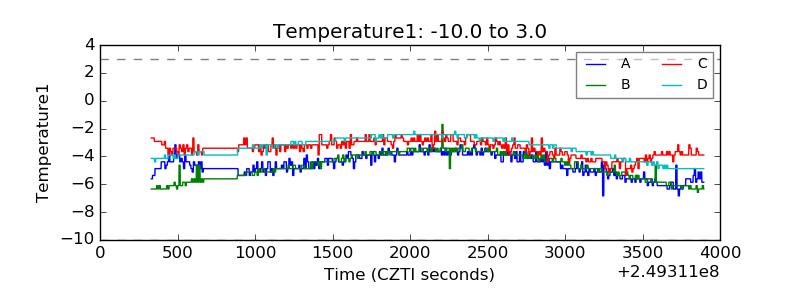 |
| Veto HV Monitor | 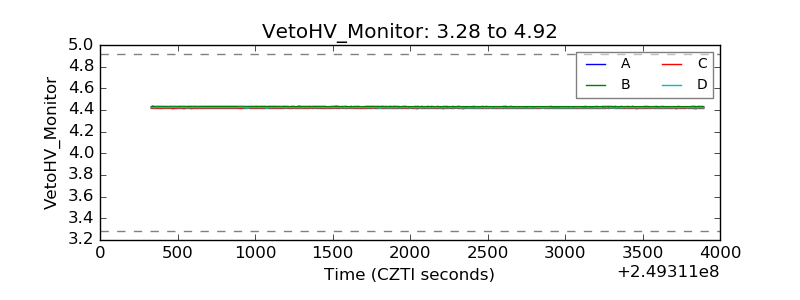 |
| Veto LLD | 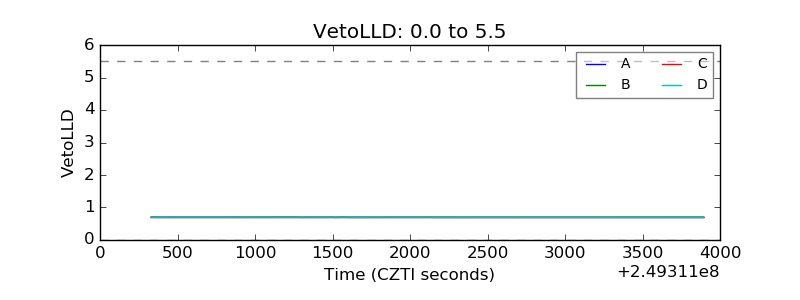 |
| Alpha Counter | 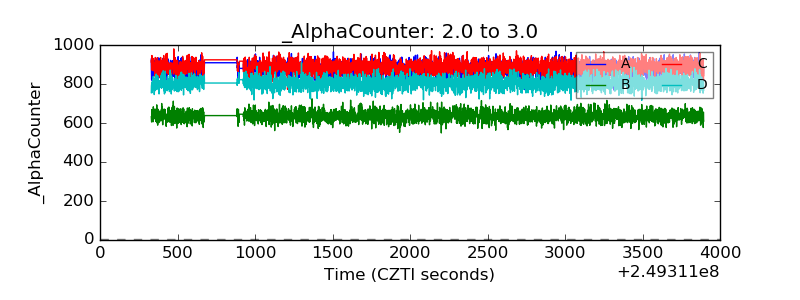 |
| _CPM_Rate | 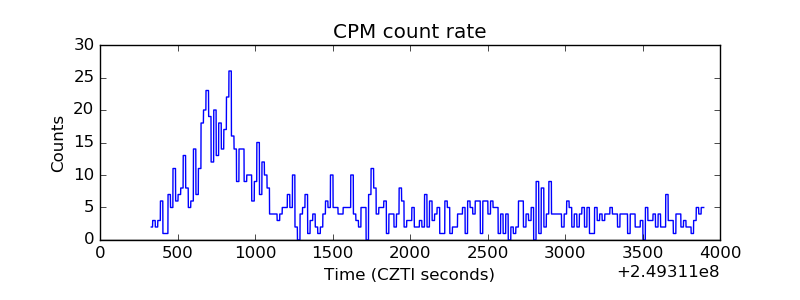 |
| CZT Counter | 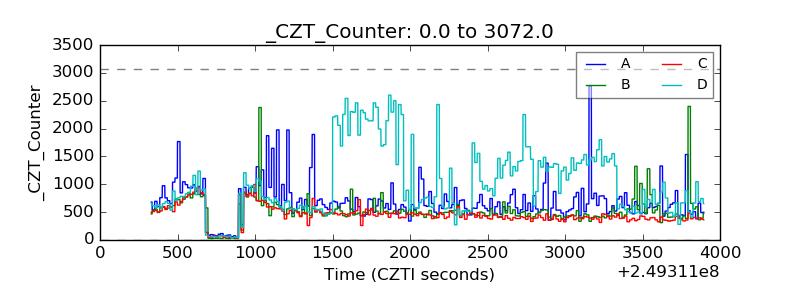 |
| +2.5 Volts monitor |  |
| +5 Volts monitor |  |
| _ROLL_ROT | 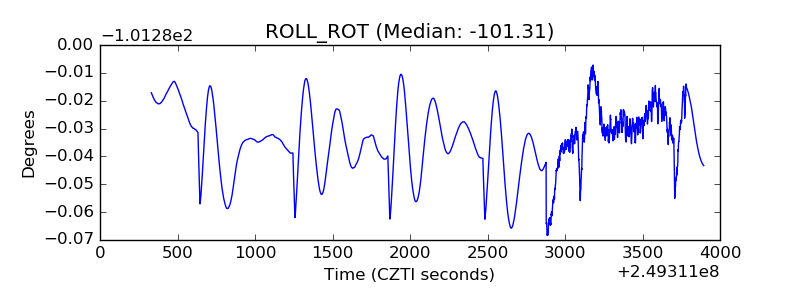 |
| _Roll_DEC | 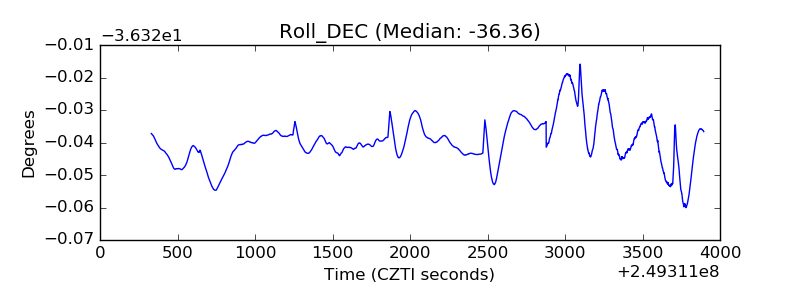 |
| _Roll_RA | 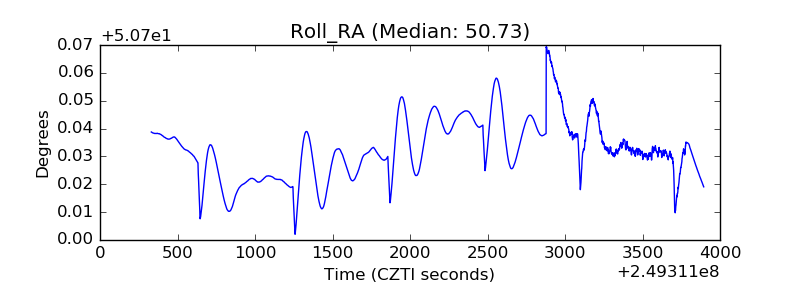 |
| Veto Counter | 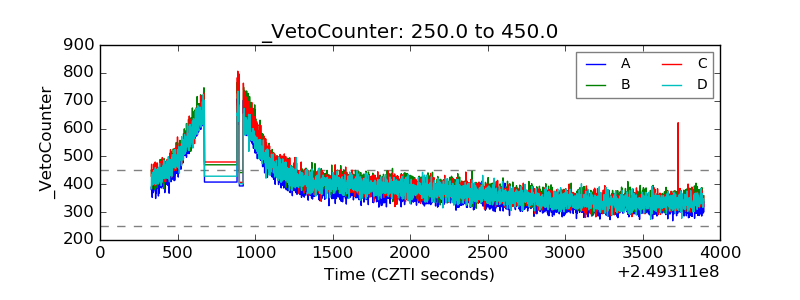 |