| Param | Original file | Final file |
|---|---|---|
| Filename | modeM0/AS1T01_207T01_9000001720cztM0_level2.fits | modeM0/AS1T01_207T01_9000001720cztM0_level2_quad_clean.evt |
| Size (bytes) | 572,857,920 | 545,693,760 |
| Size | 546.3 MB | 520.4 MB |
| Events in quadrant A | 3,325,804 | 3,127,285 |
| Events in quadrant B | 3,337,500 | 3,208,229 |
| Events in quadrant C | 3,527,814 | 3,154,669 |
| Events in quadrant D | 3,007,800 | 2,889,509 |
| Mode M0 | |||
|---|---|---|---|
| Quadrant | BADHDUFLAG | Total packets | Discarded packets |
| A | 0 | 187448 | 0 |
| B | 0 | 150276 | 0 |
| C | 0 | 124325 | 0 |
| D | 0 | 145932 | 0 |
| Mode M9 | |||
|---|---|---|---|
| Quadrant | BADHDUFLAG | Total packets | Discarded packets |
| A | 0 | 88 | 0 |
| B | 0 | 88 | 0 |
| C | 0 | 88 | 0 |
| D | 0 | 88 | 0 |
| Mode SS | |||
|---|---|---|---|
| Quadrant | BADHDUFLAG | Total packets | Discarded packets |
| A | 0 | 1230 | 0 |
| B | 0 | 1230 | 0 |
| C | 0 | 1230 | 0 |
| D | 0 | 1230 | 0 |
| Quadrant | Total seconds | Saturated seconds | Saturation percentage |
|---|---|---|---|
| A | 60444 | 5591 | 9.249884% |
| B | 60444 | 2995 | 4.955000% |
| C | 60444 | 634 | 1.048905% |
| D | 60444 | 1769 | 2.926676% |
Noise dominated data is calculated using 1-second bins in cleaned event files. If a bin has >2000 counts, and if more than 50% of those come from <1% of pixels, then it is considered to be noise-dominated and hence unusable.
| Quadrant | # 1 sec bins | Bins with >0 counts | Bins with >2000 counts | High rate bins dominated by noise | Noise dominated (total time) | Noise dominated (detector-on time) | Marked lightcurve |
|---|---|---|---|---|---|---|---|
| A | 69330 | 60407 | 0 | 0 | 0.00% | 0.00% |  |
| B | 69330 | 60374 | 0 | 0 | 0.00% | 0.00% |  |
| C | 69330 | 60445 | 0 | 0 | 0.00% | 0.00% | 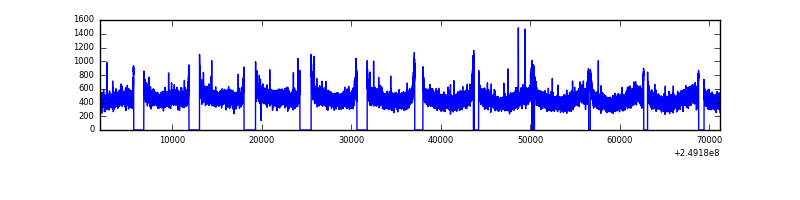 |
| D | 69330 | 60439 | 0 | 0 | 0.00% | 0.00% |  |
Top three noisy pixels from each quadrant. If the there are fewer than three noisy pixels in the level2.evt file, extra rows are filled as -1
| Pixel properties | Quadrant properties | ||||||
|---|---|---|---|---|---|---|---|
| Quadrant | DetID | PixID | Counts | Sigma | Mean | Median | Sigma |
| A | 0 | 29 | 3157 | 11.03 | 867 | 815 | 212.3 |
| A | 7 | 110 | 2722 | 8.98 | 867 | 815 | 212.3 |
| A | 9 | 19 | 2549 | 8.17 | 867 | 815 | 212.3 |
| B | 2 | 9 | 2874 | 11.68 | 881 | 841 | 174.1 |
| B | 3 | 17 | 2249 | 8.09 | 881 | 841 | 174.1 |
| B | 5 | 128 | 2178 | 7.68 | 881 | 841 | 174.1 |
| C | 1 | 80 | 2613 | 7.17 | 931 | 866 | 243.7 |
| C | 1 | 81 | 2579 | 7.03 | 931 | 866 | 243.7 |
| C | 12 | 241 | 2444 | 6.47 | 931 | 866 | 243.7 |
| D | 7 | 3 | 2169 | 6.09 | 859 | 781 | 227.7 |
| D | 6 | 67 | 2118 | 5.87 | 859 | 781 | 227.7 |
| D | 6 | 231 | 2116 | 5.86 | 859 | 781 | 227.7 |
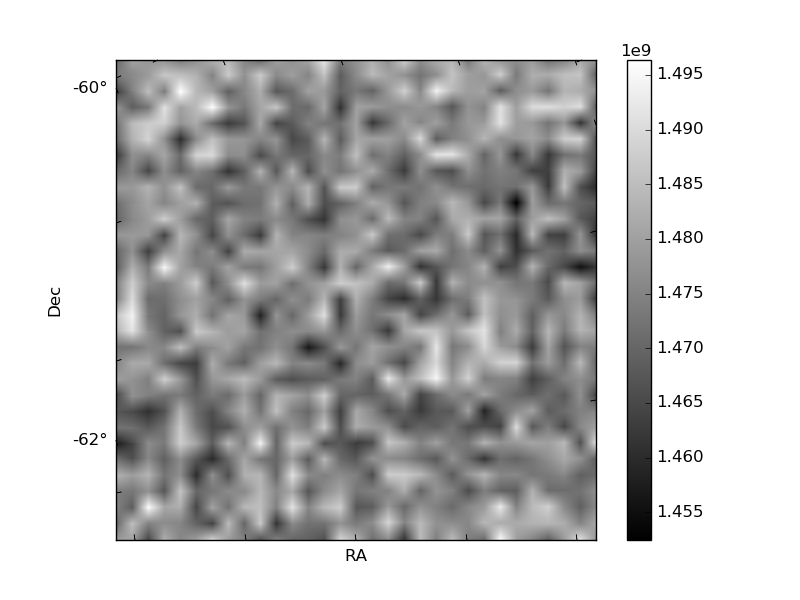
Histogram calculated using DETX and DETY for each event in the final _common_clean file
| Quadrant A |  |
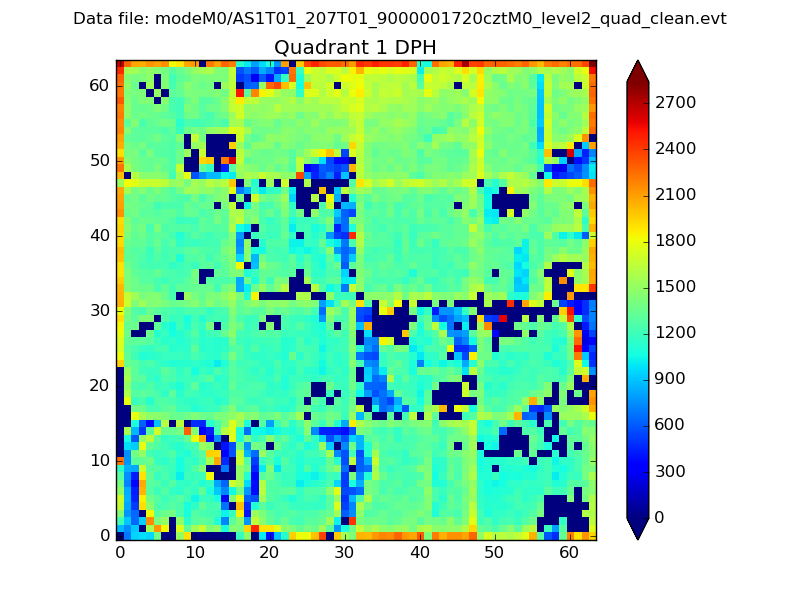 |
Quadrant B |
|---|---|---|---|
| Quadrant D | 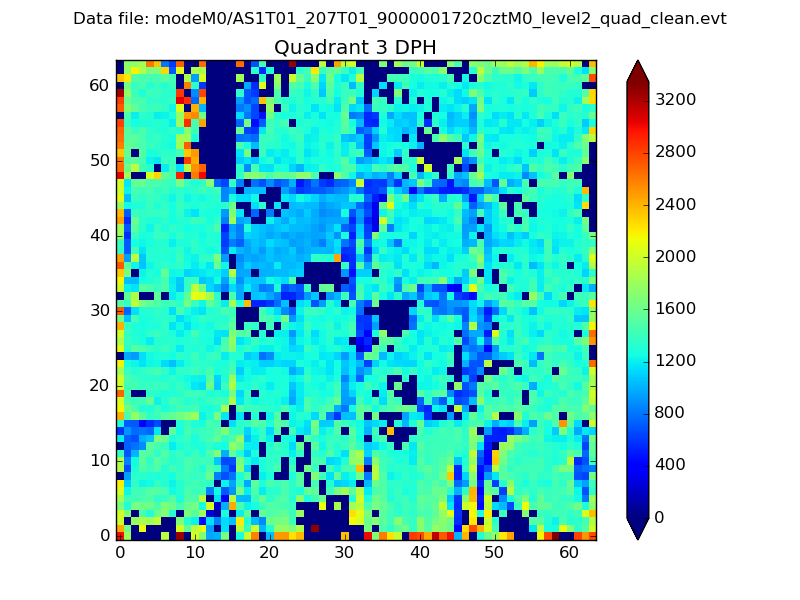 |
 |
Quadrant C |
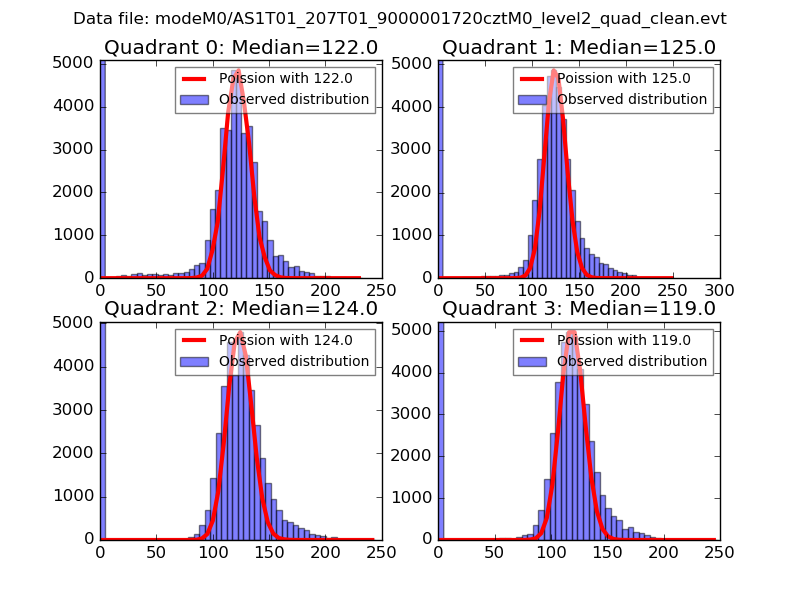
| Plot type | Count rate plots | Images |
|---|---|---|
| Comparison with Poisson distribution Blue bars denote a histogram of data divided into 1 sec bins. Red curve is a Poisson curve with rate = median count rate of data. |
 |
 |
| Quadrant-wise count rates Data is divided into 100 sec bins |
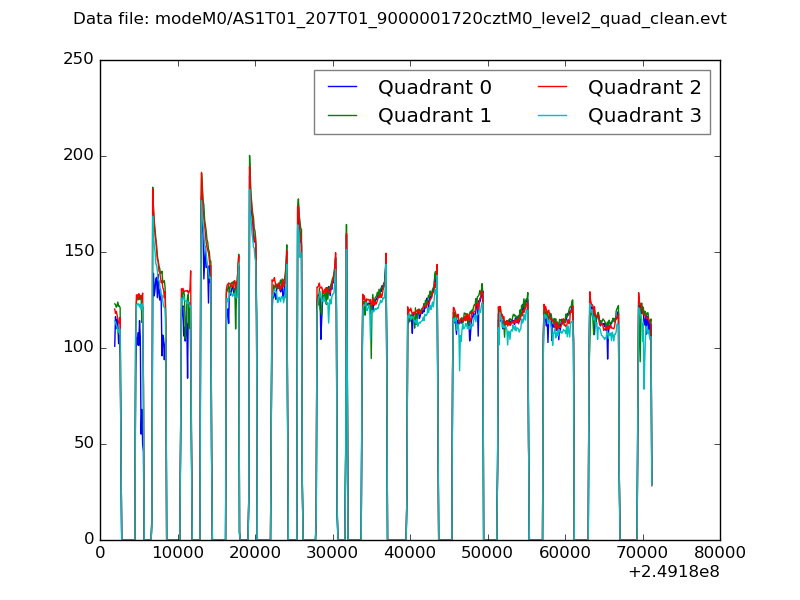 |
|
| Module-wise count rates for Quadrant A Data is divided into 100 sec bins |
 |
 |
| Module-wise count rates for Quadrant B Data is divided into 100 sec bins |
 |
 |
| Module-wise count rates for Quadrant C Data is divided into 100 sec bins |
 |
 |
| Module-wise count rates for Quadrant D Data is divided into 100 sec bins |
 |
 |
| Parameter | Plot |
|---|---|
| CZT HV Monitor |  |
| D_VDD | 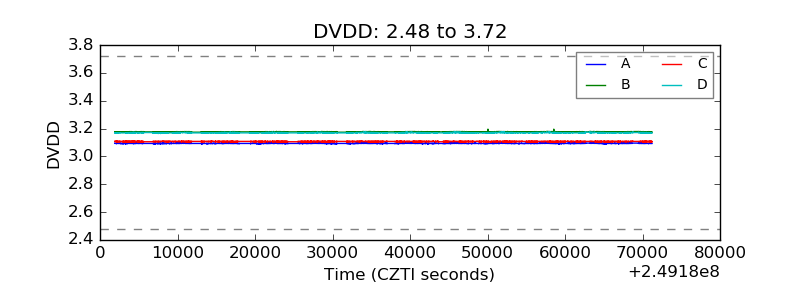 |
| Temperature 1 |  |
| Veto HV Monitor |  |
| Veto LLD |  |
| Alpha Counter |  |
| _CPM_Rate |  |
| CZT Counter |  |
| +2.5 Volts monitor |  |
| +5 Volts monitor |  |
| _ROLL_ROT |  |
| _Roll_DEC |  |
| _Roll_RA | 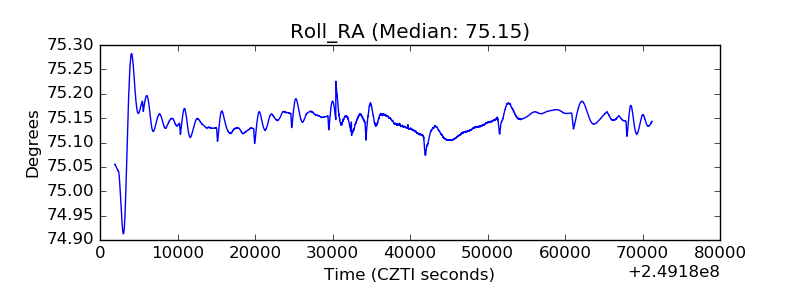 |
| Veto Counter |  |